Lunar regolith and substructure at Chang'E-5 landing site in the northern Oceanus Procellarum
←
→
Page content transcription
If your browser does not render page correctly, please read the page content below
Lunar regolith and substructure at Chang’E-5 landing site in the northern Oceanus Procellarum Hanjie Song State Key Laboratory of Space Weather, National Space Science Center, Chinese Academy of Sciences Hui Sun Faculty of Geosciences and Environmental Engineering, Southwest Jiaotong University Gang Yu School of Electrical Engineering, University of Jinan Yang Liu ( yangliu@nssc.ac.cn ) State Key Laboratory of Space Weather, National Space Science Center, Chinese Academy of Sciences Juan Li State Key Laboratory of Mineral Deposit Research, School of Earth Sciences and Engineering, Nanjing University Menglong Xu Institute of Geophysical and Geochemical Exploration, Chinese Academy of Geological Science Yikang Zheng Institute of Geology and Geophysics, Chinese Academy of Sciences Chao Li Institute of Geology and Geophysics, Chinese Academy of Sciences Yong Pang China Academy of Space Technology, Beijing spacecrafts Guoxin Wang China Academy of Space Technology, Beijing spacecrafts Ping Zhao School of Information Science and Engineering, Shandong Normal University Yongliao Zou State Key Laboratory of Space Weather, National Space Science Center, Chinese Academy of Sciences Article Keywords: lunar regolith, LRPR, radar, imaging, oceanus procellarum Posted Date: September 23rd, 2021 DOI: https://doi.org/10.21203/rs.3.rs-912528/v1
License: This work is licensed under a Creative Commons Attribution 4.0 International License. Read Full License

1           Lunar regolith and substructure at Chang’E-5 landing site in the

 2                                 northern Oceanus Procellarum

 3   Hanjie Song1†, Hui Sun2†, Gang Yu3†, Yang Liu1*, Juan Li4, Menglong Xu5,6,7, Yikang

 4   Zheng8, Chao Li8, Yong Pang9, Guoxin Wang9, Ping Zhao10, Yongliao Zou1

     1
 5       State Key Laboratory of Space Weather, National Space Science Center, Chinese Academy of

 6   Sciences, Beijing 100190, China

     2
 7       Faculty of Geosciences and Environmental Engineering, Southwest Jiaotong University,

 8   Chengdu 611756, China

     3
 9       School of Electrical Engineering, University of Jinan, Jinan 250022, China

     4
10       State Key Laboratory of Mineral Deposit Research, School of Earth Sciences and Engineering,

11   Nanjing University, Nanjing 210023, China

     5
12       Institute of Geophysical and Geochemical Exploration, Chinese Academy of Geological

13   Science, Langfang, 065000, China

     6
14       National Research Center of Geo-Exploration Technology, Langfang, 065000, China

     7
15       Key Laboratory of Geophysical Electromagnetic Probing Technologies of Ministry of Natural

16   Resources, Langfang, 065000, China

     8
17       Institute of Geology and Geophysics, Chinese Academy of Sciences, Beijing 100029, China

     9
18       China Academy of Space Technology, Beijing spacecrafts, Beijing 100190, China

     10
19       School of Information Science and Engineering, Shandong Normal University, Jinan 250358,

20   China

21   *Correspondence to: yangliu@nssc.ac.cn; †Equal contributions to this work.
                                                                                                   1
22   Abstract

23       The Lunar Regolith Penetrating Radar (LRPR) on the Chang’E-5 (CE-5) lander was

24   deployed to investigate structures of the regolith. The migration and ridge detection

25   methods were used to process the radar data, and the results indicate a 4.5 m regolith

26   thickness that contains four units at the landing site, which is characterized by different

27   internal reflections that point to their various compositions, mainly comprise protolith and

28   admixed ejecta from the Harpalus, Copernicus, and Aristarchus. High-resolution

29   processing for the LRPR data indicates a few rocks or slates with depth from ~0.2 m to over

30   1 m in the subsurface at the landing site, which was validated by the force analysis during

31   the drilling of the regolith into ~1 m depth. The processing procedure proposed in this study

32   is capable of producing reliable and precise images of the lunar regolith substructure,

33   which provides important geological context on the returned drilling samples.

34   Introduction

35       As China’s first lunar sample-return mission, and the first lunar return mission of humanity

36   since Soviet Union's Luna 24 in 19761, Chang’E-5 (CE-5) was landed at 43.06◦N, 51.92◦W on the

37   1st December, 2020, which is close to the Mons Rümker, a volcano to the north of Oceanus

38   Procellarum2,3,4. CE-5 brings back 1.731 kg regolith and fragmented rock samples composed of

39   the youngest mare basalts on the moon, which were formed at 1~2 Ga by crater population

40   studies3. The collected samples were postulated to form as results of young volcanism in the

                                                                                                   2
41   landing area2,3,5. The LRPR was one main payload of the lander for CE-5 and used to investigate

42   the shallow structures of the regolith with a 5 cm-scale of high detecting resolution 6,7.

43        The lunar surface is covered by regolith, which experienced continuous asteroid

44   bombardments and long-term volcanic eruptions since its formation8. Processes such as

45   bombardments and volcanic eruptions significantly deformed materials at the lunar surface, and

46   also complicated the subsurface structures, which contain important evidences for the Moon’s

47   surface exploration9. Subsurface structures of the regolith preserve vital clues on the 4 Ga’s lunar

48   history10. Thickness of the regolith was studied by in-situ drilling10, seismic experiments11,

49   microwave remote sensing12, impact crater morphology, and distribution of the crater diameters13,

50   which suggest a range of ~2 m beneath the young lunar maria to over 10 m beneath the lunar

51   highlands of the regolith9,14. Unlike the Apollo Lunar Missions, which conducted Lunar Sounder

52   Experiments15,16, the Chang’E-3 lunar mission conducted the first in-situ Lunar Penetrating Radar

53   (LPR) exploration with wide frequency bands and high spatial resolutions in the Imbrium basin,

54   which unraveled detailed structures of the lunar regolith8,17. Results of the Chang’E-3 LPR data

55   indicate multi-layered ejecta in the Moon’s regolith, and brecciated underlying bedrocks, which

56   significantly improves our understanding of surface evolution and volcanic eruption histories of

57   the Moon8,17. Furthermore, the Chang’E-4 lunar mission conducted the first in-situ LPR

58   exploration and offered valuable information on the farside of the Moon in the Von Kármán

59   crater at the South Pole-Aitken basin9,18. Based on early experiences of the LPR and earlier

60   planetary radars missions, the LRPR is designed to have in-situ operations with multi-

61   inputs/outputs asymmetric antenna arrays attached on the bottom of the CE-5 lander, which
                                                                                                       3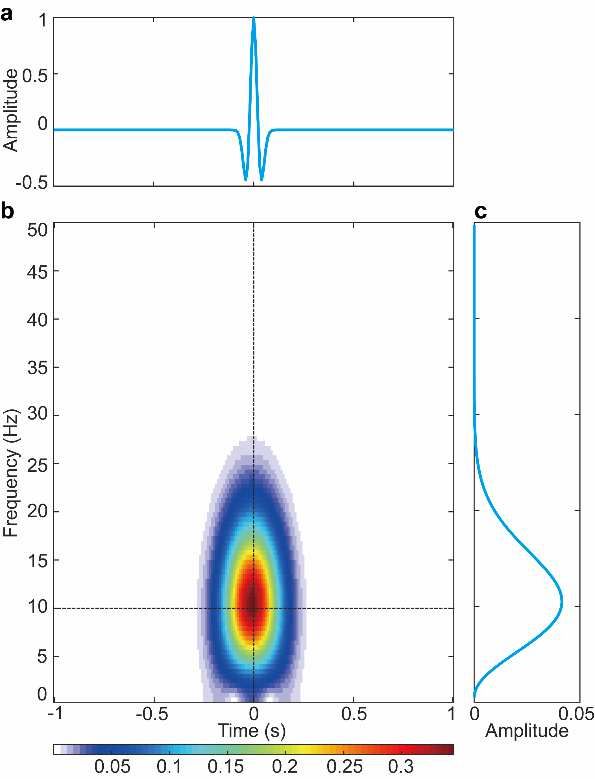
62   includes 12 off-ground high-resolution Vivaldi antennas. Collected data of the LRPR were used

63   to analyses the lunar regolith structures in more details within a detecting depth of ~4.5 m and 5

64   cm-scale resolution, and to support further drilling and sampling missions7.

65       The CE-5 was landed in the northern Oceanus Procellarum (Fig. 1), with some of the

66   youngest mare basalts being discovered on the Moon1. Drilling for the subsurface samples and

67   scooping for the surface samples have great potentials to improve our understandings of thermal

68   evolution and impact histories of the Moon19. Figure 2 presents the initial processed LRPR data,

69   which underwent decoding, denoising, background removal and data gaining processing.

70   Amplitudes of the electromagnetic waves are proportional to the dielectric constants of the lunar

71   regolith or rock contrasts, which are primarily influenced by their porosities and

72   compositions8,13,17. Strong reflections occurred at boundaries between the regolith (fine-grained

73   soil dominated), the ejecta layer (rock clast dominated), the brecciated bedrock zones, and

74   bedrocks, and within the ejecta layer and the brecciated bedrock zones9. Weak reflections occur

75   within a few of scattered rock clasts while no reflection is observed in the fine-grained regolith

76   and homogeneous basalt layers9,20. Further processing of the LRPR data, including Kirchhoff

77   migration21 with envelope processing, and ridge detection22,23 were conducted to enhance the

78   reliability of the depths and shapes of the reflectors (Fig. 3). The LRPR data addressed by

79   bandpass filtering and ridge detection methods were then used to analyze the migration results

80   and to obtain reliable stratigraphic subdivision results, which helped to expound material

81   composition sources at the CE-5 landing site (Fig. 4).

                                                                                                     4
82   Results

 83        Figure 3a shows the processed LRPR data using the Kirchhoff migration21 and Figure 3b

 84   shows the LRPR data generated from ridge detection method22,23, which unravel the thickness and

 85   structures of the lunar regolith with higher-resolution. According to stratigraphic analysis at the

 86   CE-5 landing site, pre-mare basalt materials consist of ancient highland materials including

 87   Procellarum KREEP Terrane crust, ejecta from Iridum Basin, and local silica-rich volcanic3.

 88   Although the ray and secondary crater deposits in the regolith contain important exotic ejecta, the

 89   actual deposits at the CE-5 landing site are still dominated by local materials24,25. The

 90   substructure at the CE5 landing site can be divided into four stratigraphic units according to the

 91   amplitude/energy distribution of the reflections as: strong reflection, sub-strong reflection, weak

 92   reflection and subtle reflection units from top to bottom (unit A to D). Length and tilt direction of

 93   the ridges in Fig. 3b reflect the sizes and arrangement modes of the fragmented rocks, which

94    indicate that units A and C are mainly composed of disordered fragmented rocks. Number of

95    fragmented rocks in units B and C decrease with increasing burial depths. With further increasing

96    depths, rock sizes in unit D are much larger and the reflecting surface is more flattened.

97         The bottom unit D is over 1 m thick, and shows subtle reflection inside, suggesting relatively

98    homogeneous compositions of this layer. Thus, unit D could be deciphered as the basalt bedrock

 99   (Fig. 5), which is postulated to form by the youngest mare volcanism in the landing area24. The

100   weak reflection unit (unit C), with a thickness of ~1.3 m, lies directly on the mare basalt unit (unit

101   D), shows few internal and holonomic reflectors, is inferred as a transition zone containing rock

102   breccia/fractured basalts (Fig. 3). During the accumulation of the ejecta layer, coherent mare
                                                                                                          5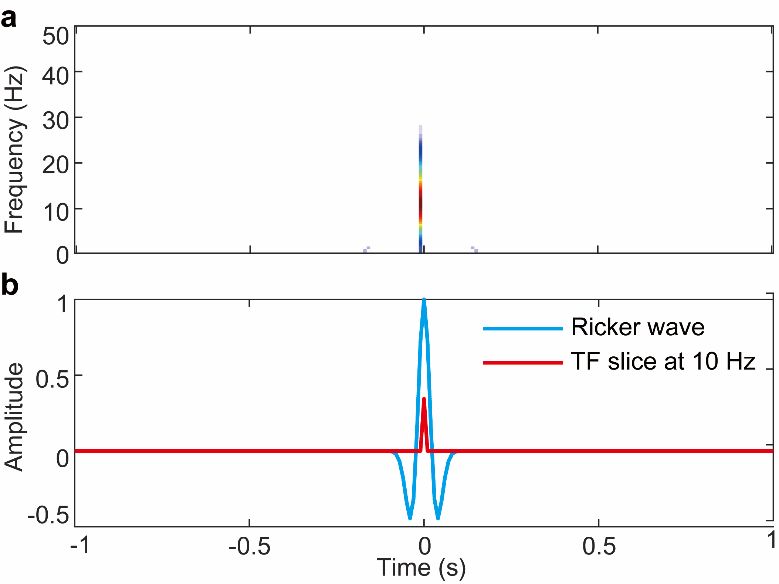
103   basalt at the base of was fractured, but not excavated, resulting in the formation of the proposed

104   transition zone. The sub-strong reflection unit (unit B), with a thickness of ~1.0 m, shows a small

105   number of observed reflectors, indicating rocks originated from crater ejecta. The strong

106   reflection unit (unit A), with a thickness of ~1.5 m, shows abundant and cluttered reflections

107   when compared with that of the lower unit B (Fig. 3), suggesting abundant rock boulders, which

108   were likely originated from the admixed ejecta.

109        According to the geological and stratigraphic analysis at the landing site, the admixed ejecta

110   of unit A were mainly originated from the Harpalus, Copernicus and Aristarchus3 (Fig. 5), with

111   few from the Sharp B, Mairan, and Harding craters (Fig. 1). This ejecta unit shows complex

112   internal structures, which is further divided into three sublayers (Fig. 4a~d). The top sub-layer is

113   ~0.2 m thick, shows homogeneous with fewer scatters, probably indicating fine-grained materials

114   with a scarcity of rock boulders, and hence is deciphered as fine-grained regolith. The middle

115   sublayer is characterized by strong reflections with a thickness of ~1 m, suggesting large sizes of

116   rock boulders or fragments (~10 cm, Fig. 4e and Fig. 4f). The bottom sublayer is ~0.3 m thick

117   and shows obvious weak reflections and indicates few rock fragments when compared with the

118   middle sublayer. The LRPR data reveal that multiple and episodic crater ejecta with increasing

119   intensity occurred at the landing site from unit B to A. The fragment rocks and soil distribute

120   randomly, resulting in the irregular shallow subsurface structures, which offers evidence that

121   young volcanism plays an important role in the formation of the lunar subsurface structures.

122   Detailed structures of the topmost ~2.7 m (Unit A and B) as revealed by the processed LRPR data

123   analysis are consistent with the drilling outcomes.
                                                                                                        6
124 The processing procedures of the LRPR data were proved reliable to reveal the lunar regolith
125 subsurface structures by drilling processes of the CE-5 mission. The analyses of LRPR data show
126 a strong reflection at a depth of ~0.75 m, which is postulated to be fragmented rocks (Fig. 4a).
127 The drilling mission verified that rock fragments occurred at a depth of 0.753 m, which leads to
128 the dramatic increase of pulling force while drilling (Figs. 4a and 4b). Figure 4a also reveals
129 several large force feedback positions (orange arrow), which are highly consistent with the
130 Kirchhoff migration and ridge detection results. The well correlation between our LRPR data
131 analysis and the drilling results strengthens our structural analysis of the lunar regolith and
132 verified that processing procedures in this research are reliable.
133 Discussion
134 Our LRPR data analyses indicate that shallow structures to the north of the Oceanus
135 Procellarum on the Moon’s nearside are dominated by large-scale ejecta and surface regolith. The
136 well-defined subsurface structures are consistent with expectations of shallow structures in the
137 lunar upper crust25,26, supporting the idea that the youngest volcanisms have significant effects on
138 the formation of lunar subsurface structures3,25,27. The regolith and fragmented rock samples
139 collected by CE-5 comprise some of the youngest mare basalts on the moon, which are postulated
140 to form from the young volcanisms19. Our results improve the understandings of lunar thermal
141 evolution and impact histories. LRPR data analyses indicate that the shallow subsurface
142 structures were formed and influenced greatly by impact bombardments, that the shallow
143 subsurface were deformed. The Kirchhoff migration and ridge detection method provide reliable
7144 methods to analyses subsurface structures, which can also be adopted to support future landing-
145 site selection, especially for future sample-return missions.
146 Methods
147 Brief introduction of the LRPR.
148 The LRPR is one of the main payloads on the CE-5 lander, which was deployed to detect
149 lunar regolith thickness and subsurface structures at the landing site to support the drilling and
150 sampling tasks7,25. The LRPR is a time-domain carrier-free picoseconds impulse surface
151 penetrating radar with a Full Width at Half Maximum (FWHM) of 200 ps, which is 90 cm from
152 the lunar surface and operates with frequency ranges of 1~3 GHz7. The LRPR was operated in-
153 situ under static status, with one antenna sending pulse signals and 11 antennas receiving echo
154 signals. The 12 antennas produced 132 traces of data in one operation period, and each trace has a
155 time window of ~55 ns with a temporal sampling interval of 18.3 ps6. Interior structures of the
156 lunar regolith and other subsurface structures were analyzed by the electromagnetic waves
157 reflected from the subsurface. Electromagnetic waves are determined mainly by compositions
158 (for example, FeO and TiO2 contents, see Fig. 5) and porosities of the regolith and other
159 subsurface materials based on the multi-offset migration results, that the LRPR could be
160 effectively used to detect the boundaries between the porous lunar regolith, ejecta, basalt lava
161 layers, and bedrock. The lunar regolith and ejecta layers often contain large rock boulders (larger
162 than the spatial resolution of the radar wave), that signals reflected by the interfaces of these large
163 boulders were detected8.
8164 The LRPR is installed at the bottom of one edge of the lander, which consists of 12 separate
165 antennas with a center working frequency of 2 GHz. Intervals of the array #1~10 is 12 cm and the
166 distance between antenna #7 and #8 is 58.45 cm. Antenna #11 is in the same plane as antennas
167 #1~10, which is ~90 cm from the lunar surface, and 12 cm from antenna #8. Antenna #12 is
168 installed by the side of the lander, which is 16.75 cm, 5.24 cm, and ~107.25 cm from the planes
169 of antennas #1~10, antenna #7 and the lunar surface, respectively. The longest dimension of the
170 antenna array provides a synthetic aperture of ~1.554 m and the diameter of the drill pipe is 3.27
171 cm.
172 Preprocessing of the LRPR data.
173 The original 132 traces of LRPR data were sequenced according to the antenna offsets are
174 shown in Fig. 6a. Pre-processing procedures for the LRPR traces consist of DC removal, cable
175 delay correction, and background removal. We apply a sixth-order Butterworth bandpass filter
176 between 1 and 3 GHz on each trace and remove the background (Fig. 6b). Fig. 6c shows that
177 background removal has a great influence on LRPR data preprocessing.
178 Introduction of the Kirchhoff migration.
179 Migration technology is an important wavefield signal processing method, which is essential
180 for extracting weak signals to produce high-accuracy images of subsurface structures28,29.
181 Migration methods are widely used in seismic exploration and different migration methods were
182 developed to meet different exploration needs. Since the electrical field component of the
183 electromagnetic wave is also consistent with scalar wave equation, many seismic migration
184 methods can be applied to electromagnetic wave signal processing. Migration methods had been
9185 applied to process the LPR data from the Chang’E-3 and Chang’E-4 missions8,9, which verified
186 that migration methods are effective and applicable for high-resolution imaging of the complex
187 subsurface structures and objects in the lunar regolith.
188 Seismic migration methods are divided into different types according to various
189 implementation methods, such as Kirchhoff migration30, Stolt migration (or f-k migration)31,
190 phase-shift migration32 and reverse time migration33,34. Among these methods, Kirchhoff
191 migration is a stable and fast migration algorithm21, which is less dependent on the migration
192 model, and has strong adaptability. In addition, Kirchhoff migration is flexible, which is able to
193 meet processing requirements of irregular observation systems35. Considering that the advantages
194 of Kirchhoff migration are consistent with the characteristics of LRPR data, we used this method
195 for imaging the structures of lunar regolith.
196 The theoretical basis of high-frequency electromagnetic wave Kirchhoff migration is to
197 solve the electric field E ( x, y, z; t ) that satisfies the scalar wave equation through the integration
198 method36
∂2 E ∂2 E ∂2 E 1 ∂2 E
199 + + = ,
∂x 2 ∂y 2 ∂z 2 v ∂t 2
200 where x , y , z represent spatial coordinates and t represents time coordinate; v is the
201 electromagnetic wave velocity. The Kirchhoff integral solution of the wave equation at point
202 ( x0 , y0 , z0 ) have two solutions: the upgoing wavefield and the downgoing wavefield. For the
203 upgoing wavefield
1 ∂ 1 1 ∂r ∂ r
204 Eup ( x0 , =
y0 , z0 ; t ) ∫∫ ∂z r − vr ∂z ∂z E x, y, z; t − v d Ω,
2π Ω
205 and for the downgoing wavefield
101 ∂ 1 1 ∂r ∂ r
206 Edown ( x0 , y0 , z0 ; t ) = ∫∫ − E x, y, z; t + d Ω,
2π Ω ∂z r vr ∂z ∂z v
207 where Ω is the set of points on the surface, r is the distance from point ( x0 , y0 , z0 ) to the point of
208 Ω . According to the exploding source principle28, when t is equal to 0, the electric field
209 represents the imaging result. Therefore, the Kirchhoff migration formula is
1 ∂ 1 1 ∂r ∂ 2r
E ( x0 , y0 , z0 ; 0 ) =
2π ∫∫ ∂z r − vr ∂z ∂z E x, y, 0; v d Ω,
210
Ω
2r
211 where E x, y, 0; represents the received electromagnetic wave signal.
v
212 Introduction of the ridge detection method.
213 Ricker wave pulse signals are created and radiated to the lunar regolith through antennas of the
214 LRPR. Images of the lunar regolith thickness and structures can then be generated according to
215 the backward travelling waves from the spots or interfaces. Travel time of the electromagnetic
216 waves has important effect on high-resolution imaging. To improve imaging quality of the lunar
217 regolith and substructure, it is key to derive accurate arrival time of the backward electromagnetic
218 waves37. Time-frequency analysis (TFA) methods, e.g., short-time Fourier transform (STFT) and
219 continuous wavelet transform, are designed to expand the time-series signals to two-dimensional
220 time-frequency domain38. The joint time-frequency characteristics can be extracted from
221 conventional time-frequency representation. However, conventional methods often have
222 difficulty to achieve the best resolution simultaneously in both time and frequency due to the
223 Heisenberg-Gabor uncertainties, which implies that it is impossible to extract the precise time
224 information from the representation generated by conventional methods alone. To overcome this
225 limitation, this study presents a post-processing technology to extract the precise arrival time of
226 the backward electromagnetic waves, which benefits high-resolution imaging in this study.
11227 The Fig. 7a and 7c show the waveform and frequency spectrum of a simulated Ricker wave
228 at the time instant 0 s, and the central frequency of the signal is 10 Hz. The STFT is used to
229 generate the time-frequency representation of the signal (Fig. 7b). Results show that the time-
230 frequency characteristic has a highly smeared distribution in both time and frequency directions.
231 For an impulse-like signal22,39, it can be modeled from the following frequency expression
sˆ (ω ) = A (ω ) e ( ) ,
iϕ ω
232
233 where ŝ (ω ) denotes the Fourier transform of the signal, A (ω ) and ϕ (ω ) are the signal
234 amplitude and phase in frequency domain, and −ϕ ′ (ω ) is a group delay (GD) parameter. The GD
235 can be used to determine the arrival time instant of the signals for each frequency point22.
236 However, it is necessary to improve the energy concentration of the time-frequency
237 representation to obtain higher accuracies. Recent studies indicate that the GD can be regarded as
238 the ridges of the STFT along the frequency direction22,23, implying that it is possible to estimate
239 the GD from the ridges of the time-frequency representation created by STFT. To obtain the
240 STFT of the signal ŝ (ω ) , a local frequency model is needed and written as
i ϕ (ω ) +ϕ ′(ω )(ξ −ω )
sˆ (ξ ) = A (ω ) e
241 ,
242 where ∃ε is assumed to be sufficiently small, A′ (ω ) ≤ ε and ϕ ′′ (ω ) ≤ ε for ∀ω . Substituting
243 this model into STFT, we derive
+∞
G (t,ω ) ( 2π ) ∫−∞ sˆ (ξ ) gˆ (ξ − ω ) ei (ξ −ω )t d ξ
−1
=
244
=A (ω ) eiϕ (ω ) g ( t + ϕ ′ (ω ) ),
245 where g ( ) is the sliding even window function supp ( g ) ∈ [−∆, ∆] , and ĝ ( ) denotes the Fourier
246 transform of the window function. The spectrogram of the signal can be obtained as
12247 G ( t , ω ) A (ω ) g ( t + ϕ ′ (ω ) ) ,
=
248 It is known from this equation that the time-frequency energy of the signal has a large
249 distribution along the GD trajectory. Amplitude of the spectrogram reaches the maximum along
250 the GD trajectory for each frequency point. This inspires that the GD trajectory can be estimated
251 using the ridge detection method when the following two expressions ∂ G ( t , ω ) ∂t =0 and
252 ∂ 2 G ( t , ω ) ∂t 2 < 0 are satisfied at the same time40,41,42.
253 To improve the energy concentration, spectrogram in the GD trajectory is retained and other
254 coefficients are removed as shown in Fig. 8a. The new time-frequency representation only
255 appears at the GD trajectory when compared to the large spread of the STFT spectrogram. The
256 slice of the new representation at the central frequency is then used to determine the precise time
257 instant when the impulse signal appears (Fig. 8b). Central frequency of the time-frequency
258 representation can be detected using the following expression
259 ωc = arg max
ω
(∫ −∞
+∞
)
G ( t , ω ) dt .
260 The slice at the central frequency can then be used to generate higher-resolution images of
261 the lunar regolith thickness and structures than that of the original time-series waveform of the
262 backward electromagnetic waves. In Fig. 9, a simulated time-series signal of four Ricker waves is
263 used to further confirm the effectiveness of the proposed method.
264 Validation of the geological interpretation.
265 Based on LPRP data analysis, four units with different compositions were classified in this
266 study.
13267 Unit D is characterized with subtle reflections, indicating that the mare basalt is
268 homogeneous, with few fragments being developed. The landing site is near Mons Rümker in the
269 north of the Oceanus Procellarum basin, which is filled with Eratosthenian mare material in the
270 Procellarum KREEP Terrane3. The mare basalts were dated to be younger than 1.6 Ga5,19,24,25,43,
271 and are characterized with significant-high FeO and TiO2 contents (see Fig. 5)19,24,25. The average
272 accumulation rate of regolith is ~5 mm per year and the thickness of regolith at CE-5 landing site
273 was estimated up to ~7 m and ~99% is over 2 m25. The top surface of the mare basalt is identified
274 as 3.5 m in our analyses, which corresponds to the accumulation processing.
275 Units C~A comprise materials of the lunar regolith deposited since Copernican, which were
276 produced by continuous impacting and space weathering processes10,25,44. Unit C is defined as a
277 transition zone with disordered blocks being observed, which were marked by the weak
278 reflections as shown by the LPRP data analysis (Fig. 3). Unit C was formed by intensive and long
279 ejecta processes on the mare basalt, resulting in the development of fragmented rocks. The soil
280 was developed in unit C were originated from the mare basalt.
281 Materials in unit B were Imbrium-aged and Eratosthenian-aged mare basalts, highlands, and
282 impact crater materials, which were postulated to be originated from local materials, admixed
283 ejecta and exotic materials25. Local materials were characterized with high TiO2 contents, that
284 materials of low TiO2 contents were inferred to source from distal ejecta25. Potential ejecta
285 sources include the Aristarchus, Aristoteles, Langrenus, Harpalus, Copernicus, Sharp B, Harding,
286 Robertson craters, and Pythagoras, Philolaus, Hausen craters above 60 degrees45. Considering
287 ages, distribution distances, sizes of the potential impact craters, and the thicknesses and
14288 compositions of craters around the landing site, the Harpalus, Copernicus, and Aristarchus craters
289 with Copernicus ages may have the most significant contributions to the existence of admixed
290 ejecta at the landing site25. Unit B is developed during the initial stage of impact cratering, which
291 shows sub-high reflections on LPRP data due to the significant difference between unit C and
292 unit B in terms of physical properties, size grading, and arrangement modes of materials in these
293 two units.
294 Unit A, which is correspondent to high reflections, shows randomly distributed blocks on the
295 LPRP data. During the development of unit A, more intensive impact ejecta processes occurred
296 first that massive structures were observed, which were followed by space weathering processes.
297 Fine-grained regolith is developing, which is characterized by relatively weak reflections when
298 compared to that of the lower part.
299 References
300 1. Liu, J. J. et al. Landing Site Selection and Overview of China’s Lunar Landing Missions.
301 Space Sci. Rev. 217, 6 (2021).
302 2. Qiao, L. et al. Geology of the Chang'e-5 landing site: Constraints on the sources of samples
303 returned from a young nearside mare. Icarus 364, 114480 (2021).
304 3. Qian, Y. Q. et al. Young lunar mare basalts in the Chang'e-5 sample return region, northern
305 Oceanus Procellarum. Earth Planet. Sci. Lett. 555, 116702 (2020).
306 4. Wang, J. et al. Localization of the Chang’e-5 Lander Using Radio-Tracking and Image-
307 Based Methods. Remote Sens. 13, 590 (2021).
15308 5. Hiesinger H. et al. Ages and stratigraphy of lunar mare basalts: A synthesis. Spec. Pap. Geol.
309 Soc. Am. 477, 1–51 (2011).
310 6. Feng, J. Q. et al. An imaging method for Chang'e-5 Lunar Regolith Penetrating Radar.
311 Planet. Space Sci. 167, 9–16 (2019).
312 7. Li, Y. X. et al. The Imaging Method and Verification Experiment of Chang'E-5 Lunar
313 Regolith Penetrating Array Radar. IEEE Geosci. Remote. Sens. Lett. 99, 1–5 (2018).
314 8. Zhang, J. H. et al. Volcanic history of the Imbrium basin: A close-up view from the lunar
315 rover Yutu. Proc. Natl. Acad. Sci. 112, 5342–5347 (2015).
316 9. Zhang, J. H. et al. Lunar regolith and substructure at Chang’E-4 landing site in South Pole-
317 Aitken basin. Nat. Astron. 5, 1–6 (2021).
318 10. Heiken, G. H., Vaniman, D. T. & French, B. M. Lunar sourcebook: A user’s guide to the
319 Moon: The University of Cambridge (1991).
320 11. Nakamura, Y. et al. Apollo Lunar Seismic Experiment–Final summary. J. Geophys. Res.
321 Space Phys. 87, A117–A123 (1982).
322 12. Fa, W. Z. & Jin, Y. Q. A primary analysis of microwave brightness temperature of lunar
323 surface from Chang-E 1 multi-channel radiometer observation and inversion of regolith layer
324 thickness. Icarus, 207, 605–615 (2010).
325 13. Neish, C. D. et al. Spectral properties of titan’s impact craters imply chemical weathering of
326 its surface. Geophys. Res. Lett. 42, 3746–3754 (2015).
327 14. Montopoli, M. et al. Remote sensing of the Moon's subsurface with multifrequency
328 microwave radiometers: A numerical study. Radio Science 46, 1–13 (2011).
16329 15. Porcello, L. et al. The Apollo lunar sounder radar system. Proc. IEEE 62, 769–783 (1974).
330 16. Ono, T. et al. The Lunar Radar Sounder (LRS) Onboard the KAGUYA (SELENE)
331 Spacecraft. Space Sci. Rev. 154, 145–192 (2010).
332 17. Xiao, L. et al. A young multilayered terrane of the northern Mare Imbrium revealed by
333 Chang’E-3 mission. Science 347, 1226–1229 (2015).
334 18. Li, C. L. et al. The Moon’s farside shallow subsurface structure unveiled by Chang’E-4
335 Lunar Penetrating Radar. Sci. Adv. 6, eaay6898 (2020).
336 19. Qian, Y. Q. et al. The Long Sinuous Rille System in Northern Oceanus Procellarum and Its
337 Relation to the Chang'e-5 Returned Samples. Geophys. Res. Lett. 48, 11 (2021).
338 20. Lv, W. M. et al. Comparative analysis of reflection characteristics of lunar penetrating radar
339 data using numerical simulations. Icarus 350, 113896 (2020).
340 21. Docherty, P. A brief comparison of some Kirchhoff integral formulas for migration and
341 inversion. Geophysics 56: 1164–1169 (1991).
342 22. Yu, G. & Lin, T. R. Second-order transient-extracting transform for the analysis of
343 impulsive-like signals. Mech. Syst. Signal Process. 147, 107069 (2021).
344 23. Yu, G. A concentrated time–frequency analysis tool for bearing fault diagnosis. IEEE Trans.
345 Instrum. Meas. 69, 371–381 (2019).
346 24. Qian, Y. Q. et al. Geology and Scientific Significance of the Rümker Region in Northern
347 Oceanus Procellarum: China's Chang'E-5 Landing Region. J. Geophys. Res. Planets 123,
348 1407–1430 (2018).
17349 25. Qian, Y. Q. et al. China's Chang'e-5 landing site: Geology, stratigraphy, and provenance of
350 materials. Earth Planet. Sci. Lett. 561, 116855 (2021).
351 26. McGetchin, T. R. et al. Radial thickness variation in impact crater ejecta: implications for
352 lunar basin deposits. Earth Planet. Sci. Lett. 20, 226–236 (1973).
353 27. Zhang, F. et al. The lunar mare ring-moat dome structure (RMDS) age conundrum:
354 Contemporaneous with Imbrian-aged host lava flows or emplaced in the Copernican?. J.
355 Geophys. Res. Planets 126, e2021JE006880 (2021).
356 28. Claerbout, J. F. Imaging the Earth’s Interior: Blackwell Scientific (1985).
357 29. Yilmaz, Ö. Seismic Data Processing: Society of Exploration Geophysicists (1987).
358 30. Schneider, W. A. Integral formulation for migration in two and three dimensions.
359 Geophysics 43, 49–76 (1978).
360 31. Stolt, R. Migration by fourier transform. Geophysics 43, 23–48 (1978).
361 32. Gazdag, J. Wave equation migration with the phase-shift method. Geophysics 43, 1342–1351
362 (1978).
363 33. Baysal, E. et al. Reverse time migration. Geophysics 48, 1514–1524 (1983).
364 34. Liu, H. et al. Two-Dimensional Reverse-Time Migration Applied to GPR with a 3-D-to-2-D
365 Data Conversion. IEEE J. Sel. Top. Appl. Earth Obs. Remote Sens. 10, 4313–4320 (2017).
366 35. Jäger, C. et al. True-amplitude Kirchhoff migration from topography. SEG Technical
367 Program Expanded Abstracts 22: 909–912 (2003).
368 36. Roberts, R. L. & Daniels, J. J. Modeling near-field GPR in three dimensions using the FDTD
369 method. Geophysics 62, 1114–1126 (1997).
18370 37. Morlet, J. et al. Wave propagation and sampling theory–Part I: complex signal and scattering
371 in multilayered media. Geophysics 47, 203–221 (1982).
372 38. Mallat, S. A. Wavelet Tour of Signal Processing: The Sparse Way: Academic Press (2008).
373 39. Boashash, B. Time-Frequency Signal Analysis and Processing: A Comprehensive Reference:
374 Academic Press (2015).
375 40. Delprat, N. et al. Asymptotic wavelet and Gabor analysis: extraction of instantaneous
376 frequencies. IEEE Trans. Inf. Theory 38, 644–664 (1992).
377 41. Carmona, R. A. et al. Characterization of signals by the ridges of their wavelet transforms.
378 IEEE Trans. Signal Process. 45, 2586–2590 (1997).
379 42. Stanković, L. et al. Instantaneous frequency in time–frequency analysis: Enhanced concepts
380 and performance of estimation algorithms. Digital Signal Process. 35, 1–13 (2014).
381 43. Wu, B. et al. Rock abundance and crater density in the candidate Chang’E-5 landing region
382 on the Moon. J. Geophys. Res. Planets 123, 3256–3272 (2018).
383 44. Head, J.W. et al. Rethinking lunar mare basalt regolith formation: new concepts of lava flow
384 protolith and evolution of regolith thickness and internal structure. Geophys. Res. Lett. 47,
385 e2020GL088334. (2020).
386 45. Xie, Y. Q. et al. The provenance of regolith at the Chang'e‐5 candidate landing region. J.
387 Geophys. Res. Planets 125, 2019JE006112 (2020).
19388 Data availability
389 The data used in this work is available on the Science and Application Center for Moon and Deep
390 Space Exploration, Chinese Academy of Sciences (http://moon.bao.ac.cn).
391 Code availability
392 The code for processing the LRPR data is available from the corresponding author upon
393 reasonable request.
394 Acknowledgments
395 The CE-5 mission was carried out by the Chinese Lunar Exploration Program, and the data were
396 provided by the China National Space Administration and National Astronomical Observatory,
397 Chinese Academy of Sciences. This research was funded by the National Key R&D Program of
398 China (grant number: 2020YFE0202100), the National Natural Science Foundation of China
399 (grant number: 11941001), the pre-research project on Civil Aerospace Technologies funded by
400 Chinese National Space Administration (CNSA) (grant number: D020201 and D020203).
401 Author contribution
402 Y. L. and H.J.S. conceived and designed the experiments; H.J.S., H.S., G.Y., Y.Z., C.L. and P.Z.
403 performed the experiments and analyzed the data; H.J.S., J.L., M.X., A.Z., X.W., Y.P. and Y.L.Z.
404 interpreted the lunar geology; H.S. and Y.Z. implemented migration; G.Y. and P.Z. implemented
405 time-frequency division; H.J.S., H.S., G.Y., J.L. and M.X. wrote the paper.
406 Competing interests
20407 The authors declare no competing interests.
408 Additional information
409 Correspondence and requests for materials should be addressed to Y. L.
21410
411 Fig. 1 Location of the CE-5 landing site. a The location of the CE-5 landing site is at the
412 nearside of the Moon (blue cross). The background map is obtained by Chang’E-2
413 (http://moon.bao.ac.cn). Materials origins in the study area mainly include the Copernicus,
414 Aristarchus, and Harpalus craters (red dot), with scarce secondary materials from the Sharp B,
415 Mairan, and Harding craters (orange dot). Other materials origins in the area may include the
416 Markov, Plato, etc. (green dot). b Photo taking by the camera under the CE-5 lander during
417 descending. c Panoramic image at the landing site.
22418
419 Fig. 2 The LRPR data include 132 traces, which is sequenced according to the antenna
420 offsets. The vertical axis refers to two-way travel time and the horizontal axis is the number of
421 traces. Grayscale indicate amplitudes. Pre- and post-background-removal of the LRPR data are
422 shown in Fig. 6.
23423
424 Fig. 3 LRPR data processing using the Kirchhoff migration and ridge detection method
425 within ~4.5 m of burial depth. a Kirchhoff migration on recovering the true depths and shapes
426 of the subsurface structures. Signals envelopes were calculated using the Hilbert transform along
427 depths, which are used to unravel lunar regolith thickness and structures. b Improved LRPR data
428 from time-frequency slices at the central frequency after ridge detection. Black dotted lines
429 represent the drilling location and the red dotted line represents the depth of obstacles
430 encountered while drilling (~0.75 m). Black arrows indicate the main delamination position of
431 units A-D and the blue arrows indicate the detailed delamination position in unit A.
24432
433 Fig. 4 Time-Frequency division results of the processed LRPR data using the Kirchhoff
434 migration and ridge detection method within ~1.5 m. a and b Detailed structures within depth
435 of 1.5 m. The orange curve represents the pulling force curve using a low-pass filter, which
436 remains several main force positions. The red arrows indicate the large force feedback positions
437 (e.g. 0.753 m). c and e Signals along the depth direction were decomposed into low and high
438 frequency bands using bandpass filtering. d and f the corresponding LRPR data after ridge
439 detection.
25440
441 Fig. 5 a FeO content, b TiO2 content and geological map around the CE-5 landing site in the
442 northern Oceanus Procellarum. The CE-5 landing site belongs to the eastern mare unit, which
443 has high FeO and TiO2 contents.
26444
445 Fig. 6 The LRPR data processing. a The original 132 traces of LRPR data sequenced according
446 to the antenna offsets. b Pre-processing results of the LRPR data. Processing procedures include
447 DC removal, cable delay correction, and background removal. c Comparison of the influence of
448 background removal on LRPR data preprocessing.
27449
450 Fig. 7 The STFT processing of a simulated Ricker wave. a The time-series waveform of a
451 simulated Ricker wave. b Time-frequency representation of the signal generated by STFT. c The
452 frequency spectrum of the signal. The STFT has the capacity to expand one-dimensional signals
453 into two-dimensional time-frequency domain. However, the time-frequency energy has a large
454 distribution, which has negative effect to determine accurate travel time of the reflected
455 electromagnetic waves.
28456
457 Fig. 8 Ridge detection processing. a The time-frequency representation using ridge detection. b
458 The time-frequency slice at the central frequency point compared to the original Ricker wave.
459 The time-frequency representation after ridge detection has a highly energy concentrated
460 distribution, which can be used to abstain the precise travel time of the Ricker wave.
29461
462 Fig. 9 Ridge detection processing for a simulated multi-component signal. a A simulated
463 time-series signal consisting of four Ricker waves. b The time-frequency representation generated
464 by STFT. c The time-frequency representation after ridge detection. d The time-frequency slice at
465 the central frequency point. This simulation further confirms that the concentrated time-frequency
466 representation has better capacity to determine the precise travel time of the Ricker wave.
30You can also read