Simultaneous measurement of breathing rate and heart rate using a microbend multimode fiber optic sensor
←
→
Page content transcription
If your browser does not render page correctly, please read the page content below
Simultaneous measurement of
                 breathing rate and heart rate using a
                 microbend multimode fiber optic
                 sensor

                 Zhihao Chen
                 Doreen Lau
                 Ju Teng Teo
                 Soon Huat Ng
                 Xiufeng Yang
                 Pin Lin Kei

Downloaded From: https://www.spiedigitallibrary.org/journals/Journal-of-Biomedical-Optics on 30 Nov 2021
Terms of Use: https://www.spiedigitallibrary.org/terms-of-use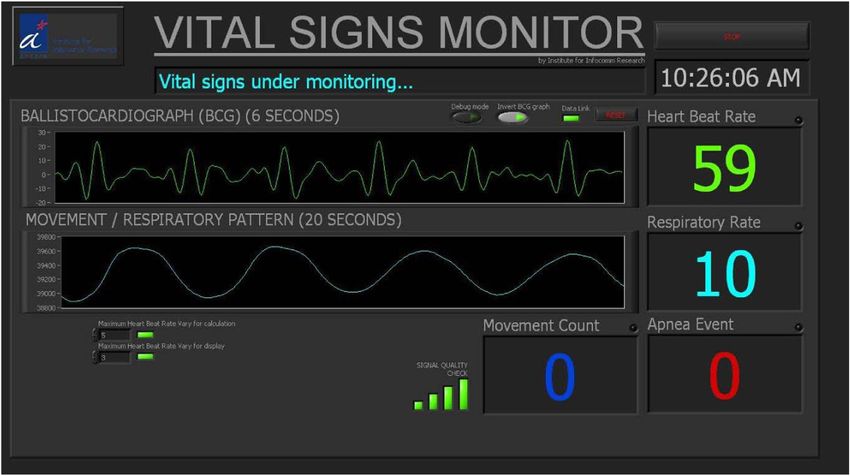
Journal of Biomedical Optics 19(5), 057001 (May 2014)

                Simultaneous measurement of breathing rate and
                heart rate using a microbend multimode fiber optic
                sensor
                Zhihao Chen,a,* Doreen Lau,b Ju Teng Teo,a Soon Huat Ng,a Xiufeng Yang,a and Pin Lin Keib
                a
                 Neural and Biomedical Technology Department, Institute for Infocomm Research, 1 Fusionopolis Way, Connexis, Singapore 138632, Singapore
                b
                 Singapore General Hospital, Department of Diagnostic Radiology, Outram Road, Singapore 169608, Singapore

                              Abstract. We propose and demonstrate the feasibility of using a highly sensitive microbend multimode fiber
                              optic sensor for simultaneous measurement of breathing rate (BR) and heart rate (HR). The sensing system
                              consists of a transceiver, microbend multimode fiber, and a computer. The transceiver is comprised of an optical
                              transmitter, an optical receiver, and circuits for data communication with the computer via Bluetooth.
                              Comparative experiments conducted between the sensor and predicate commercial physiologic devices
                              showed an accuracy of 2 bpm for both BR and HR measurement. Our preliminary study of simultaneous meas-
                              urement of BR and HR in a clinical trial conducted on 11 healthy subjects during magnetic resonance imaging
                              (MRI) also showed very good agreement with measurements obtained from conventional MR-compatible devi-
                              ces. © 2014 Society of Photo-Optical Instrumentation Engineers (SPIE) [DOI: 10.1117/1.JBO.19.5.057001]
                              Keywords: breathing rate; heart rate; body movement; ballistocardiogram; nonintrusive monitoring; microbend fiber optic sensor.
                              Paper 140079R received Feb. 8, 2014; revised manuscript received Mar. 31, 2014; accepted for publication Apr. 2, 2014; published
                              online May 1, 2014.

                1    Introduction                                                                  designed a macrobending sensor that allowed for the monitoring
                Simultaneous monitoring of vital signs using nonintrusive meth-                    of BR, without simultaneous measurement of BR and HR. The
                ods is an important tool in “point-of-care” healthcare sensing.                    sensitivity of this macrobending sensor is also too low for detec-
                The continuous measurement of cardiopulmonary parameters                           tion of very weak cardiac-induced vibrations. Hetero-core fiber
                such as the breathing rate (BR) and heart rate (HR) allows medi-                   optic pressure sensors have been proposed for respiration and
                cal professionals to make timely evaluation on the patient’s                       body movement analysis3 without HR measurement. Fiber
                physiological condition and implement appropriate interven-                        Bragg grating (FBG)-based sensors, which have been widely
                tion, in various applications such as telemedicine, critical                       used in structural health monitoring, have recently been pro-
                care, diagnostic imaging, home, and rehabilitative care.                           posed for vital signs monitoring. Dziuda et al.4,5 illustrated
                    In recent years, there has been a rapid emergence of multipara-                the use of FBG sensors for the simultaneous measurement of
                meter physiologic monitors operating on a nonintrusive platform.                   BR and HR. However, this wavelength detection-based technol-
                The new monitors are more comfortable and easy for patient use                     ogy used in the FBG sensors is too complex and expensive for
                and enable the automatic measurement of vital signs, without                       sensor fabrication and instrumentation. A fiber optic statistical
                constraint to the person’s activities. These include the Emfit sen-                mode sensor and a high-order mode excitation sensor have also
                sor (Emfit Ltd., Kuopio, Finland) and the EarlySense System                        been proposed for BR and HR measurement.6 These sensors
                (EarlySense, Ramat Gan, Israel) monitors. Nevertheless, the                        nevertheless required highly coherent light source and a
                use of such electronic sensors are limited in magnetic resonance                   bulky high-order mode generator respectively to operate, and
                imaging (MRI), particularly in high-field MRI environment, as                      no ballistocardiogram (BCG) waveforms were reported.
                they are prone to electromagnetic interference and radiofrequency                  Long-period fiber grating-based sensor and fiber laser have
                (RF) heating.1 There is thus an increasing market demand for                       also been used in the monitoring of BR.7,8 Although the inter-
                safer and effective technical solutions.                                           ferometric fiber optic breathing and HR sensor9 has high sensi-
                    The use of optical fiber sensors as physiologic monitors is an                 tivity in detection, construction of the sensor system and
                attractive option in high-field MRI environment. These optical                     interrogation is complex and expensive. Last but not least, opti-
                fibers are intrinsically safe for patient use as they are inert to                 cal fiber sensing based on plethysmography method for BR and
                chemical and are nontoxic. Their dielectric nature and small                       HR measurement has been used only for light transmission, but
                diameter also allow for their easy installation into miniaturized                  not for the sensing element.10
                devices or embedment into medical textiles. In particular, optical                     The optical fiber sensor types discussed above may not be the
                fiber sensors are safe for real-time physiologic monitoring dur-                   best sensors for industrial acceptance and clinical use due to
                ing MRI as they are nonferromagnetic, thus immune from                             their bulkiness, design complexity, low-sensor sensitivity, and
                electromagnetic and RF interference.                                               high-system costs. Homecare monitoring places even more
                    Many of such sensors have been proposed for monitoring of                      stringent constraints on the system cost, size, nonintrusiveness,
                BR, HR, and body movement in the past.2–9 Grillet et al.2                          and ease of use.11 Unfortunately, none of the optical fiber sensor

                *Address correspondence to: Zhihao Chen, E-mail: zchen@i2r.a-star.edu.sg           0091-3286/2014/$25.00 © 2014 SPIE

                Journal of Biomedical Optics                                              057001-1                                             May 2014   •   Vol. 19(5)

Downloaded From: https://www.spiedigitallibrary.org/journals/Journal-of-Biomedical-Optics on 30 Nov 2021
Terms of Use: https://www.spiedigitallibrary.org/terms-of-use
Chen et al.: Simultaneous measurement of breathing rate and heart rate. . .

                types proposed to date has met these requirements for simulta-
                neous BR and HR measurements. No publication has reported
                the use of microbend fiber optic sensor for simultaneous BR and
                HR measurements. We have put great effort these years to
                reinvent microbend fiber sensors for vital signs monitoring in
                order to meet the above stringent requirements for home and
                clinical applications.
                    In this article, we describe a highly sensitive microbend mul-
                timode fiber optic sensor for simultaneous measurement of BR,
                HR, breathing waveforms, and BCG waveforms. This sensor is
                nonintrusive and is suitable for long-term continuous monitor-
                ing of cardiopulmonary parameters with no constraint on the
                user’s activity, and without the need for any prior patient prepa-
                ration or skin contact.
                                                                                                              Fig. 3 Microscopic view of a typical microbender.
                2     Microbend Multimode Fiber Sensor
                2.1     Sensor Design and System Configuration                                     100 μm and numerical aperture (NA) of 0.272 as the sensing
                                                                                                   fiber. The mat was constructed to a dimension of 25 × 20 cm
                The working principle behind this sensor is based on the theory
                                                                                                   for characterization. The thickness of the sensor mat is
                of microbending optical fibers, which has been proven both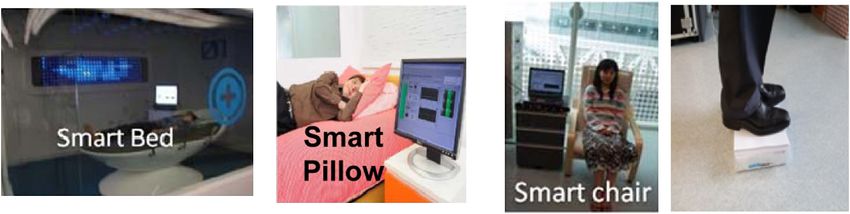
Chen et al.: Simultaneous measurement of breathing rate and heart rate. . .

                guided modes and radiation modes can be achieved with the                                                  Start
                spatial frequency Λ given by Eqs. (3) and (4) for graded-
                index and step-index multimode fibers, respectively. How-                                             Read in raw                       Data quality
                                                                                                                       data from                         check and
                ever, graded-index fibers are better than step-index fibers                                           Transceiver                      Peak detection
                because graded-index fibers have resonance condition, where
                the microbending loss is sharply peaked while step-index fibers                                                                                               End
                do not have the resonance condition.12 So, we choose graded-
                index multimode fibers for our sensor mat in this article.                                   3 stage
                                                                                                                                     4 stage
                                                                                                                                                        Calculations
                                                                                                           averaging
                    The graded-index multimode fiber we used is glass optical                         filtering for curve
                                                                                                                                   Butterworth
                                                                                                                                    filtering
                fibers. One potential problem with using glass optical fibers                              smoothing
                is that there is a risk to the users or patients when glass optical
                                                                                                                                                       Display results
                fibers break. The pieces of the glass optical fiber may puncture
                skin causing bodily injury. This is not acceptable in the appli-                           Normalizaiton

                cation. Patient’s safety is the first priority. Another problem was
                that glass optical fibers can be easily broken. In biomedical
                applications, plastic optical fibers are preferred because plastic
                                                                                                       Breathing                         Heart beat
                optical fibers are biocompatible. More importantly they are                           component                          component
                more rugged and enable greater safety than glass optical fibers.                       extraction                         extraction
                In this article, however, we use glass graded-index multimode
                                                                                                   Fig. 4 Workflow in processing a measured signal using the algorithm.
                fiber for proof of concept demonstration only. In product manu-
                facturing, the use of plastic optical fibers is preferred.
                    The sensor design is based on microbending effect created                      waveform can be recovered. This is followed by normalization
                through a “sandwich” microbender structure as shown in                             to the reference level of zero to remove direct current (DC) drift
                Fig. 2. Under mechanical perturbation ΔF such as periodic                          and fluctuation caused by external noises. After which, the peak
                body movements induced by breathing and cardiac biomechani-                        locations will be detected by the “peak-detector” module. Upon
                cal forces, the microbenders squeeze the multimode fiber and                       detecting the peak locations, the respiratory period can be found
                induce a series of microbends along the fiber axis. Micro-                         for calculation of the BR.
                bending causes light coupling from core-guided modes into
                                                                                                   2.2.2       Heart beat component extraction
                radiation modes, resulting in irreversible light loss and modula-
                tion in the light intensity detected by the photodetector inside the               Although the heart-beating signal is very weak as compared to
                transceiver. By extracting the modulated light intensity, the BR,                  the breathing signal, the heart-beat signal can still be easily
                breathing waveforms, HR, BCG waveforms of the patient, and                         extracted because the frequency bands of breathing and heart
                other body movement information within a specific time can be                      beat signals are well separated. For example, breathing frequen-
                processed and measured using the digital signal processing                         cies for adults are located between 0.05 and 0.6 Hz at rest,
                (DSP) algorithm we have developed. The electrical output of                        whereas heart beat frequencies are occur between 0.8 and
                the transceiver was wirelessly connected to a computer via                         2.0 Hz. Based on these features, a filter method was used to
                Bluetooth sampled at a rate of 50 Hz. There was no crosstalk                       remove breathing signal and suppress other noises. We found
                between this frequency and the grid frequency in the lab and                       that the Butterworth filter is a suitable filter. Butterworth filters
                hospital environment in Singapore. It is easy to change the sam-                   were applied to the raw data to obtain BCG waveforms within
                pling rate to other sampling rate whenever needed.                                 the frequency range from 0.8 to 25 Hz. After which, the heart
                                                                                                   beat locations were detected by the “peak-detector” module.
                2.2     Key DSP Algorithms                                                         After locating the heart beat pulses, the heart beating period
                                                                                                   can be obtained.
                Figure 4 shows the general workflow in processing a measured
                signal using the algorithm. Smoothing and filtering are applied                    2.2.3       Noise suppression
                after receiving raw data from the transceiver followed by data
                quality check and peak detection in the time domain for calcu-                     In the data quality check, level threshold algorithms are applied.
                lation of the BR and HR. The final BR, breathing waveforms,                        When there is a large change of amplitude from large body
                HR, BCG waveforms were then displayed on the graphical user                        movement noise, such as change of body position (threshold
                interface (GUI). LabVIEW (National Instruments Corporation,                        value of 1500 in our case) as compared with the amplitude
                Austin, Texas) programming language was used to design this                        from 600-effective point averaging, peak detections for both
                application software.                                                              BCG and respiratory waveforms will ceased until the move-
                    Below are more detailed descriptions on the algorithms used                    ment-caused large fluctuation has stopped. At the same time,
                for extraction of breathing component and heart-beating compo-                     the movement count will be registered. When the amplitude
                nent from measured signals and for noise suppression.                              of the filtered BCG waveform is more than 200 (peak-to-
                                                                                                   peak), which may result from actions such as talking, etc, detec-
                2.2.1    Breathing component extraction                                            tion will stop temporary as a typical amplitude of a filtered BCG
                                                                                                   waveform is 80 (peak-to-peak). Movement count will not be
                Due to the relatively high-sampling rate for heart beat signal                     registered in this case. This level threshold for the BCG wave-
                acquisition, large amount of averaging is needed for smoothing                     form is used to suppress small spurious body movement noises.
                for robust analysis and calculation of the BR. These comprise of                       According to the frequency feature of heart beating, it is
                three stages of curve-smoothing by using averaging filters to                      obvious that irregular breathing patterns have little effect on
                remove unwanted high-frequency spikes so that the breathing                        the heart-beat rate measurement because the frequency band

                Journal of Biomedical Optics                                              057001-3                                                        May 2014       •   Vol. 19(5)

Downloaded From: https://www.spiedigitallibrary.org/journals/Journal-of-Biomedical-Optics on 30 Nov 2021
Terms of Use: https://www.spiedigitallibrary.org/terms-of-use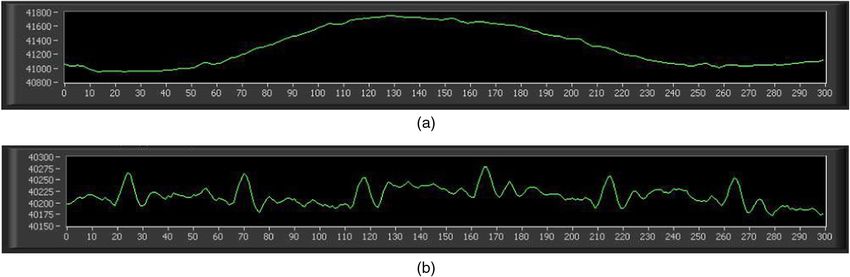
Chen et al.: Simultaneous measurement of breathing rate and heart rate. . .

                of either regular breathing patterns or irregular breathing pat-
                                                                                                                                       0.05
                terns, do not coincide with the frequency band of heart beat
                signals. Hence, interference from breathing signal noise is neg-
                ligible. It should be noted that breathing action has an effect on                                                     0.04

                                                                                                           Sensor sensitivity (V/kg)
                HR variability measurement via the phenomenon of respiratory
                sinus arrhythmia (RSA).16 We do observe the shortening of the                                                          0.03
                J-J interval component of the BCG waveform during inspiration
                and prolonged J-J interval during expiration. This means that
                our current algorithm is able to pick up beat to beat information                                                      0.02

                of heart beat signal.
                                                                                                                                       0.01

                2.3                     Sensor Characteristics
                                                                                                                                       0.00
                The proposed design of the microbend sensor is shown in Fig. 2.
                A graded-index multimode fiber with a core diameter of 100 μm
                                                                                                                                              -5   0   5   10    15    20     25   30        35   40
                and NA of 0.272 was used as the sensing fiber for construction
                                                                                                                                                                Weight (kg)
                of this sensor. The mat was constructed to a dimension of
                25 × 20 cm. Figure 5 shows a typical plot of sensor output P                              Fig. 6 Sensor sensitivity as a function of weight of the sensor mat.
                as a function of weight F, where the optical signals have
                been converted into electrical signals. The force is applied uni-
                formly over the area of 0.05 m2 within the sensor mat. This is a                          3.7 kg. The second region is the approximately linear region
                typical microbend sensor response characteristics similar to the                          from 3.7 to 15 kg wherein the sensor sensitivity decreases.
                results shown in Ref. 17. The key difference in the sensor                                The third region is from 15 to 17 kg and then becomes zero
                response with the load is that the output of our microbend                                after 17 kg. This zero sensitivity results mainly from no signals
                fiber sensor decreases slower than the sensors in Ref. 17.                                detected by the detector due to large optical loss induced. The
                Our experimental data fits a Gauss curve perfectly, in which                              force sensitivity of current design is good enough for detection
                                                                                                        of very weak signals, e.g., changes in cardiac force due to heart
                          B               ðF − F0 Þ2                                                      beating. No excessive bending is needed for low values of load.
                P ¼ P0 þ pffiffiffiffiffiffiffiffi exp −2             ;                                        (5)
                        w π∕2                w2
                                                                                                          2.4                            Sensor Optimization for Various Applications
                where P0 ¼ 0.00251, B ¼ 8.34117, w ¼ 12.681, F0 ¼
                −2.58835. From Eq. (5), the sensor sensitivity S can be calcu-                            To avoid zero force sensitivity and to extend the working range
                lated as                                                                                  of the sensor mat so as to cater for various body weights for
                                                                                                          various applications as shown in Fig. 7, sensor designs can

                    dP 4BðF − F0 Þ        ðF − F0 Þ2                                                    be optimized to handle different ranges of applied force. Key

                S ¼  ¼ pffiffiffiffiffiffiffiffi 3 exp −2              :                                     (6)        design parameters are core diameter and NA of the multimode
                     dF     π∕2w               w2
                                                                                                          fiber as well as spatial frequency of mechanical perturbation
                                                                                                          along the fiber axis. The sensor performance shown in
                    Figure 6 shows the sensor sensitivity curve as a function of                          Figs. 5 and 6 is good for bed application in the lying position.
                weight based on the fitting data according to Eq. (6). For this                           The sensor mat is placed under the upper thoracic region (head-
                specific sensor design, there are three distinct regions of sensi-                        shoulder area) of the monitored subject. In this case, only part of
                tivity. The first region is the nonlinear region from 0 to 3.7 kg                         the body weight is applied to the sensor mat. It should be noted
                and the sensor sensitivity hits peak of 0.05 V∕kg at about                                that if the sensor mat is placed under a mattress with a 7-inch
                                                                                                          thickness, e.g., heart beat signal cannot be detected using current
                                                                                                          sensor mat whereas breathing signal is still detectable. This
                                      0.5                                                                 means that a very thick mattress placed in between our sensor
                                                                                                          mat and the subject can considerably obstruct the propagation of
                                      0.4                                                                 body vibrations by heart beating to the sensor mat, as our sensor
                                                                      experimental data                   requires body contact for measurement of biomechanical
                  Sensor Output (V)

                                                                      Gauss fit                           signals.
                                      0.3                                                                     As for seating and standing application, significant body
                                                                                                          weight is applied to sensor mat. As can be seen from Figs. 5
                                      0.2                                                                 and 6, the relationship between sensor output and applied
                                                                                                          force is not linear. The dynamic working range is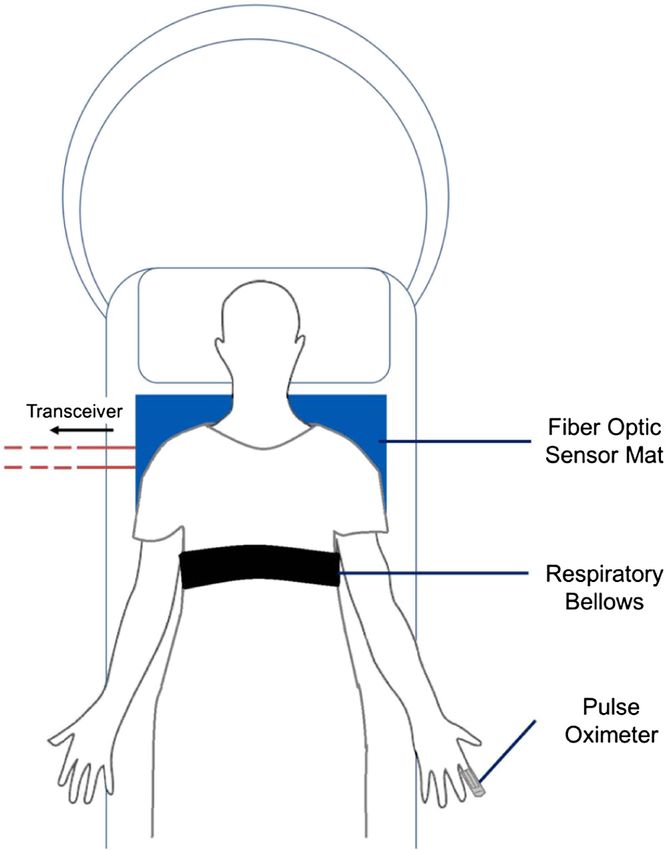
Chen et al.: Simultaneous measurement of breathing rate and heart rate. . .
Fig. 7 Various applications of sensor mats: bed, pillow, chair, and standing application.
beyond 15 kg without the spacer despite using the same fiber. the process of developing a new DSP algorithm for BR meas-
Another simple way to extend the working range of the sensor urement for the standing application.
mat so as to cater for large applied force is to use 50- or 62.5-μm
multimode fiber instead of 100-μm multimode fiber for given
microbenders. We have demonstrated that a sensor mat made 3 Measurement Results and Discussions
of 62.5-μm multimode fiber is good for the seating application. The prototype system of our sensor mat and transceiver is shown
A sensor mat with an area of 0.05 m2 was built for standing in Fig. 10. According to the system setup shown in Fig. 1, the
application (see the first photo from right in Fig. 7). In this appli- typical amplitude induced by breathing is about 800 (after digi-
cation, the whole body weight is applied to the sensor mat. This talization), and the cardiac force-induced amplitude is about 70
sensor mat uses 62.5-μm multimode fiber. Figure 9 shows BCG as shown in Fig. 11. This showed the capability of our sensor in
waveform (acquired over a period of 6 s) in the standing appli- detecting breathing-induced body movement and even weak
cation. Only the HR can be measured for this standing applica- vibrations or changes in cardiac force.
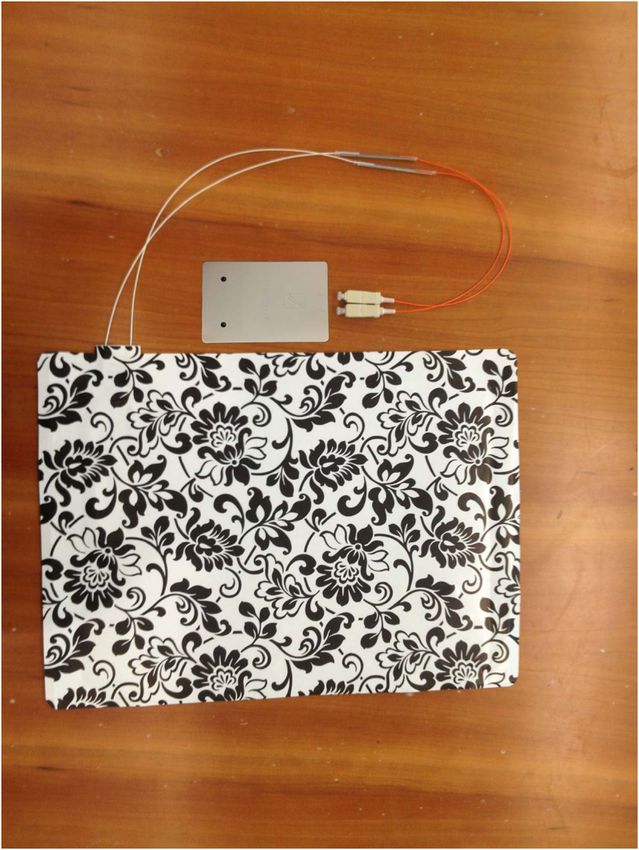
tion using our current DSP algorithm. The impact to the sensor Figure 12 illustrates the GUI of the application software. It
mat from breathing-induced body vibration is so weak that BR displays the HR, BCG waveform, BR, breathing waveform,
cannot be measured using our current algorithm. However, BR number of large body movement, and number of apnea events.
may be derived based on breathing-induced modulation on the The display is user-friendly and contains an alarm system to
BCG according to the phenomenon of RSA. We are currently in alert the medical staff of adverse events.
Figure 13 shows the typical BCG waveform of a healthy sub-
ject according to Ref. 11, in which the main components of a
BCG waveform consist of H, I, J, K, L, and N waves. Figure 14
is a BCG signal obtained from a healthy subject in our study.
0
The features of this waveform closely resemble the BCG wave-
form shown in Fig. 13 although two different techniques were
-2 used. These BCG features may potentially be used for diagnosis
Optical loss(dB)
of heart disease.
It is interesting to know how much force is exerted on the
-4
sensor mat due to breathing and heart beating actions. To do
so, we used a sensor mat with an area of 0.05 m2 built for stand-
-6 ing application above for the measurement of heart beating-
induced force. The following method is used for estimation
-8
of the heart beating-induced force.
-10
0 20 40 60 80 100 120
3.1 Calibration Phase
Weight(kg) In this phase, body weight, W b , is not applied to the sensor mat.
Data is acquired in the preset period of 20 s. The mean of the
Fig. 8 Sensor output as a function of weight.
curve, W c , is calculated.
Fig. 9 A 6-s acquisition of ballistocardiogram (BCG) waveform from a healthy subject in the standing
position.
Journal of Biomedical Optics 057001-5 May 2014 • Vol. 19(5)
Downloaded From: https://www.spiedigitallibrary.org/journals/Journal-of-Biomedical-Optics on 30 Nov 2021
Terms of Use: https://www.spiedigitallibrary.org/terms-of-useChen et al.: Simultaneous measurement of breathing rate and heart rate. . .
are 0.18 and 0.3 kg, respectively. A similar measurement
method is applied for breathing-induced force measurement.
As the acquisition of breathing signal is indirect in the standing
position, we chose the seating position for the measurement.
The breathing-induced force applied to the sensor mat is
about 1 to 2 kg depending on shallow and deep breathings.
The local maxima in breathing and BCG waveforms showed
in Fig. 12 are used for BR and HR calculation. The BR and HR
are defined as
60
BR ¼ ; (7)
T n − T n−1
60
HR ¼ ; (8)
tn − tn−1
where T n is the time at n’th local maxima and T n−1 is the time at
ðn − 1Þ’th local maxima in the breathing waveform, tn is the
time at n’th local maxima and tn−1 is the time at ðn − 1Þ’th
local maxima in the BCG waveform. BR and HR are expressed
in beats per minute (bpm). This article is not aimed for beat to
beat measurement although our sensor has the capability to do it
as shown in Fig. 12. In our present study, we focus only on
simultaneous measurement of BR and HR within a specific
period of time.
Table 1 shows the simultaneous measurement of the BR and
HR from a 32-year-old healthy male subject (body weight:
Fig. 10 Prototype system of the microbend fiber optic sensor mat and 65 kg) using our microbend sensor. The sensor mat was placed
transceiver.
on top of a mattress and under a very thick bed sheet. The sub-
ject was asked to lie still (see the second photo from the left in
3.2 Measurement Phase Fig. 7). Measurements were recorded within 1 min (measure-
ment every 6 s) and compared with a commercial physiologic
In this phase, body weight is applied to the sensor mat. Data is monitoring device (BioHarness™, Zephyr Technology
acquired in the preset period of 20 s. The mean of the curve, W m , Corporation, Maryland) and a SpO2 device (OxyWatch™
is calculated. At the same time, arithmetic mean of the IJ and JK Finger Pulse Oximeter). The maximum error detected was
amplitude, W ijk , is calculated. only 2 beats per minute (bpm) for both BR and HR
measurements.
In the second experiment, the second subject is a healthy
3.3 Estimation of Heart Beating Induced Force
male of age, 28-year-old and weight 70 kg. Figure 15 shows
In this phase, the heart beating-induced force, F ¼ BR and HR plots of the subject acquired using our sensor
W b ∕ðW c − W m Þ W ijk . We have estimated the heart beating- mat and a commercial device, Zephyr sensor. Zephyr sensor
induced force of two subjects using this method. The heart beat- is a wearable sensor, which can be worn on the chest for
ing-induced force of a 51-year-old man and a 32-year–old man BR and HR measurements. Key experimental results are
Fig. 11 (a) Sensor output after digitalization: Breathing induced body movement. (b) Sensor output after
digitalization: Cardiac force induced body movement.
Journal of Biomedical Optics 057001-6 May 2014 • Vol. 19(5)
Downloaded From: https://www.spiedigitallibrary.org/journals/Journal-of-Biomedical-Optics on 30 Nov 2021
Terms of Use: https://www.spiedigitallibrary.org/terms-of-useChen et al.: Simultaneous measurement of breathing rate and heart rate. . .
Fig. 12 User display of the application software.
summarized in Table 2. The recording time is 3495 s. Our sensor short time or less number of local maxima for BR calculation.
recorded 10 samples each second, while the Zephyr sensor However, in HR measurement, both our sensor and Zephyr sen-
recorded one sample for each second. The mean values of sor have similar waveform shapes. We have used four local
BR measured from both sensors are comparable. The absolute maxima for HR calculation using our fiber optic sensor. It is
error of the BR mean values isChen et al.: Simultaneous measurement of breathing rate and heart rate. . .
Table 1 Experimental results comparing the breathing rate (BR) and Table 2 Summary of the experimental results for the second
heart rate (HR) measurements obtained from a healthy male subject experiment.
within 1 min using our microbend sensor with commercial physiologic
monitoring devices.
Sensor type Error
Microbend sensor Zephyr sensor OxyWatch SpO2 Zephyr Our sensor Absolute Relative
sensor mat error error
BR HR BR HR BR Pulse
(bpm) (bpm) (bpm) (bpm) (bpm) (bpm) Recording time 3495 3495
(s)
6 79 7 81 NA 80 Breathing rate
6 80 7 78 NA 78 Mean BR (bpm) 16.14 14.57 1.57 9.7%
8 81 8 79 NA 79 SD (bpm) 0.95 1.38
10 83 10 82 NA 84 No. of samples 3495 34951
10 79 11 79 NA 79 Heart rate
14 80 14 80 NA 79 Mean HR (bpm) 74.98 74.49 0.49 0.7%
12 77 14 76 NA 76 SD (bpm) 3.06 3.07
10 79 11 79 NA 78 No. of samples 3495 34951
12 82 11 83 NA 82
etc. can also distort the BCG waveform. Although we have
14 78 12 78 NA 79 applied the algorithm for motion noise removal, we can still
see the spikes in our results as shown in Fig. 15. Fortunately,
30
these spike amplitudes are very high and their duration is
28 short. These spikes did not affect our final results and simulta-
26 neous measurement of BR and HR.
Sensor mat
24 We did the same experiment on another day. The results for
22 Zephyr the third experiment are shown in Table 3. Similar results
20
were found.
18
BR(bpm)
16
We have also performed a preliminary clinical trial in the 3.0
14 Tesla (T) MRI environment to compare the performance of our
12 microbend fiber optic sensor with conventional MR-compatible
10 monitoring system (Respiratory bellows and Pulse Oximeter,
8 Physiological Measurement Unit, Siemens Medical Solutions,
6
4
2
0
Table 3 Summary of the experimental results for the third
-500 0 500 1000 1500 2000 2500 3000 3500 4000 experiment.
Time(s)
100 Sesnor mat Sensor type Error
Zephyr Zephyr Our sensor Absolute Relative
90
sensor mat error error
80 Recording time 3435 3435
(s)
HR(bpm)
Breathing rate
70
Mean BR (bpm) 16.68 15.03 1.65 9.9%
60
SD (bpm) 1.03 1.35
50 No. of samples 3435 34350
40
Heart rate
-500 0 500 1000 1500 2000 2500 3000 3500 4000
Mean HR (bpm) 72.58 72.24 0.34 0.5%
Time(s)
SD (bpm) 3.2 2.9
Fig. 15 Breathing rate (BR) and heart rate (HR) curves obtained from
a healthy subject at rest in this study using our microbend fiber optic No. of samples 3435 34350
sensor system and Zephyr sensor.
Journal of Biomedical Optics 057001-8 May 2014 • Vol. 19(5)
Downloaded From: https://www.spiedigitallibrary.org/journals/Journal-of-Biomedical-Optics on 30 Nov 2021
Terms of Use: https://www.spiedigitallibrary.org/terms-of-useChen et al.: Simultaneous measurement of breathing rate and heart rate. . .
Fig. 17 BR detected and recorded for all 11 healthy subjects by each
respiratory monitoring device during MRI showed maximum error of
1.7 bpm (standard deviation is 0.5 bpm).
90
Heart Rate per minute (bpm)
80
70
60
Finger Pulse
50
Oximeter
40
Micro-bend
30
Sensor
20
10
0
1 2 3 4 5 6 7 8 9 10 11
Subject #
Fig. 18 HR detected and recorded for all 11 healthy subjects by each
HR monitoring device during MRI showed maximum error of
Fig. 16 Experimental setup of the microbend fiber optic sensor mat in 1.2 bpm (standard deviation is 0.4 bpm).
the magnetic resonance imaging (MRI) room. The sensor mat was
placed under the thoracic region of all trial subjects for simultaneous
monitoring of the BR and HR during liver MRI scan. Measurements
obtained at every 5-min intervals were compared with conventional
respiratory bellows (for the BR) and finger pulse oximeter (for the
pulse rate).
Erlangen, Germany) (Fig. 16). The experiment was conducted
during the MRI liver scans of 11 nonanesthetized healthy sub-
jects of ages 26 to 62-years old (6 males and 5 females). The
body weights of these subjects were in the range 46.6 to 80.0 kg
(mean 60.3 kg). In this clinical trial, we were not allowed to
interface with any MRI machine and devices. So, we had to Fig. 19 (a) and (b) the axial and coronal images obtained during MRI
manually record our experimental results. Our results demon- liver scan of a healthy subject under physiologic monitoring using our
strated good agreement in simultaneous BR and HR measure- microbend optical fiber sensor. No image distortion or radiofrequency
ments between our microbend sensor and the conventional artifacts were seen in all images obtained from the trial subjects,
physiologic monitoring system (Table 4, Figs. 17 and 18). despite the presence of the sensor mat inside the MRI gantry, sug-
gesting the MR-compatibility of the sensor.
Figure 19 shows the axial and coronal images obtained during
Table 4 A good agreement between our microbend sensor and conventional MR-compatible devices in the mean measurements of the BR and
HR recorded for every 5-min interval during a 30-min MRI scan session on 11 clinical trial subjects.
BR monitoring
Device Respiratory bellows Microbend sensor Pearson correlation
BR (bpm) 12.53 2.94 12.31 2.97 r ¼ 0.963; p ¼ 0.000 < 0.001
HR monitoring
Device Finger pulse oximeter Microbend sensor Pearson correlation
HR (bpm) 66.27 7.17 66.55 6.86 r ¼ 0.997; p ¼ 0.000 < 0.001
Journal of Biomedical Optics 057001-9 May 2014 • Vol. 19(5)
Downloaded From: https://www.spiedigitallibrary.org/journals/Journal-of-Biomedical-Optics on 30 Nov 2021
Terms of Use: https://www.spiedigitallibrary.org/terms-of-useChen et al.: Simultaneous measurement of breathing rate and heart rate. . .
MRI liver scan of a healthy subject under physiologic monitor- 2. A. Grillet et al., “Optical fibre sensors embedded into medical textiles
ing using our sensor. An examination and evaluation of all MR for healthcare monitoring,” IEEE Sensors J. 8(7), 1215–1222
(2008).
images obtained during physiologic monitoring using our
3. M. Nishyama, M. Miyamoto, and K. Watanabe, “Respiration and body
microbend sensor and hospital equipment were conducted by movement analysis during sleep in bed using hetero-core fiber optic
using the same method presented in Ref. 19. They were quan- pressure sensors without constraint to human activity,” J. Biomed.
titatively evaluated for the liver signal-to-noise ratio and liver-to- Opt. 16(1), 017002 (2011).
spleen contrast-to-noise ratio. In addition, MR image quality 4. L. Dziuda et al., “Monitoring respiration and caridac activity usingfiber
was qualitatively analyzed based on the five-point image scoring Bragg grating-based sensor,” IEEE Trans. Biomed. Eng. 59(7), 1934–
scale. Results showed no obvious image distortion and RF arti- 1942 (2012).
5. L. Dziuda et al., “Fiber Bragg grating based sensor for monitoring res-
facts in the clinical report. This study suggested the feasibility in piration and heart activity during magnetic resonance imaging exami-
using our sensor mat for physiologic monitoring during MRI. nations,” J. Biomed. Opt. 18(5), 057006 (2013).
Our sensor was able to detect a comparable BR and HR to 6. W. B. Spillman et al., “A smart bed for non-intrusive monitoring of
the predicate devices and produce liver MRI images of good patient physiological factors,” Meas. Sci. Technol. 15, 1614–1620
and comparable image quality to the prospective acquisition cor- (2004).
rection technique navigator-acquired scans in 3.0-T MRI 7. T. Allsop et al., “Application of long period grating sensors to respira-
tory function monitoring,” Proc. SPIE 5588, 148–156 (2004).
environment. 8. J. Wo et al., “Noninvasive respiration movement sensor based on dis-
As demonstrated in this article, our device works very well tributed Bragg reflector fiber laser with beat frequency interrogation,”
for normal subjects. As for abnormal breathing and heart beating J. Biomed. Opt. 19(1), 017003 (2014).
cases, we believe our device can still apply. The key is that our 9. S. Sprager and D. Zazula, “Detection of heartbeat and respiration from
sensor can recover correct breathing waveform and BCG wave- optical interferometric signal by using wavelet transform,” Comput.
form. We clearly observed the phenomenon of RSA, where Methods Prog. Biomed. 111, 41–51 (2013).
10. L. G. Lindberg, H. Ugnell, and P. A. Oberg, “Monitoring of respiratory
BCG J-J interval was shortened during inspiration and pro-
and heart rates using a fibre-optic sensor,” Med. Biol. Eng. Comput. 30,
longed during expiration. Peak detection in the algorithm is in- 533–537 (1992).
dependent of regular or irregular beat–beat intervals. This shows 11. T. Inan et al., “Robust ballistocardiogram acquisition for home moni-
our device can be potentially used for abnormal breathing and toring,” Physiol. Meas. 30, 169–185 (2009).
heart beating subjects. 12. J. W. Berthold, “Historical review of microbend fibre-optic sensors,”
J. Lightwave Technol. 13, 1193 (1995).
13. S. T. Lee et al., “A microbend fibre optic pH sensor,” Opt. Commun.
4 Conclusions 205, 253–256 (2002).
We have presented a highly sensitive microbend fiber sensor for 14. M. Linec and D. Donlagic, “A plastic optical fiber microbend sensor
used as low cost anti-squeeze detector,” IEEE Sensors J. 7, 1262–
simultaneous measurements of BR and HR. Comparative testing
1267 (2007).
between our microbend fiber optic sensor and commercial 15. N. Lagakos, J. H. Cole, and J. A. Bucaro, “Microbend fiber-optic sen-
physiologic sensors showed comparable and good agreement sor,” Appl. Opt. 26, 2171–2180 (1987).
in simultaneous measurements of BR and HR, with an accuracy 16. M. Moser et al., “Phase- and frequency coordination of cardiac and res-
of 2 bpm. The measured BCG waveforms closely resemble piratory function,” Biol. Rhythm Res. 26(1), 100–111 (1995).
BCG waveforms described in the existing literature. 17. D. Donlagic and B. Culshaw, “Microbend sensor structure for use in
Furthermore, our preliminary trial on 11 healthy human subjects distributed and quasi-distributed sensor systems based on selective
launching and filtering of the modes in graded index multimode
during MRI also showed very good agreement in BR and HR
fiber,” J. Lightwave Technol. 17(10), 1856–1868 (1999).
measurements obtained between our microbend fiber optic sen- 18. Z. Chen et al., “Portable fiber optic ballistocardiogram sensor for home
sor and conventional MR-compatible monitors. Although the use,” Proc. SPIE 8218, 82180X (2012).
subject size for the testing in this article is small, our sensor 19. D. Lau et al., “Intensity-modulated microbend fiber optic sensor for res-
demonstrated the feasibility for simultaneous measurements piratory monitoring and gating during MRI,” IEEE Trans. Biomed. Eng.
of BR and HR in a nonbody skin contact way. The proposed 60(9), 2655–2662 (2013).
sensor system is MR-safe and has the potential to replace con- Zhihao Chen is a senior scientist with the Neural and Biomedical
ventional MR-compatible physiologic devices for cardiopulmo- Technology Department at A*STAR Institute for Infocomm Research,
nary condition monitoring and possible physiologic motion- Singapore. He is the principal investigator and project manager of
gating function during MRI. The sensor design is simple and various research projects and industrial projects on sensors for vari-
requires low-fabrication cost, which may facilitate industrial ous applications. His research interests include optical fiber sensors,
optical and electrical sensors for biomedical applications and indus-
acceptance and commercialization for use in various hospital trial applications. He and his team reinvented the microbend fiber sen-
settings and even at home. sor for vital signs monitoring for hospital and home use.
Doreen Lau was a research assistant at Department of Diagnostic
Acknowledgments Radiology, Singapore General Hospital. She received her BSc in
This work was funded by the Agency for Science, Technology life sciences from the National University of Singapore and
Specialist Diploma in Biomedical Engineering from Singapore
and Research (A*STAR) Biomedical Engineering Program and Polytechnic in 2009 and 2014, respectively. She has a diverse
A*STAR-MINDEF Joint Program. The authors would like to research background in medicine, biology and medical engineering.
thank all reviewers’ comments. She specializes in bioimaging and molecular genetics research on
animal models, and has experience in medical imaging and fiber
optic sensors research on humans.
References
Ju Teng Teo received the BEng (EEE) degree, in 2008, and the MSc
1. B. A. Holshouser, D. B. Hinshaw, and F. G. Shellock, “Sedation, anes- (Elec) degree, in 2010, from Nanyang Technological University,
thesia and physiologic monitoring during MR imaging: evaluation of Singapore. He is presently with Institute for Infocomm Research,
procedures and equipment,” J. Magn. Reson. Imaging 3, 553–558 as a research engineer. His main research interest includes develop-
(1993). ing optical fiber sensors and algorithms for vital signs monitoring. He
Journal of Biomedical Optics 057001-10 May 2014 • Vol. 19(5)
Downloaded From: https://www.spiedigitallibrary.org/journals/Journal-of-Biomedical-Optics on 30 Nov 2021
Terms of Use: https://www.spiedigitallibrary.org/terms-of-useChen et al.: Simultaneous measurement of breathing rate and heart rate. . .
has developed various sensors and customized software for field tri- University China in 1994 and 1998, respectively. Her research inter-
als in hospitals. ests are fiber optic based devices and sensors. She has been working
on fiber sensor based vital signs monitoring and fiber laser and inter-
Soon Huat Ng is a research engineer in the Neural & Biomedical ferometry based vibration monitoring.
Technology Department at the Institute for Infocomm Research. He
received his BEng degree in electrical and electronic engineering Pin Lin Kei is a radiologist and clinical principal investigator at
from Nanyang Technological University in 2007. His main research Department of Diagnostic Radiology, Singapore General Hospital.
interests include the development and application of novel methods He received his medical degree from the University of Glasgow,
for patient vital signs monitoring. UK, in 2001, Master of Medicine (diagnostic radiology) in 2006
from Singapore, and FRCR (UK) in 2006. He specializes in advanced
Xiufeng Yang is a research scientist at the Institute for Infocomm medical imaging techniques such as CT and MRI, and has special
Research, Singapore. She received her ME degree and PhD degree interest in biomedical optics research.
in communication and optics from Tianjin University and Nankai
Journal of Biomedical Optics 057001-11 May 2014 • Vol. 19(5)
Downloaded From: https://www.spiedigitallibrary.org/journals/Journal-of-Biomedical-Optics on 30 Nov 2021
Terms of Use: https://www.spiedigitallibrary.org/terms-of-useYou can also read