Early detection of red palm weevil using distributed optical sensor - Nature
←
→
Page content transcription
If your browser does not render page correctly, please read the page content below
www.nature.com/scientificreports

            OPEN           Early detection of red palm weevil
                           using distributed optical sensor
                           Islam Ashry 1,4, Yuan Mao1,4, Yousef Al-Fehaid2, Abdulmoneim Al-Shawaf2,
                           Mansour Al-Bagshi2, Salman Al-Brahim3, Tien Khee Ng 1 & Boon S. Ooi 1*
                           Red palm weevil (RPW) poses a serious threat to the cultivation of date palms. It is considered to be the
                           most destructive epidemic pest of palms, responsible for massive economic losses worldwide. Curative
                           methods for RPW are not difficult to apply; however, the early detection of the pest remains a great
                           challenge. Although several detection techniques have been implemented for the early detection of
                           RPW, none of these methods have been proven to be reliable. Here, we use an optical-fiber-distributed
                           acoustic sensor (DAS) as a paradigm shift technology for the early detection of RPW. Our sensitive
                           sensor shows a detection of feeding sound produced by larvae as young as 12 days, in an infested tree.
                           In comparison with existing, commonly-used technologies, this novel sensing technique represents a
                           cost-effective and non-invasive alternative that could provide 24-7, real-time monitoring of 1,000 palm
                           trees or even more. It could also monitor the temperature, an essential feature to control farm fires,
                           another major problem for the cultivation of palm trees around the world.

                           Red palm weevil (RPW) (Rhynchophorus ferrugineus) is a Coleopteran snout pest originating from tropical Asia1.
                           In the past few decades, it has spread out to many regions worldwide, including North Africa, the Middle East,
                           Mediterranean region, and parts of the Caribbean and Central America. This plague has wiped out many palm
                           farms in various countries, and constitutes a severe agricultural problem2–4. In Gulf countries and the Middle
                           East, $8 millions are spent, every year, only to remove infested palm trees5. By 2023, in Italy, Spain and France, it
                           is expected that RPW control and loss of benefits will amount to around $225 million5.
                               There are effective techniques to heal RPW-infested palm trees6; however, detecting the RPW threat at an early
                           stage (first two-to-three weeks of the weevil larvae stage) is pivotal, yet challenging4. When a palm tree shows visi-
                           ble signs of distress, it generally means that the infestation is well-advanced; at this point, it is too late to rescue the
                           tree. There are several methods to detect this infestation4,7–12. For instance, trained dogs are used to smell the odor
                           released from infested palms during the fermentation process8. Unfortunately, sensing such kind of odor is not an
                           accurate, nor a selective process, because its efficiency is impacted by the presence of other volatiles. Alternatively,
                           infested trees can be screened with a computer-based tomography system7. However, this technique lacks the
                           practicality for fast and cost-effective scanning. The first detectable signals of an infested tree originate from the
                           noise produced by the weevil larvae while consuming the core of a trunk. Therefore, the most promising early
                           detection methods rely on using acoustic sensors4,9–12. Existing technologies mainly insert a sound probe into the
                           tree trunk such that the probe records larvae sound in real-time. Unfortunately, this type of acoustic sensors is
                           intrusive to the plant growth, and might create a nest for other insects, including RPW. Additionally, offering an
                           acoustic sensor for each tree, along with a wireless communication interface, significantly increases the cost of the
                           entire RPW surveillance system in order to provide constant monitoring.
                               Here, we report on the use of an optical-fiber-distributed acoustic sensor (DAS) and a signal processing algo-
                           rithm as a robust solution for the early detection of RPW. In our design, all of the optical/electronic components
                           including the laser and photodetector are gathered within a single unit, whereas only the fiber is wound around
                           the palm trees to form an optical network. In our study, this new system is used to distinguish two palm trees,
                           one healthy and one infested with ~12 days old larvae. A validation experiment is carried out in Al-Hassa city,
                           Eastern Province, KSA, where RPW infestation is severe13. Compared to other existing acoustic sensors, our sen-
                           sor is uniquely non-invasive, providing 24-7 monitoring, at relatively low cost, and offering wide coverage of the
                           farming area, using only a single optical fiber cable.

                           1
                            Computer, Electrical and Mathematical Sciences and Engineering (CEMSE) division, King Abdullah University of
                           Science and Technology (KAUST), Thuwal, 23955-6900, Kingdom of Saudi Arabia. 2Center of Date Palms and Dates,
                           Ministry of Environment, Water and Agriculture, Al-Hassa, Kingdom of Saudi Arabia. 3Office of the Ministry of
                           Environment, Water and Agriculture, Al-Hassa, Kingdom of Saudi Arabia. 4These authors contributed equally: Islam
                           Ashry and Yuan Mao. *email: boon.ooi@kaust.edu.sa

Scientific Reports |   (2020) 10:3155 | https://doi.org/10.1038/s41598-020-60171-7                                                                   1
www.nature.com/scientificreports/ www.nature.com/scientificreports
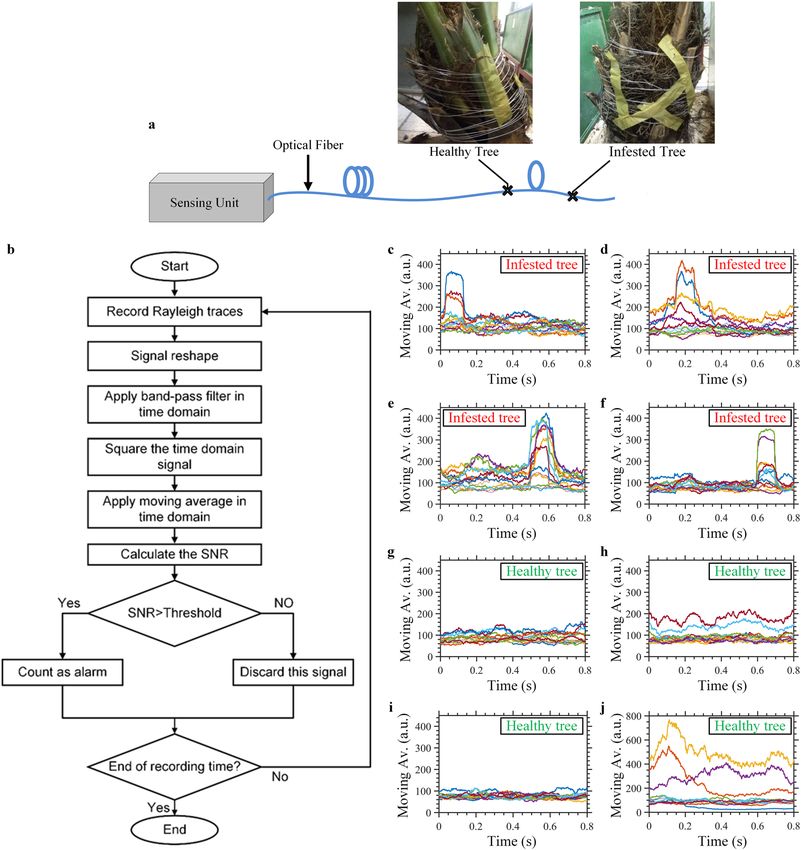
Figure 1. Optical fiber DAS for early detection of RPW. (a) Overall operation plan of new setup using an optical
fiber DAS for the early detection of RPW. (b) Experimental setup of the optical fiber DAS: Cir., circulator.
Results
Setup of the new operation with our optical fiber DAS is represented in Fig. 1(a). The entire optical/electronic
components used to design the sensor are located within a sensing unit. This sensing unit is connected to an
optical fiber that is extended throughout the palm-trees farm. The optical fiber is looped around each tree trunk,
from the ground up to a ~1 m height, where the probability of finding weevil larvae is high14. Between trees, the
optical fiber cable can be either laid down on the ground or buried in soil, based on environmental conditions. A
real-time signal processing of the data provided by the sensing unit enables us to precisely and accurately identify
the locations of the infested and healthy trees.
Optical fiber DAS is essentially designed using phase-sensitive optical time-domain reflectometry
(Φ-OTDR)15,16 which has been utilized for many potential applications in the oil and gas industries17 and for
real-time structural health monitoring18. Its operation principle consists in launching a train of optical pulses gen-
erated by a narrow linewidth laser into a single-mode fiber (SMF). At the fiber input port, consecutive Rayleigh
backscattered traces are recorded in the time-domain. Each Rayleigh trace has a speckle-like profile because of
the coherent interference of the signals reflected by scattering centers for the duration of the injected pulse19. In
the absence of intrusion along the optical fiber, i.e., no perturbation of the refractive index, the recorded Rayleigh
traces are ideally identical. When an acoustic signal is applied at a position along the fiber, such as the weevil
larvae sound, the effective refractive index at this position changes, and the intrusion can be sensed by observing
the intensity fluctuations of its corresponding speckle in the recorded traces. The experimental setup included
within the sensing unit, shown in Fig. 1a, is illustrated schematically in Fig. 1b. A laser source generated a con-
tinuous wave (CW) light of 100 Hz linewidth, a 16dBm-optical power, and a 1535nm-operation wavelength. The
laser light was modulated by an acousto-optic modulator (AOM) driven by a pulse generator to produce optical
pulses of 20 kHz repetition rate and 100 ns pulse-width offering 10 m- sensing spatial resolution. Next, the power
of the modulated light was amplified, using an erbium-doped-fiber-amplifier (EDFA), and then injected through
a circulator into a SMF of ~1km-length. The backscattered Rayleigh signal from the SMF was recorded, using a
direct detection scheme. The Rayleigh signal was initially amplified with another EDFA which amplified sponta-
neous emission (ASE) noise was discarded by a fiber Bragg grating (FBG). The filtered Rayleigh signal was then
recorded via a photodetector (PD), sampled at 125MS/s rate using an oscilloscope, and processed to extract the
sensing information.
In our experiments, we initially focused on measuring the signature of the sound spectrum of weevil larvae
less than two weeks old. We selected this specific RPW life stage to test if our new sensor can detect the larvae
sound at an early stage, so that the palm tree can be cured and saved. To control the age of the weevil larvae, a palm
tree was artificially infested with male and female adult RPWs, and the transition from the egg- to the larvae-stage
was closely monitored. In particular, we carried out our experiment using an artificially infested sample tree that
included 4 pieces of ~12 days old larvae (Fig. 2a). Recognizing the sound spectrum’s signature of the larvae will
facilitate discarding noises when using the optical fiber DAS to locate infested trees. To measure the sound spec-
trum signature, we used a commercially available voice recording microphone that we inserted into the trunk
of the artificially infested palm tree that was in close proximity to the larvae. Two representative examples of the
time-domain larvae sound recorded via the microphone are shown in Fig. 2b,c and their corresponding power
Scientific Reports | (2020) 10:3155 | https://doi.org/10.1038/s41598-020-60171-7 2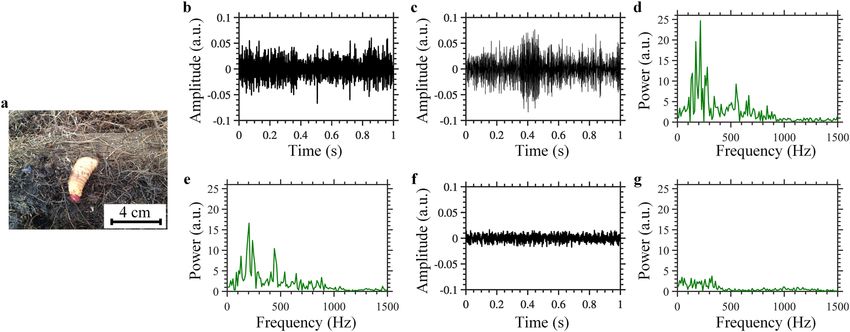
www.nature.com/scientificreports/                                                                www.nature.com/scientificreports

                           Figure 2. Measurements of the sound spectrum signature of the weevil larvae. (a) ~12 days old weevil larvae
                           (b,c) Representative examples of time-domain signals and (d,e) corresponding power spectra of the sound
                           emitted by the larvae, recorded via microphone. (f) Time-domain signal and (g) corresponding power spectrum
                           of the background noise recorded via microphone.

                           spectra are represented in Fig. 2d,e. As shown in Fig. 2d,e, the sound from the larvae exhibits frequencies that
                           are mostly below ~800 Hz, and may also include some environmental noise signals. Fig. 2f,g respectively show an
                           example of time-domain signal and power spectrum of the background noise recorded via microphone, without
                           the presence of larvae. It is worth mentioning that both the larvae sound and background noise were recorded
                           exactly under the same setting parameters for the microphone; therefore, their signal strengths in the time and
                           frequency domains shown in Fig. 2b–g are comparable. In contrast to the sound emitted by the larvae, the noise
                           signal is weaker with almost flat fluctuations in the time-domain, and its power is roughly equally distributed
                           among low frequencies (below ~400 Hz). The power spectra results of the larvae’s sound and the background
                           noise are in good agreement with the emulation experiments performed in some of our previous work20.
                               Before starting to use our DAS to record the sound of weevil larvae, we calibrated it to make sure it can accu-
                           rately find a location, precisely, along the fiber subjected to acoustic signals, and that it can also determine the fre-
                           quencies of the signals for each location. For calibration purposes, at ~110 m-distance from the SMF input facet,
                           we wound a 10 m-fiber section around a piezoelectric transducer (PZT) cylinder, such that the PZT cylinder acted
                           as a vibration source. PZT cylinders are generally used for the calibration of optical fiber DAS because their vibra-
                           tional amplitude and frequency can be predetermined using a driven-function generator15. As described in ref. 19,
                           the location of the vibration, along the optical fiber, can be determined by subtracting the time-domain Rayleigh
                           traces generated when injecting pulses into the optical fiber. Once the location has been found and identified, a
                           Fourier transform is applied on the Rayleigh traces, at this precise location, in order to determine the compo-
                           nents of the signal’s frequency. Fig. 3a,b respectively show the location’s information and the power spectrum of a
                           400 Hz PZT vibration event. The results obtained in this study confirm the ability of our optical fiber DAS to pre-
                           cisely determine the location of the PZT vibration, together with its frequencies. High-order harmonics appear at
                           800 Hz because of the nonlinearity of the direct detection scheme (Fig. 3b). It is worth mentioning that the aim of
                           the PZT experiment is just to calibrate our system and to prove the developed DAS can locate vibration position
                           and frequency, before proceeding to the RPW detection experiment.
                               We repeated the recording of the larvae’s sound and the background noise, using the optical fiber DAS, instead
                           of the voice-recording microphone. Near the end of the SMF, we wound a 10 m-fiber section around the same
                           infested tree as that used for the former voice-recording microphone experiment. Based on the results obtained
                           with the microphone, we applied a band-pass filter of [200–800 Hz] range to the time-domain signals collected
                           by the optical fiber DAS in order to discard most of the low-frequency environmental noise, such as that from
                           tree swinging20 and environmental thermal fluctuations21, as well as the high-frequency electronic noise of our
                           system. While we were collecting the majority of the sound signal of the larvae. Two representative examples
                           of the time-domain signals recorded using our DAS, after applying the band-pass filter, are shown in Fig. 3c,d;
                           their corresponding power spectra are presented in Fig. 3e,f, respectively. For comparison purposes, using the
                           same filtering band, and under similar experimental conditions, we recorded the time-domain signal and power
                           spectrum of the background noise, using the optical fiber DAS (see example in Fig. 3g,h). Results show that the
                           signal of the larvae signal is stronger than that of the background noise, in both time and frequency domains,
                           meaning that our sensor has the ability to discover the presence of weevil larvae; however, to assess its reliability, it
                           was necessary to perform additional statistical studies (demonstrated later in Figs. 4 and 5). Additionally, a more
                           advanced signal processing technique may be needed to avoid the instantaneous noises that produce false alarms
                           through interference with the real signals from the larvae. It is also important to clarify that the infested and
                           healthy trees used in our experiments were all placed in a closed room with windows, not in an open-air farm.
                           Consequently, these trees might be subjected to sound noises produced by birds flying around the room, and/or
                           humans within the room, along with that from air flow, even if that flow was very weak. Distinguishing healthy

Scientific Reports |   (2020) 10:3155 | https://doi.org/10.1038/s41598-020-60171-7                                                                3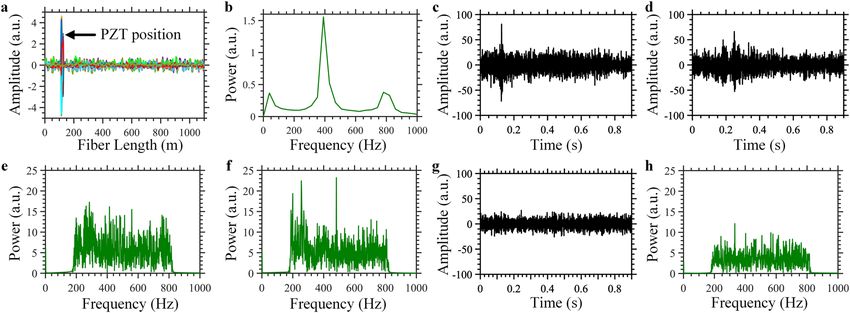
www.nature.com/scientificreports/                                                               www.nature.com/scientificreports

                           Figure 3. Recording weevil larvae sound with optical fiber DAS. (a) Position information and (b) power
                           spectrum of the 400 Hz vibration event produced by a PZT cylinder. (c,d) Representative examples of time-
                           domain signals and (e,f) their corresponding power spectra of the larvae sound recorded using the optical fiber
                           DAS. (g) Time-domain signal and (h) its corresponding power spectrum of the background noise recorded via
                           the optical fiber DAS.

                           from infested trees in open-air farms where the optical fiber might be subjected to harsh environmental noises
                           produced by wind, rain, etc., is part of our plans for future work on this topic.
                                In this study, we also developed an algorithm to assess whether a palm tree is infested or healthy. We set
                           our experimental configuration, as shown in Fig. 4a, where the sensing unit was connected to the same SMF
                           of ~1.1 km length. Near the end of the fiber, we wound a 10 m-fiber section around a healthy tree and another
                           identical fiber section around the previously used infested tree with ~12 days old larvae. The two trees were
                           well-separated in space, so that the fiber’s length between them was ~40 m. This distance was more than enough
                           for our sensor to recognize which tree emitted the recorded individual signals. Again, the two trees were placed
                           in a closed room, not in an open-air farm (Fig. 4a). The detection algorithm is presented in the flowchart from
                           Fig. 4b. We started with a continuous reading of the Rayleigh traces, for a 1-second period, which was limited by
                           the memory size of the oscilloscope and computer specifications. We then reshaped this continuous recording
                           Rayleigh traces into individual ones, such that each trace was the outcome of sending one pulse through the
                           optical fiber. We then applied the band-pass filter of [200 Hz, 800 Hz] range on the time-domain signal of the
                           individual points, along the optical fiber. Because of the noise introduced by the digital filter, we omitted the first
                           and last 50 ms of the recorded data corrupted by the filter. Next, for each point along the optical fiber, we squared
                           its time-domain signal and applied a moving average (with a 100 ms window) on the squared signal. There were
                           four different scenarios that might impact on the results of the moving average: the first scenario was when our
                           system recorded background noise without any instantaneous time-domain noisy spikes. In this case, the result of
                           the moving average was almost of constant amplitude. The second case was when the background noise included
                           some instantaneous noisy spikes. Since these spikes typically occurred within short time periods (i.e., ≪100 ms),
                           the moving average results would still be of relatively constant amplitude. The third scenario occurred when the
                           signal was captured while larvae were present and active. Based on data analysis, the optical fiber DAS typically
                           did not record a continuous sound of larvae within a one-second time frame. This might be due to the fact that
                           the eating behavior of the larvae was not continuous, and that the larvae instead ate in a discrete, on/off manner.
                           Another possible reason might be that strength of the sound signal produced by the larvae was not constant
                           therefore, when the sound signal was strong the optical fiber could record it; otherwise, the sound was weak to
                           disturb the fiber refractive index. In this third scenario, the moving average result consisted of ups and downs.
                           Finally, the last scenario, which rarely occurred, was when our sensor recorded a larvae’s sound signal continu-
                           ously, during the one-second period, with almost the same strength, i.e., larvae did not stop eating and their signal
                           reached the optical fiber with almost constant strength. In this case, the moving average result was of almost
                           constantly a high value and behaved similarly as that obtained when recording the background noise, without ups
                           and downs. After calculating the moving average (Fig. 4b), we determined a signal-to-noise ratio (SNR), defined
                           as the ratio between the high-level and the low-level of the moving average. If the SNR was higher than a certain
                           predetermined decision threshold, we counted this as a true alarm of larvae infestation; otherwise, we ignored it.
                           Following the flowchart, when the experiment time ended, the algorithm stopped, and we could count the num-
                           ber of true alarms of infestation recorded during the experiment; otherwise, we repeated the process, starting by
                           measuring 1-second periods of Rayleigh traces. The main drawback of this algorithm is when the fourth scenario
                           occurred, i.e., our system continuously recorded a sound of the larvae that has a similar strength; in this case, the
                           system could not generate a true alarm of infestation. However, even with such a drawback, the accuracy of our
                           sensor is still acceptable, as will be seen later in Fig. 5b.
                                Figure 4c–f show four representative examples of the change in moving average, over time, for data collected
                           from the infested tree. In our experiment, we used a 125 MHz oscilloscope sampling rate, which means that we
                           sampled data every 0.8 m, along the optical fiber. Each graph in Fig. 4c–f includes 14 curves, one for each spatial

Scientific Reports |   (2020) 10:3155 | https://doi.org/10.1038/s41598-020-60171-7                                                              4
www.nature.com/scientificreports/ www.nature.com/scientificreports
Figure 4. Distinguishing infested and healthy tree using optical fiber DAS. (a) Experimental configuration
used to distinguish the infested from the healthy tree. (b) Flowchart of the algorithm used to detect the sound of
weevil larvae. Representative examples of the moving average change, over time, for the sound signals collected
from the infested tree (c–f) and the healthy tree (g–j).
Figure 5. Distinguishing infested from healthy trees using optical fiber DAS. (a) Histogram of SNR values
recorded for an infested and healthy tree. (b) Infestation alarm counts generated by our new sensor for an
infested and healthy tree.
Scientific Reports | (2020) 10:3155 | https://doi.org/10.1038/s41598-020-60171-7 5www.nature.com/scientificreports/ www.nature.com/scientificreports
point, which adequately covers the 10 m-section fiber wound around the tree. The SNR was calculated for all
individual 14 curves and their maximum value was used for comparison with the decision threshold. Clearly, as
shown in Fig. 4c–f, the moving average of the infested tree data includes ups and downs, as we expect. In contrast,
Fig. 4g–j show the change of the moving average with time for the signals gathered using the healthy tree. The
moving average results, in this case, indicate the presence of smooth fluctuations, in comparison with the infested
tree. In some rare cases (Fig. 4j), the moving average of the healthy tree might include some ups and downs, and
the corresponding SNR value exceeds the decision threshold to produce a false alarm of infestation.
For statistical analysis purposes, we kept running this experiment continuously, for two hours, while we cal-
culated the SNR for both the infested and healthy trees. Figure 5a shows a histogram of the SNR values for the
infested (red bar) and healthy (green bar) tree, when choosing 1 dB as a bin. Based on the results of this histo-
gram, we selected 4 dB as the SNR decision threshold to determine whether the tree is infested or healthy. Using
this decision-threshold value, our sensor provides 97 infestation alarm counts for the infested tree, versus 9 only
for the healthy tree (Fig. 5b). These results confirm the ability of our developed sensor to distinguish the infested
from the healthy tree, with a relatively high accuracy.
Discussion
In this study, we developed an acoustic-sensing hardware and algorithm for monitoring and distinguishing
infested from healthy trees, using an optical fiber DAS of 10 m spatial resolution and ~1.1 km fiber length. As
reported in the literature, the sensing range of an optical fiber DAS can be easily extended to ~10 km, while keep-
ing a 1 m spatial resolution22. Assuming the total separation between two consecutive trees and the fiber length
wound around each tree is ~10 m, one sensing unit would theoretically be able to continuously monitor ~1000
palm trees. The current total cost of the sensing unit and 10 km fiber is ~US$37,000; ~US$37 monitoring cost per
tree. In order to reduce the monitoring cost per tree, time-division-multiplexing (TDM)23 can be implemented
based on our sensor. This could be performed via connecting multiple optical fibers to the sensing unit, through
an optical switch. Alternatively, optical fibers could be permanently installed in palm farms while a sensing unit
is shared among the farms at different time slots, which would significantly reduce the monitoring cost per tree.
The signal processing algorithm we adopted to identify infested trees is powerful and can be generalized for
any event count analysis, using an optical fiber DAS. Typically, the SNR of optical fiber DAS is defined as the
ratio between the peak-to-peak signal variations to that of the background noise, within a set time-domain19.
Following this common definition, any noisy spike occurring at a tree location would provide a false infestation
alarm. In contrast, our SNR definition significantly mitigates the trigger of false alarms. The moving average
window, 100 ms in our analysis, can be tuned to even span the entire recording time period. However, as shown in
Fig. 5a, the decision threshold should be carefully selected, based on the moving average window.
The significant advantage of our reported sensor over those found in literature is that the optical fiber DAS
system offers distributed early detection of RPW. Within few minutes, an entire palm farm would be scanned
using the reported sensor. Compared with the other RPW detection methods that rely on visual inspection24,
x-ray7, acoustic probes4, dogs8, etc., our reported technique saves a lot of time and effort. However, in contrast
to the invasive acoustic probes, the reported system would find challenges to distinguish the larvae’s sound from
environmental noises, when using it in natural field environment. Fortunately, many successful techniques have
been reported to recognize the RPW’s sound in noisy environments, when using acoustic detection methods. For
instance, J. Pinhas et al. developed a mathematical method to automatically recognize acoustic activity of RPW
in offshoots with a 98% average detection ratio25. Similarly, when using off-the-shelf recording devices, spectral
signature of the RPW’s sound was utilized to detect RPW26. Additionally, R. W. Mankin et al. used spectral and
spatial filtering, acoustic spectrum features, and acoustic temporal pattern features to identify the RPW’s sound
from background noise12,27–29.
The developed sensor can concurrently be used to monitor the temperature to control farm fires, another
major problem around the world. Distributed optical fiber temperature sensor can be designed using Brillouin
optical time-domain reflectometry (BOTDR)30.
In summary, we reported a robust early detection method for RPW, using an optical fiber DAS. This new sen-
sor aimed to detect the presence of ~12 days old weevil larvae in a palm tree. To do so, the sound spectrum signa-
ture of the weevil larvae was identified by recording the sound of the larvae, using a commercial voice-recording
microphone. Using the sound spectrum signature obtained from measurements, a signal-processing algorithm
was subsequently developed in order to analyze the data recorded by the sensor, and to distinguish infested from
healthy trees. We found that, after a two-hour recording, our system provided 97 true infestation alarms for the
infested tree, versus 9 false alarms for the healthy one. Once installed, the new sensing system could potentially
offer a 24-7 monitoring for thousands of trees, over extended time periods. As a future work, we are planning to
use the reported sensing system to distinguish healthy from infested trees in open-air farms.
Methods
Artificial infestation of a palm tree with red palm weevil. To artificially infest a palm tree with RPW,
we firstly removed the fibers attached to the tree trunk. The trunk was then cut into two halves, along its length.
Within one of the half-segment, we dug a hole to house the male and female adult RPWs. Next, the half-segments
were rejoined to reconstruct the trunk which was kept at 27 ± 3 °C temperature and 65 ± 10% relative humidity.
To avoid the adult RPWs from escaping the tree trunk, we firmly wound a steel wire around the trunk and along
its length. The reconstructed trunk was opened after roughly a week to check that the female RPWs produced
eggs. After which, the whole adult RPWs were removed from the tree, and we waited until the weevil larvae
reached the desired age before running our sensing experiment.
Scientific Reports | (2020) 10:3155 | https://doi.org/10.1038/s41598-020-60171-7 6www.nature.com/scientificreports/ www.nature.com/scientificreports
Calculating the signal-to-noise ratio. In our analysis, we defined the SNR as the ratio between the
high-level and the low-level of the moving average. The moving average’s high level was calculated as the mean
of the highest-valued 2000 points in the moving average. Considering the experimentally used 20 kHz repetition
rate of injecting pulses into the optical fiber, the 2000 points were equivalent to the 100 ms window of the moving
average. Similarly, the low-level of the moving average was determined as the mean of the lowest-valued 2000
points in the moving average. In our experiment, we used one infested tree and another healthy one. For statistical
analysis purposes, the SNR values were continuously calculated over two hours for the two trees.
Received: 20 May 2019; Accepted: 7 February 2020;
Published: xx xx xxxx
References
1. Roda, A. et al. Red palm weevil (Rhynchophorus ferrugineus), an invasive pest recently found in the Caribbean that threatens the
region. EPPO Bull. 41, 116–121 (2011).
2. El-Mergawy, R. & Al-Ajlan, A. M. Red palm weevil, rhynchophorus ferrugineus (olivier): Economic importance. biology,
biogeography and integrated pest management. J. Agric. Sci. Technol. A 1, 1–23 (2011).
3. Mukhtar, M. et al. New Initiatives for Management of Red Palm Weevil Threats to Historical Arabian Date Palms. Florida Entomol.
94, 733–736 (2011).
4. Rach, M. M. et al. On the design of a bioacoustic sensor for the early detection of the red palm weevil. Sensors (Switzerland) 13,
1706–1729 (2013).
5. Food and Agricultural Organization of the United Nations. Food chain crisis. Red palm weevil, http://www.fao.org/food-chain-
crisis/how-we-work/plant-protection/red-palm-weevil/en/ (2017).
6. Murphy, S. & Briscoe, B. The red palm weevil as an alien invasive: Biology and the prospects for biological control as a component
of IPM. Biocontrol News Inf. 20, 35–46 (1999).
7. Haff, R. P. & Slaughter, D. C. Real-time x-ray inspection of wheat for infestation by the granary weevil, Sitophilus granarius (L.).
Trans. Am. Soc. Agric. Eng. 47, 531–537 (2004).
8. Suma, P., La Pergola, A., Longo, S. & Soroker, V. The use of sniffing dogs for the detection of Rhynchophorus ferrugineus.
Phytoparasitica 42, 269–274 (2014).
9. Gutiérrez, A., Ruiz, V., Moltó, E., Tapia, G. & del Mar Téllez, M. Development of a bioacoustic sensor for the early detection of Red
Palm Weevil (Rhynchophorus ferrugineus Olivier). Crop Prot. 29, 671–676 (2010).
10. Siriwardena, K. A. P. et al. Portable acoustic device for detection of coconut palms infested by Rynchophorus ferrugineus
(Coleoptera: Curculionidae). Crop Prot. 29, 25–29 (2010).
11. Hussein, W. B., Hussein, M. A. & Becker, T. Detection of the red palm weevil rhynchophorus ferrugineus using its bioacoustics
features. Bioacoustics 19, 177–194 (2010).
12. Mankin, R. W. Recent Developments in the use of Acoustic Sensors and Signal Processing Tools to Target Early Infestations of Red
Palm Weevil in Agricultural Environments 1. Florida Entomol. 94, 761–765 (2011).
13. Massoud, M., Faleiro, J., El-Saad, M. & Sultan, E. Geographic information system used for assessing the activity of the red palm
weevil Rhynchophorus ferrugineus (Olivier) in the date palm Oasis of Al-Hassa, Saudi Arabia. J. Plant Prot. Res. 51, 234–239 (2011).
14. Dembilio, Ó. & Jaques, J. A. Biology and Management of Red Palm Weevil. In Sustainable Pest Management in Date Palm: Current
Status and Emerging Challenges 13–36, https://doi.org/10.1007/978-3-319-24397-9_2 (2015).
15. Bao, X., Zhou, D. P., Baker, C. & Chen, L. Recent Development in the Distributed Fiber Optic Acoustic and Ultrasonic Detection. J.
Light. Technol. 35, 3256–3267 (2017).
16. Shi, Y., Feng, H. & Zeng, Z. Distributed fiber sensing system with wide frequency response and accurate location. Opt. Lasers Eng.
77, 219–224 (2016).
17. Yamate, T., Fujisawa, G. & Ikegami, T. Optical Sensors for the Exploration of Oil and Gas. J. Light. Technol. 35, 3538–3545 (2017).
18. Eisler, B. & Lanan, G. A. Fiber Optic Leak Detection Systems for Subsea Pipelines. in, https://doi.org/10.4043/23070-ms (2012).
19. Lu, Y., Zhu, T., Chen, L. & Bao, X. Distributed vibration sensor based on coherent detection of phase-OTDR. J. Light. Technol. 28,
3243–3249 (2010).
20. Mao, Y., Ashry, I., Ng, T. K. & Ooi, B. S. Towards Early Detection of Red Palm Weevil using Optical Fiber Distributed Acoustic
Sensor. In 2019 Optical Fiber Communications Conference and Exhibition, OFC 2019 - Proceedings, https://doi.org/10.1364/ofc.2019.
w2a.15 (2019).
21. Hicke, K., Eisermann, R. & Chruscicki, S. Enhanced distributed fiber optic vibration sensing and simultaneous temperature gradient
sensing using traditional C-OTDR and structured fiber with scattering dots. Sensors (Switzerland) 19 (2019).
22. Chen, D., Liu, Q. & He, Z. High-fidelity distributed fiber-optic acoustic sensor with fading noise suppressed and sub-meter spatial
resolution. Opt. Express 26, 16138 (2018).
23. Spirit, D. M., Ellis, A. D. & Barnsley, P. E. Optical Time Division Multiplexing: Systems and Networks. IEEE Commun. Mag. 32,
56–62 (1994).
24. Al-Dosary, N. M. N., Al-Dobai, S. & Faleiro, J. R. Review on the management of red palm weevil Rhynchophorus ferrugineus olivier
in date palm Phoenix dactylifera L. Emirates J. Food Agric. 28, 34–44 (2016).
25. Pinhas, J. et al. Automatic acoustic detection of the red palm weevil. Comput. Electron. Agric. 63, 131–139 (2008).
26. Soroker, V. et al. Note: Utilization of Sounding Methodology to Detect Infestation by Rhynchophorus ferrugineus on Palm
Offshoots. Phytoparasitica 32, 6–8 (2004).
27. Mankin, R. W., Smith, M. T., Tropp, J. M., Atkinson, E. B. & Jong, D. Y. Detection of Anoplophora glabripennis (Coleoptera:
Cerambycidae) Larvae in Different Host Trees and Tissues by Automated Analyses of Sound-Impulse Frequency and Temporal
Patterns. J. Econ. Entomol. 101, 838–849 (2008).
28. Mankin, R. W. et al. Eavesdropping on Insects Hidden in Soil and Interior Structures of Plants. J. Econ. Entomol. 93, 1173–1182
(2009).
29. Mankin, R. W., Samson, P. R. & Chandler, K. J. Acoustic Detection of Melolonthine Larvae in Australian Sugarcane. J. Econ. Entomol.
102, 1523–1535 (2009).
30. Horiguchi, T., Shimizu, K., Kurashima, T., Tateda, M. & Koyamada, Y. Development of a Distributed Sensing Technique Using
Brillouin Scattering. J. Light. Technol. 13, 1296–1302 (1995).
Acknowledgements
This work was supported by KAUST-Red Palm Weevil Early Detection - Partnership Funds (REP/1/3814-01-
01 and REP/1/3814-02-01) and KAUST baseline funding (BAS/1/1614-01-01). We also acknowledge English
language editing provided for this work by Elisabeth M. Lutanie, Research Publication Services at KAUST.
Scientific Reports | (2020) 10:3155 | https://doi.org/10.1038/s41598-020-60171-7 7www.nature.com/scientificreports/ www.nature.com/scientificreports
Author contributions
B.S.O. conceived the idea of the paper; I.A. and Y.M. designed and carried out the experiments; Y.A., A.A., M.A.
and S.A. carried out the artificial infestation of the RPW; T.K.N. provided optical/electronic devices. B.S.O., I.A.,
Y.M. and T.K.N. wrote the paper.
Competing interests
The authors declare no competing interests.
Additional information
Correspondence and requests for materials should be addressed to B.S.O.
Reprints and permissions information is available at www.nature.com/reprints.
Publisher’s note Springer Nature remains neutral with regard to jurisdictional claims in published maps and
institutional affiliations.
Open Access This article is licensed under a Creative Commons Attribution 4.0 International
License, which permits use, sharing, adaptation, distribution and reproduction in any medium or
format, as long as you give appropriate credit to the original author(s) and the source, provide a link to the Cre-
ative Commons license, and indicate if changes were made. The images or other third party material in this
article are included in the article’s Creative Commons license, unless indicated otherwise in a credit line to the
material. If material is not included in the article’s Creative Commons license and your intended use is not per-
mitted by statutory regulation or exceeds the permitted use, you will need to obtain permission directly from the
copyright holder. To view a copy of this license, visit http://creativecommons.org/licenses/by/4.0/.
© The Author(s) 2020
Scientific Reports | (2020) 10:3155 | https://doi.org/10.1038/s41598-020-60171-7 8You can also read