The energy absorption behavior of novel composite sandwich structures reinforced with trapezoidal latticed webs
←
→
Page content transcription
If your browser does not render page correctly, please read the page content below
Reviews on Advanced Materials Science 2021; 60: 503–518
Research Article
Juan Han, Lu Zhu, Hai Fang*, Jian Wang, and Peng Wu
The energy absorption behavior of novel
composite sandwich structures reinforced
with trapezoidal latticed webs
https://doi.org/10.1515/rams-2021-0041
received April 01, 2021; accepted May 19, 2021
1 Introduction
Abstract: This article proposed an innovative composite The transportation industry is developing rapidly, and
sandwich structure reinforced with trapezoidal latticed the amount, capacity and velocity of ships are improving
webs with angles of 45°, 60° and 75°. Four specimens constantly; however, the ship–bridge collision events are
were conducted according to quasi-static compression happening frequently [1–3]. Extensive research about
methods to investigate the compressive behavior of the energy buffering and absorption materials and structures
novel composite structures. The experimental results indi- has been conducted to develop anti-collision devices [4–7].
cated that the specimen with 45° trapezoidal latticed Some kinds of anti-collision devices have been successfully
webs showed the most excellent energy absorption ability, developed according to the principle of energy absorption
which was about 2.5 times of the structures with vertical and momentum buffering [8–10]. The commonly used anti-
latticed webs. Compared to the traditional composite collision protection device for bridge piers in China is the
sandwich structure, the elastic displacement and ultimate framed steel fender system, which exhibited the shortcom-
load-bearing capacity of the specimen with 45° trapezoidal ings of bad corrosion resistance and high maintenance cost
latticed webs were increased by 624.1 and 439.8%, respec- [11,12]. Moreover, the framed steel fender system was also
tively. Numerical analysis of the composite sandwich difficult to be used in some lightweight engineering struc-
structures was carried out by using a nonlinear explicit tures for its low specific strength.
finite element (FE) software ANSYS/LS-DYNA. The influ- Composite sandwich structures have received great
ence of the thickness of face sheets, lattice webs and foam attention by virtue of the high specific strength and spe-
density on the elastic ultimate load-bearing capacity, the cific stiffness, excellent corrosion resistance, nice energy
elastic displacement and initial stiffness was analyzed.
absorption behavior and strong designability [13–23]. The
This innovative composite bumper device for bridge pier
traditional lattice-web reinforced composite sandwich
protection against ship collision was simulated to verify its
structures as anti-collision devices had been applied to
performance. The results showed that the peak impact
several bridges (Figure 1). Nevertheless, the initial stiff-
force of the composite anti-collision device with 45° trape-
ness and ultimate strength were relatively low, and the
zoidal latticed webs would be reduced by 17.3%, and the
serious interface stripping phenomenon also appeared in
time duration will be prolonged by about 31.1%.
the test results. Wu et al. [24] proposed a novel foam-
Keywords: composite sandwich structure, trapezoidal filled glass-fiber reinforced polymer (GFRP) tubes and
latticed webs, energy absorption, FE modeling validated the high compressive capacity and efficient
energy-absorbing capacity. Wang et al. [25] invented
the lattice web reinforced composite foam sandwich struc-
ture and found that when the lattice web was subjected to
shear stress and compressive stress, it could restrain strip-
ping of the surface layer and the core material simulta-
* Corresponding author: Hai Fang, College of Civil Engineering, neously. However, further investigations discovered that
Nanjing Tech University, Nanjing 211816, China,
the traditional lattice web reinforced foam sandwich struc-
e-mail: fanghainjut@njtech.edu.cn, tel: +86-25-5813-9869;
fax: +86-25-5813-9877
ture had two dominating defects, i.e., the huge peak
Juan Han, Lu Zhu, Jian Wang, Peng Wu: College of Civil Engineering, crushing force and the sharp tremendous bearing load
Nanjing Tech University, Nanjing 211816, China decline [Figure 10(a)].
Open Access. © 2021 Juan Han et al., published by De Gruyter. This work is licensed under the Creative Commons Attribution 4.0
International License.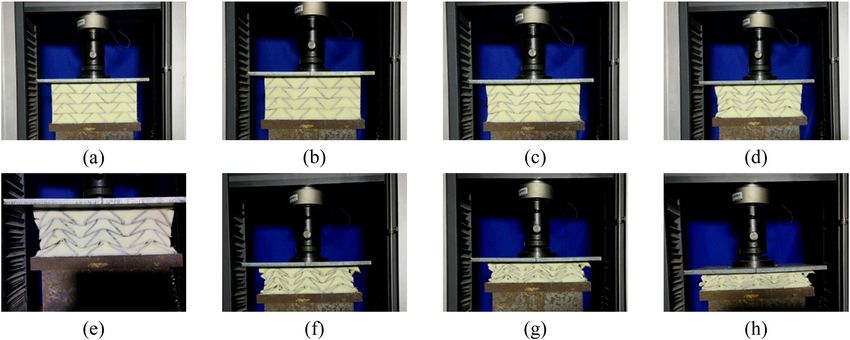
504 Juan Han et al.
Anti-collision device
Anti-collision device Anti-collision device
(a) (b) (c)
Figure 1: Application of the orthogonal lattice web reinforced composite sandwich panels as anti-collision devices: (a) Guang Zhou to Shen
Zhen AloneRiver Expressway Bridge, (b) Xin Meng Ge Bridge, (c) Huang Gang Yangtze River Bridge.
Therefore, this article proposes the foam-filled com- latticed webs. The detailed information of each specimen
posite sandwich structures reinforced by trapezoidal lat- is listed in Table 1.
ticed web through changing the space position of the
latticed web. The failure mode of the composite struc-
tures reinforced by the trapezoidal latticed web can be 2.2 Manufacturing procedures
improved to prevent the sudden decrease of the bearing
load and to extend the elastic stroke of the bearing capa- VARIP was used to manufacture the specimens, and the
city; meanwhile, the energy absorption characteristics fabricating procedures can be divided into five operating
can be enhanced. sequences [21]: (a) cutting foam core, (b) wrapping foam
core, (c) resin infusion, (d) curing the resin and (e)
cutting components according to the dimensions. The
detailed manufacturing procedures could be found in
reference [21].
2 Materials and manufacturing
2.1 Specimen description
2.3 Material properties
Four types of foam-filled composite structures were manu-
factured using the vacuum-assisted resin infusion Tensile tests of GFRP sheets [Figure 3(b)] were conducted
process (VARIP) in Advanced Engineering Composites on five rectangular laminate samples [Figure 3(a)] with a
Research Center of Nanjing Tech University. These struc- size of 250 × 25 × 2.4 mm3 based on ASTM D3039/D3039M-14
tures were composed of GFRP face sheets and foam cells [26]. The medial tensile strength is 208.1 MPa (the standard
wrapped by GFRP trapezoidal lattice webs. The face deviation is ±3.11), and the medial modulus is 19.1 GPa
sheets and webs were made of bi-axial [0/90] glass fiber (the standard deviation is ±0.48), which fluctuates
laminates (800 g·m−2) and unsaturated polyester resin.
The bi-axial [−45/45] glass fiber laminates (800 g·m−2)
were used to wrap the PU foam (40 g·m−3) cells. All struc-
tures were 300 mm in length, 300 mm in width and
150 mm in height. The thicknesses of face sheets (ts)
and webs (tw) were 2.4 mm (ts). The control specimen
TS-V was reinforced with GFRP vertical lattice cells.
The specimen TS-V was used to make an investigation
of normal composite structures’ energy absorption beha-
vior. Specimens TS-T-A45, TS-T-A60 and TS-T-A75, which
were formed with GFRP trapezoidal webs, were used to
investigate the influence of web angle on the energy
absorption behavior of a novel composite sandwich
structure. Figure 2 shows the outline of the novel compo- Figure 2: The novel foam-filled sandwich composite panels rein-
site sandwich structures reinforced by GFRP trapezoidal forced by GFRP trapezoidal latticed web.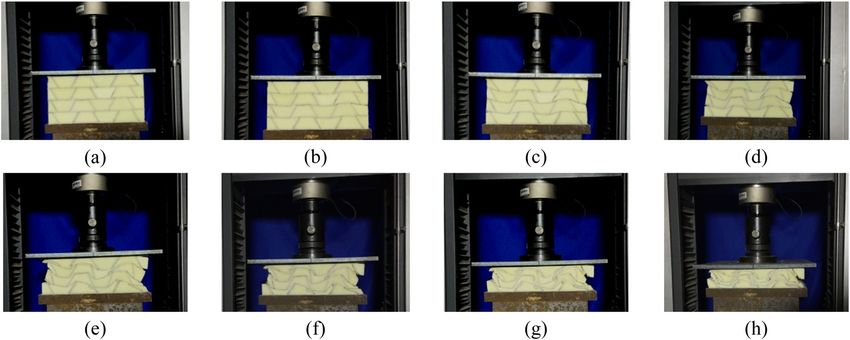
Energy absorption behavior of novel composite structures 505
Table 1: Dimension parameter of specimens
Specimen Illustration L (mm) W (mm) H (mm) ts (mm) tw (mm) Angle (°) m (kg)
TS-V 300 300 150 2.4 2.4 — 2.38
TS-T-A45 300 300 150 2.4 2.4 45 4.95
TS-T-A60 300 300 150 2.4 2.4 60 4.90
TS-T-A75 300 300 150 2.4 2.4 75 5.28
between 18.4 and 19.5 GPa. Simultaneously, the compres- was placed between two rigid plates, and the bottom rigid
sion properties of the five cubic GFRP laminate samples plate was fixed on the base of the test device. A constant
with a size of 10 × 10 × 30 mm3 were evaluated using loading rate of 2 mm·min−1 of the movable top plate was
compression tests [Figure 3(c)] according to ASTM D695- applied to compress the specimens.
10 [27]. The medial compressive strength is 84.7 MPa (the
standard deviation is ±2.48), and the medial compressive
modulus is 5.0 GPa (the standard deviation is ±0.52),
3.2 Failure modes
which fluctuates between 4.5 and 5.6 GPa. Table 2 presents
the corresponding results.
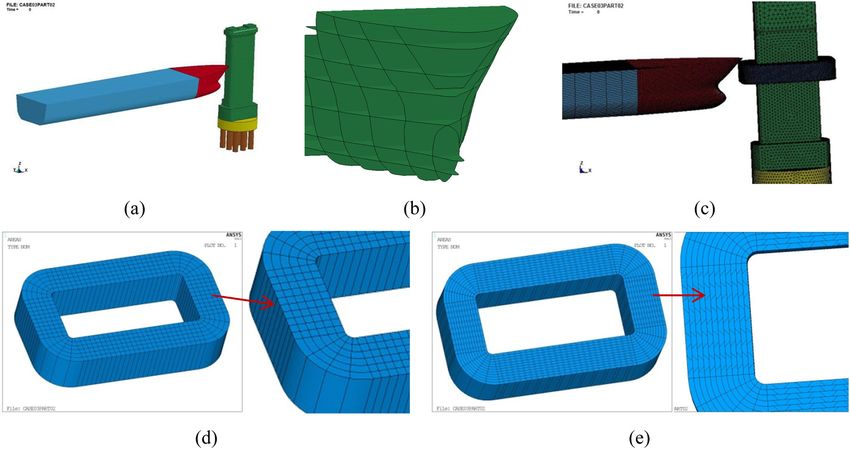
The test loading process of TS-V specimen is shown in
Five PU foam samples with a size of 50 × 50 × 50 mm3
Figure 5, where the specimen is compressed to 70% of
were used to evaluate the mechanical properties in accor-
its original height (105 mm). The bearing capacity of the
dance with ASTM C365/C365M-16 [28]. The displacement
TS-V increases linearly to 116.1 kN at the beginning of
rate of all compression tests were 2 mm·min−1. Figure 3(d)
loading [Figure 10(a)]. When the compression displace-
shows the compression test of PU foam, and the resulting
ment increased from 5.4 to 8.2 mm, the left-side lattice
properties of the PU foam are listed in Table 3.
was bent and stripped of foam with a clear sound. The
right vertical lattice was bent, and the foam was comple-
tely peeled off with the creak of the specimen, which
formed the penetrating crack, and the outer foam was
3 Experimentation torn and bulging out. The bearing capacity of the spe-
cimen rapidly decreased by 43.9 kN. With the increase
3.1 Experimental set-up of compression displacement, the specimen was com-
pacted gradually, and the bearing capacity was stable
Figure 4 shows the experimental setup. The universal after a short decrease. When the compression displace-
testing machine with a static capacity of 200 kN was used ment reaches 49.1 mm, the vertical lattice structure was
to conduct the quasi-static compression tests. Each specimen compressed gradually, and the bearing capacity of the
Figure 3: Material properties test: (a) GFRP sheets: five tension coupons; (b) tension test of GFRP sheets; (c) compression test of GFRP
sheets; and (d) compression test of PU foam.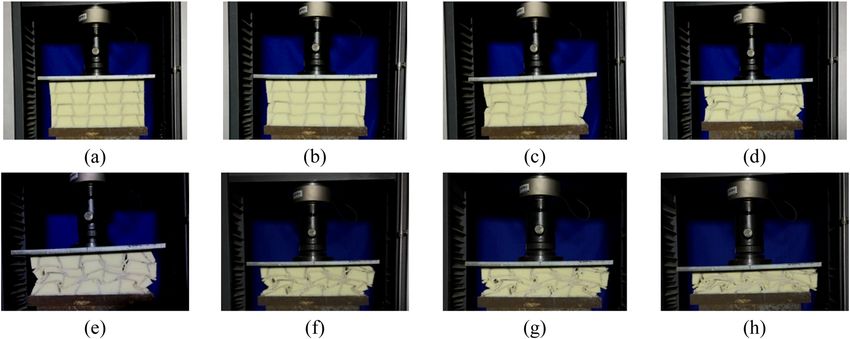
506 Juan Han et al.
Table 2: Material properties of face sheets specimen fluctuated. Finally, the specimen was com-
pacted and the bearing capacity increased steadily.
Components Properties Face sheets The test loading process of TS-T-A45 specimen is
Compression Yield strength (MPa) 84.7 ± 2.48 shown in Figure 6. When the compression displacement
Young’s modulus (GPa) 5.0 ± 0.52 increased to 33.7 mm, the horizontal lattice slowly flexed,
Tension Yield strength (MPa) 208.1 ± 3.11 the angle between the diagonal lattice and the horizontal
Young’s modulus (GPa) 19.1 ± 0.48 lattice gradually decreased, the specimen was extruded
inward on both sides, and the bearing capacity continued
to increase linearly until 63.7 kN. Subsequently, the lower
lattice was gradually separated from the upper lattice,
Table 3: Material properties of foam
and the bearing capacity was slightly fluctuated. With
Components Properties PU foam the increase of the compression displacement, the bending
deformation of the horizontal lattice increased gradually,
Compression Yield strength (MPa) 0.14 ± 0.03
the oblique lattice was pressed to the horizontal lattice, the
Young’s modulus (GPa) 2.27 ± 0.40
foam in the trapezoidal lattice was compacted gradually,
and the bearing capacity of the specimen continuously
improved.
The test loading process of TS-T-A60 specimen is
shown in Figure 7. During the loading process, the trape-
zoidal horizontal lattices continued to bend, and the tra-
pezoidal lattices of the upper and lower layers approached
Loading ceell Top plate each other gradually under compression without obvious
brittle failure. The two sides of the specimen were extruded
inward, and the foam and lattice structures on both sides
were broken off. At the later stage of loading, a small
Specimen amount of oblique latticework was compressed and bent
without obvious brittle fracture. The bearing capacity of
the specimen increased continuously during the whole
B
Bottom plate compression process, and only a small amount of gentle
Support
stage appeared.
The test loading process of TS-T-A75 specimen is
Figure 4: Quasi-static experiment on foam sandwich composite with shown in Figure 8. At the beginning of the loading pro-
spatial reinforced lattice webs.
cess, the bearing capacity of the specimen increased
Figure 5: Quasi-static experiment of TS-T-V: (a) beginning, (b) Δ = 15 mm, (c) Δ = 30 mm, (d) Δ = 45 mm, (e) Δ = 60 mm, (f) Δ = 75 mm,
(g) Δ = 90 mm and (h) Δ = 105 mm. (Note: Δ represents the compression displacement).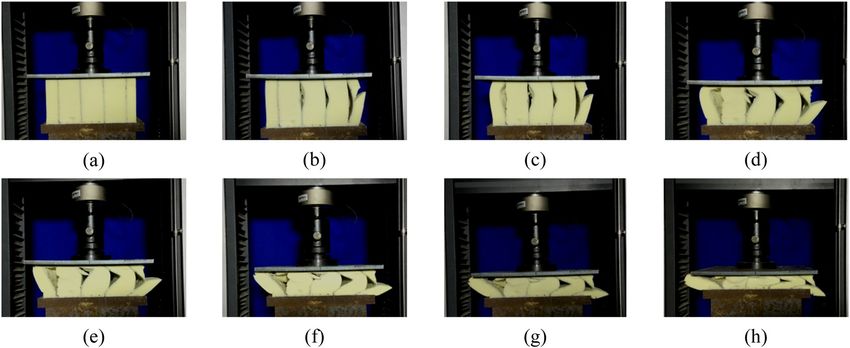
Energy absorption behavior of novel composite structures 507
Figure 6: Quasi-static experiment of TS-T-A45: (a) beginning, (b) Δ = 15 mm, (c) Δ = 30 mm, (d) Δ = 45 mm, (e) Δ = 60 mm, (f) Δ = 75 mm,
(g) Δ = 90 mm, (h) Δ = 105 mm.
linearly to 56.6 kN when the compression displacement is stress of the longitudinal lattice web reaches the critical
increased to 5.7 mm. When the compression displace- buckling stress; (2) the interface tensile stress is greater
ment was up to 15 mm, the horizontal lattice was gradu- than the bond strength of lattice web and foam core; (3)
ally bent and deformed, and the displacement of the virtue of the angle of TS-T-A45 and TS-T-A60 is relatively
upper and lower trapezoidal lattice was shifted. With small, the oblique lattices are relatively long, the defor-
the compression process, the upper right, the lower left mation of different trapezoidal lattices is coordinated
and middle trapezoidal oblique lattice delaminated, and during compression deformation, and the delamination
the bearing capacity fluctuated up and down. In the end, of lattices is not produced, and then the failure of the
the bearing capacity increased continuously during the specimen shows good integrity.
compaction stage.
From all the test results, three main macro-failure
modes can be summarized: (1) local buckling of longitu- 3.3 Load–displacement behavior
dinal lattice [Figure 9(a)], which occurs in TS-V specimens;
(2) the interface delamination of lattice is common in The load–displacement curves of the test specimens are
TS-T-A75 specimens [Figure 9(b)]; and (3) bending defor- illustrated in Figure 10, and the loads and displacements
mation of lattice [Figure 9(c)], which is more common in at the load positions are noted. The elastic ultimate
TS-T-A45, TS-T-A60 specimens. The mechanism analysis of bearing capacity (the PE) of TS-V is 116.1 kN, while the
the aforementioned failure modes are as follows: (1) before elastic displacement is only 5.4 mm, and the initial stiff-
reaching the ultimate compressive strength, the compressive ness (K) is 21.5 kN·mm−1. Then, the bearing load suddenly
Figure 7: Quasi-static experiment of TS-T-A60: (a) beginning, (b) Δ = 15 mm, (c) Δ = 30 mm, (d) Δ = 45 mm, (e) Δ = 60 mm, (f) Δ = 75 mm,
(g) Δ = 90 mm, (h) Δ = 105 mm.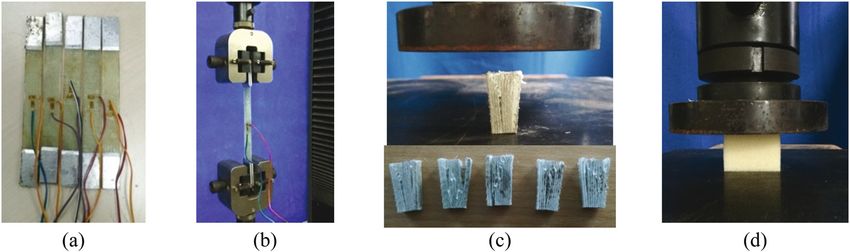
508 Juan Han et al.
Figure 8: Quasi-static experiment of TS-T-A75: (a) beginning, (b) Δ = 15 mm, (c) Δ = 30 mm, (d) Δ = 45 mm, (e) Δ = 60 mm, (f) Δ = 75 mm,
(g) Δ = 90 mm, (h) Δ = 105 mm.
decreased to 92.56 kN on account of local buckling of the the curve of load–displacement and the abscissa axis
longitudinal lattice. The bearing capacity after the com- (displacement), is a main index to assess the energy
pression stroke (the PS) is only 38.36 kN [Figure 10(a)]. absorption performance. Ea is expressed as equation (1)
This huge reduction in bearing capacity in a short time S
is not beneficial to energy absorption and may cause
secondary damage [21]. The elastic ultimate capacity of
Ea = ∫F(s) ds (1)
0
TS-T-A45 specimen is 66.7 kN, but the elastic displace-
ment is 33.7 mm. The load-carrying capacity rose sharply where S is the compression displacement.
after a small fluctuation, and PS increased significantly As the compression stroke increases, the energy
to 168.70 kN after the compression stroke. The curves of absorption values of each stage are listed in Table 5.
TS-T-A60 and TS-T-A75 are similar to that of TS-T-A45, The energy absorption value is primarily affected by the
but the elastic displacement of TS-T-A60 and TS-T-A75 is initial stiffness of the specimen at the early stage of
shortened to 16.4 and 7.5 mm, respectively. Table 4 lists loading. When the compression ratio reaches 0.1, the
the main testing results. energy absorption value of the TS-V specimen is larger
than that of other cross-section specimen for its high
initial stiffness. When the compression ratio increases
gradually, the vertical lattice web of the TS-V specimen
3.4 Total absorbed energy (Ea) has completely buckled, and its bearing capacity fluctu-
ates in a small range. The energy absorbed by the TS-V
Ea is the energy absorbed by the specimen when the specimen increases linearly with the increase of the com-
compression stroke is 70% of the specimen height. The pression ratio, but the energy absorption value is the
energy absorption value, which is the area surrounded by smallest, with a total absorption of 3,060 J.
Local bucking Interface delamination Bending deformation of lattice
(a) (b) (c)
Figure 9: Failure modes of specimens: (a) local bucking, (b) interface delamination, (c) bending deformation of lattice.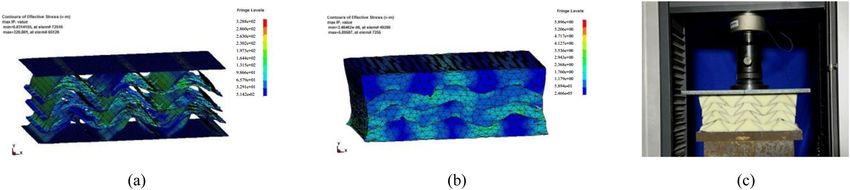
Energy absorption behavior of novel composite structures 509
Table 4: Mean experimental results
Specimen PE (kN) ΔP1 (mm) K (kN·mm−1) PS (kN) Ea (J) 0.7 ES (J·kg−1) Fm (kN) Failure mode
TS-V 116.1 5.4 21.5 38.36 3,060 1285.7 29.1 Local bucking
TS-T-A45 66.7 33.7 2.0 168.70 7,326 1373.1 64.7 Bending deformation of lattice
TS-T-A60 36.9 16.4 2.3 129.39 6,431 1312.5 61.2 Bending deformation of lattice
TS-T-A75 63.3 7.5 8.4 144.65 7,671 1452.8 73.1 Interface delamination
The load–displacement curve of TS-T-A45 and TS-T- 3.6 Mean crushing load (Fm)
A60 shows a stable increasing trend, and the bearing
capacity increases as the compression displacement Fm is the average bearing capacity of the specimen in the
increasing. Therefore, the trend of energy absorption whole process of quasi-static compression, which is one
of the two forms is similar, the energy absorption value of the important parameters to quantify the crushing pro-
increases steadily in the middle period and then increases cess of the specimen. Fm is defined in equation (3).
rapidly during the later stage of loading. The load–dis- Ea
placement curve of TS-T-A75 specimen fluctuated greatly Fm = (3)
S
in the middle period of loading, but its energy absorption
value is the biggest (7,671 J) due to more lattice failure. where S is the total compression displacement of each
The energy absorption of TS-T-A45 (7,326 J), TS-T-A60 specimen, and S is equal to105.
(6,431 J) and TS-T-A75 is 2.4, 2.1 and 2.5 times that of Fm values are presented in Table 4. The average
TS-V, respectively. crushing force of the TS-V specimen is the smallest
with the value of 29.1 kN, while the average crushing
force of TS-T-A75 specimen is the largest and the differ-
ence between them is 48.5 kN. The average crushing
3.5 Specific energy absorption (ES) forces of TS-T-A45 and TS-T-A60 are 64.7 and 61.2 kN,
respectively. Among these four proposed specimens, the
ES is another main index to estimate the energy absorp- average crushing force of three kinds of trapezoidal lat-
tion property of the specimen. Equation (2) expresses ES ticed webs (TS-T-A45, TS-T-A60 and TS-T-A75) is much
as follows: higher than that of vertical latticed webs (TS-V), which
would be helpful for stopping specimens TS-T-A45, TS-T-
Ea
ES = (2) A60 and TS-T-A75 from collapsing at the initial impact
m
process when used as a material of the bumper system
where m is the specimen mass (compared with Table 1). to protect the bridge from ship collision.
ES capacities of the four representative specimens are
presented in Table 4. Among these specimens, TS-V had
the smallest ES capacity of 1285.7 J·kg−1, while TS-T-A75
had the greatest ES capacity of 1452.8 J·kg−1. 4 Finite element modeling
4.1 Modeling details
The composite structures were modeled and simulated by
Table 5: Energy absorption of tested specimens (J)
using the finite element software ANSYS/LS-DYNA. The
geometric model was composed of two rigid plates and
0.1 0.2 0.3 0.4 0.5 0.6 0.7
the composite structure in between. The size of the model
TS-V 710 1,073 1,444 1,927 2,295 2,623 3,060 depends on the design size of the specimen. Bond slip
TS-T-A45 253 962 1,865 2,835 4,046 5,428 7,326 between GFRP surface, latticed web and polyurethane
TS-T-A60 306 923 1,658 2,510 3,552 4,800 6,431
foam is not considered. Hexahedral Mesh was used to
TS-T-A75 725 1,667 2,697 3,628 4,671 5,989 7,671
mesh the polyurethane foam of the vertical lattice model,
Note: Δ represents the compression ratio of the specimen. and tetrahedral mesh (free mesh) was used to mesh the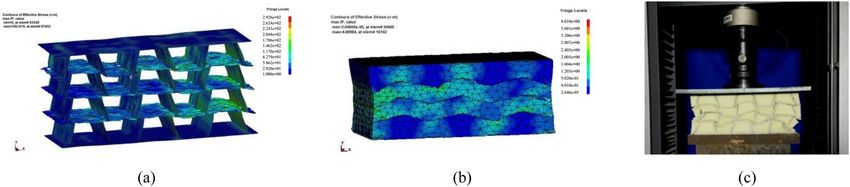
510 Juan Han et al.
140 180
△P1=5.4mm Ps=168.7 kN
120 160
140
100 PE=116.1 kN
120
Load (kN)
Load (kN)
80 Decreased bearing load=92.56kN 100
△P1=33.7mm
60 Ps=38.36 kN 80
60
40
40
20 PE=66.7 kN
20
0 0
0 20 40 60 80 100 120 0 20 40 60 80 100 120
Displacement (mm) Displacement (mm)
(a) (b)
140 160
Ps=129.39 kN 140 Ps=144.65 kN
120
120
100
100
Load (kN)
Load (kN)
80 △P1=7.5mm
80
60 △P1=16.4mm
60
40
40 PE=63.3 kN
20 PE=36.9 kN 20
0 0
0 20 40 60 80 100 120 0 20 40 60 80 100 120
Displacement (mm) Displacement (mm)
(c) (d)
Figure 10: Load–displacement curves of specimens with spatial webs: (a) TS-V, (b) TS-T-A45, (c) TS-T-A60, (d) TS-T-A75.
polyurethane foam of the oblique lattice model, and the is used to simulate the foam, test loading rigid plate and
grid is divided as shown in Figure 11. backing rigid plate.
4.1.1 Element type 4.1.2 Material mode
In this article, SHELL163 element [29] is used to simulate The GFRP face sheets and lattice webs are simulated
the inner and outer surfaces, and vertical and inclined using the composite damage model (material number
webs of GFRP specimens with different cross sections 22). The FE model material parameters are mainly pre-
when the space lattice reinforced foam sandwich compo- sented in Table 6. The composite orthotropic material
site is simulated. The thickness of different GFRPs is with optional brittle failure can be defined according to
defined by setting real constant, and SOLID164 element the advice of Chang and Chang [30,31]. The crushable
Figure 11: Geometric model and mesh mode of TS-T-A45: (a) geometric model and (b) mesh mode.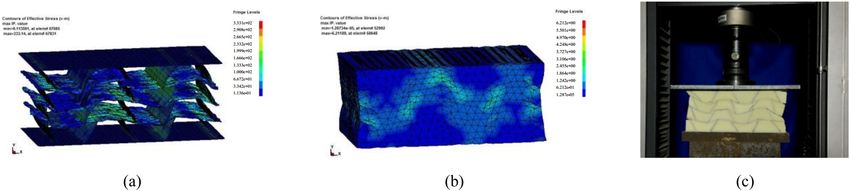
Energy absorption behavior of novel composite structures 511
foam model (material type 63) with a failure criterion was with vertical lattice web is the same as the experimental
applied to simulate the PU foam. The top and bottom result. The polyurethane foam was compressed gradually,
rigid plates were simplified as rigid plates simulated by and the shear failure of the outer foam did not occur,
*MAT_RIGID. which was consistent with the experimental phenomenon.
Figures 13–15 show the strain and stress of trapezoid
specimens. The horizontal lattice structure of 45° and 60°
4.1.3 Loading and boundary conditions trapezoid specimens is gradually bent, the oblique lattice
structure is gradually compressed and close to each
The FE model boundary control condition is consistent other, and the foam is compressed and compacted, which
with the experimental loading control condition. The agrees well with the experimental phenomena. The hori-
bottom rigid plate was fixed, and the loading plate is zontal lattice of 75° trapezoidal lattice is gradually bent in
loaded by the method of specifying loads, and the loading FEM numerical simulation, which is different from the
speed is controlled to be 2 mm·min−1. failure phenomenon of the delamination of the diagonal
lattice during the compressed process.
Figure 16 draws load–displacement curves of numer-
4.1.4 Contact definition ical simulations and experimental data. In the stage of
elastic compression, the finite element simulation value
In the FE modeling of composites, the interface slip and is very close to the experimental curve. In the compaction
contact between different elements are crucial problems, stage, the failure element is deleted when the compres-
particularly the problem related to the composite defor- sive stress is too large or the shear failure is reached
mation [3]. The contact algorithm *CONTACT_AUTOMATIC_ because of the failure criterion of the crushing foam
SURFACE_TO_SURFACE was used between the loading model (*MAT_Crushable_Foam) is added in the finite ele-
plate and the composite specimen, and the static and ment simulation. Therefore, the finite element simulation
dynamic friction coefficients were set to 0.1 [32]. curve is slightly lower than the test loading curve, and
the bearing capacity does not show an obvious strength-
ening rising stage.
The comparison of the elastic ultimate load, elastic
4.2 Numerical simulation verification deformation and initial stiffness between the numerical
simulations and results is presented in Table 7. The
Figure 12 shows the deformation diagram of the TS-V numerical result of the initial stiffness of the specimen
specimen obtained by finite element numerical simula- is slightly larger than the experimental result. First, the
tion coincides with the experimental compression defor- error is caused by the inevitable convex fold at the outer
mation results. The bending failure of TS-V specimens boundary of the lattice web, which is completely
Table 6: The parameters of GFRP
Property LS-DYNA parameter Experimental value
Density RO 1.8 g·cm−3
Modulus in longitudinal direction EA 19.1 GPa
Modulus in transverse direction EB 19.1 GPa
Modulus in C direction EC 4.98 GPa
Shear modulus GAB 2.5 GPa
Shear modulus GAC 1.25 GPa
Shear modulus GBC 1.25 GPa
Poisson’s ratio PRBA 0.15
Longitudinal tensile strength XT 208.1 MPa
Transverse tensile strength YT 208.1 MPa
Compressive strength in longitudinal direction XC 84.7 MPa
Compressive strength in transverse direction YC 84.7 MPa
Nonlinear shear coefficient α 0.3
Shear strength SC 55 MPa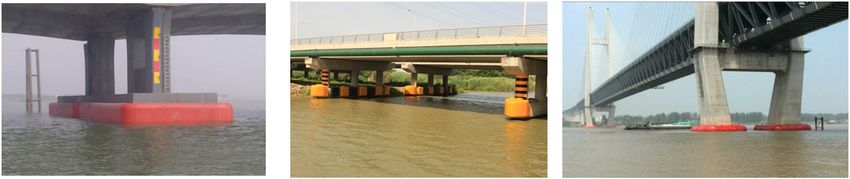
512 Juan Han et al. Figure 12: Strain and stress of specimen TS-V: (a) GFRP, (b) PU foam, (c) quasi-static experiment. Figure 13: Strain and stress of specimen TS-T-A45: (a) GFRP, (b) PU foam, (c) quasi-static experiment. Figure 14: Strain and stress of specimen TS-T-A60: (a) GFRP, (b) PU foam, (c) quasi-static experiment. Figure 15: Strain and stress of specimen TS-T-A75: (a) GFRP, (b) PU foam, (c) quasi-static experiment. compressed at the beginning of the test compression with fiber will slide along the inclined side when it is pressed leading to the lower initial stiffness and bearing capacity. from both sides; as a result, there are inevitable errors Second, when the trapezoid lattice web is formed in one-step between the established finite element model and the actual vacuum injection molding, the sandwich foam wrapped machined specimen. The debonding failure of lattice web
Energy absorption behavior of novel composite structures 513
180
120 Experimentaal
Expperimental 160
Numerical
100 Nummerical 140
120
Load (kN)
Load (kN)
80
100
60 80
60
40
40
20 20
0
0 0 20 40 60 80 100 120
0 20 40 60 80 100 120
Displacement (mm) Displacement (mm)
(a) (b)
160 180
Expeerimental
140 Num
merical 160 Experimenntal
140 Numericall
120
120
Load (kN)
Load (kN)
100
100
80
80
60
60
40
40
20 20
0 0
0 20 40
0 60 880 100 120 0 220 40 60 80 100 120
Displacement (mm) Displacement (mm)
(c) (d)
Figure 16: Comparison of load–displacement curves between the numerical simulations and results: (a) vertical lattice webs, (b) 45
trapezoid space lattice webs, (c) 60 trapezoid space lattice webs, (d) 75 trapezoid space lattice webs.
Table 7: Comparison of the elastic ultimate load and initial stiffness between the numerical simulations and results
Specimen PE (kN) ΔP1 (mm) K (kN·mm−1)
Exp Num Error (%) Exp Num Error (%) Exp Num Error (%)
TS-V 116.1 90.4 −22.1 5.4 3.6 −33.3 21.5 25.1 14.3
TS-T-A45 66.7 68.7 3.0 33.7 27.9 −17.2 2.0 2.46 23.0
TS-T-A60 36.9 41.1 11.4 16.4 13.8 −16.2 2.3 2.9 26.1
TS-T-A75 63.3 65.8 3.9 6.1 7.5 22.9 8.4 9.0 7.1
and foam core cannot be simulated effectively in finite ele- as foam density and lattice thickness. The 45° trapezoid
ment simulation, which leads to a slightly higher simulation lattice composite specimens were chosen to analyze.
value compared to the experimental value.
5.1 Effects of foam density
5 Parametric study Figure 17 presents the foam density influence on the 45°
trapezoid lattice composite specimens and the bearing
The experimental results could be forecasted by the FE load when the face sheet and trapezoid lattice web thick-
model with enough precision. So we can use the FE ness are constant. Table 8 lists the elastic ultimate
model to study the effects of different parameters such bearing capacity (PE), the elastic displacement and the514 Juan Han et al.
Figure 17: Displacement–load curve of specimens. Figure 18: Displacement–load curve of specimens.
initial stiffness (K) of the 45° trapezoid lattice composite thickness increased from 1.2 to 2.4 mm and 3.6 mm, the
specimens with three foam densities. When the foam elastic ultimate bearing capacity increased by 177.1 and
density was 20, 40 and 60 kg·m−3, the elastic ultimate 308.9% respectively, and the initial stiffness increased by
bearing capacity were 53.2, 68.7 and 79.8 kN, respec- 112.1 and 616.4%, respectively.
tively. The foam density increased from 20 to 40 kg·m−3
and 60 kg·m−3, the elastic ultimate bearing capacity
increased by 29.1 and 50.0% respectively, and the initial
stiffness increased by 21.8 and 49.0% respectively. How- 6 Finite element analysis of
ever, the corresponding elastic displacement does not
composite anti-collision device
change much.
The Wuhu Yangtze River Bridge is the first highway-railway
cable-stayed bridge on the Yangtze River in China. The
main span is 312 m, and the main span and two side spans
5.2 Effects of face sheet and lattice web are navigable spans. Piers No. 9–12 have the risk of ship–
thickness bridge collisions. Hence, designing anti-collision devices for
piers of navigable span is vital to guarantee the safety of the
Figure 18 presents the thickness influence of the face bridge (Figure 19).
sheet and lattice web on the 45° trapezoid lattice compo- The floating composite anti-collision device installed
site specimens and bearing load when the foam density is on Pier No. 12 of the Wuhu Yangtze River Bridge is simu-
constant. Table 9 lists the elastic ultimate bearing capa- lated by the finite element method. A comparative analysis
city (PE), the elastic displacement and the initial stiffness about the energy dissipation effect was made between the
(K) of the 45° trapezoid lattice composite specimens composite anti-collision device with 45° trapezoid space
with three kinds of thickness. When thickness values lattice webs and vertical lattice webs. The structural layout
are 1.2, 2.4 and 3.6 mm, the elastic ultimate bearing capa- of Pier No. 12 and the layout of anti-collision devices are
city values are 24.8, 68.7 and 101.4 kN, respectively. The shown in Figure 20.
Table 8: The effect of the density of foam
Specimen Density (kg·m−3) PE (kN) ΔP1 (mm) K (kN·mm−1)
TS-T-A45-F2-D20 20 53.2 26.28 2.02
TS-T-A45-F2-D40 40 68.7 27.9 2.46
TS-T-A45-F2-D60 60 79.8 26.5 3.01Energy absorption behavior of novel composite structures 515 Table 9: The effect of the thickness of the lattice Specimen ts (mm) tw (mm) PE (kN) ΔP1 (mm) K (kN·mm−1) TS-T-A45-F1-D40 1.2 1.2 24.8 21.3 1.16 TS-T-A45-F2-D40 2.4 2.4 68.7 27.9 2.46 TS-T-A45-F3-D40 3.6 3.6 101.4 12.2 8.31 Figure 19: Wuhu Yangtze River Bridge. Figure 20: Layout of Pier No. 12 with floating composite anti-collision device: (a) head-on elevation view, (b) side elevation view, (c) planar view. (Note: Except as indicated in the figure, the remainder is calculated as cm.)
516 Juan Han et al.
Figure 21: Numerical model of ship impact on bridge and composite anti-collision device: (a) ship – pier collision, (b) internal structure of
ship bow, (c) ship–pier collision with anti-collision s device, (d) the composite anti-collision device and (e) the composite anti-collision
device with 45 trapezoid space lattice webs.
6.1 Numerical model 6.2 Simulation results
To assess the protective property of composite anti-colli- In general, the head-on collision is the most severe colli-
sion device, a detailed FE model was developed using the sion and generates maximum impact load. This article
program ANSYS/LS-DYNA. In the numerical analysis, calculates the ship head-on impact of the pier with and
the soil–structure interaction is considered by fixing the without the composite anti-collision device under the
pile foundation. According to the calculation of the site highest water level. The initial velocity of the ship is
geological conditions, the pile–soil interaction is consid- 2.62 m·s−1.
ered in the way that the pile length was supposed to be Figure 22 shows the time history of impact force at the
eight times pile diameter below the mud line. An elastic highest water level under three impact conditions. The
material was applied to model the concrete pier, and its
Young’s modulus ratio and Poisson’s ratio were 32.5 MPa
and 0.2, respectively.
35 34.21 MN
The representative ship of the Wuhu Yangtze River Without anti-collision system
t =3.67s Vertical lattice webs
Bridge was a 10,000 DWT vessel. The total weight was 30 Trapezoid lattice webs
15,000 ton (i.e., 5,000 ton of self-weight and 10,000 ton 25
Force(MN)
of cargo weight). The internal structure of the ship bow is 7.84 MN
shown in Figure 21(b). The MAT_PLASTIC_KINEMATIC 20
t =5.62s 9.48 MN
model [33] was applied to model the ship, and the major 15 t =4.19s
parameters are presented in ref. [6]. 10
The numerical model of ship impact on the bridge is
shown in Figure 21(a), and ship–pier collision with a 5
composite anti-collision device is shown in Figure 21(c). 0
Numerical models of the composite anti-collision device 0 1 2 3 4 5 6 7
with 45° trapezoid space lattice webs and vertical lattice Time(s)
webs are presented in Figure 21(d) and (e), respectively.
The material mode of a composite anti-collision device Figure 22: Load–time curve of the ship impact bridge. (Note:
was referred to 4.1.2. t represents the time duration.)Energy absorption behavior of novel composite structures 517
impact force of the ship without the anti-collision device initial stiffness (K) is to widen the thickness of face
is 34.21 MN. After the installation of the composite anti- sheets and lattice webs and increase the foam density.
collision device, the impact force is remarkably reduced. (3) The floating composite anti-collision device installed
The peak impact force with a composite anti-collision on pier 12 of the Wuhu Yangtze River Bridge is simu-
device with vertical lattice webs is 9.48 MN, the peak lated by the finite element method. A comparative
impact force with composite anti-collision device with analysis about the energy dissipation effect was made
45° trapezoid space lattice webs is 7.84 MN, and the between the composite anti-collision device with 45°
peak impact force decreases by 72.3 and 77.1% respec- trapezoid space lattice webs and vertical lattice webs.
tively. The time duration is 3.67 s without anti-collision The results show that after changing the cross section
device. It is prolonged after the installation of the com- form of anti-collision device, the peak impact force of
posite anti-collision device, and time duration is 4.19 s the composite anti-collision device of 45° trapezoidal
when composite anti-collision device with vertical lattice lattice webs will be reduced by 17.3%, the time duration
webs is installed, the time duration of composite anti- will be prolonged by about 31.1%, and the impact pro-
collision device with 45° trapezoid space lattice webs tection effect of the bridge pier will be better.
was 5.62 s, and time duration was prolonged by 14.2
and 53.1%, respectively. After adding floating composite
anti-collision devices, the ship impact force is reduced Funding information: This research was supported by the
significantly, the ship impact time is prolonged, and the National Natural Science Foundation of China (Grant
damage to bridge piers is effectively reduced. The com- Nos. 52078248, 51778285), the Natural Science Foundation
posite anti-collision device with 45° trapezoid space lat- for distinguished Young Scholars of Jiangsu Province (Grant
tice webs instead of vertical latticed webs reduces the No. BK20190034), Scientific Research Project of Hunan
impact force of the ship by about 17.3%. The impact Provincial Department of Transportation (Grant No.
time was extended by about 31.1%. Therefore, the compo- 201916), Postgraduate Research & Practice Innovation
site anti-collision device with 45° trapezoid space lattice Program of Jiangsu Province (Grant No. KYCX20_1007) and
webs has between anti-collision protection on pier. the Funds for Youth Creative Research Groups of Nanjing
Tech University.
Conflict of interest: Authors state no conflict of interest.
7 Conclusion
Author contributions: Investigation, data curation, writing-
The energy absorption performance of novel foam-filled original draft, J.H.; writing- reviewing and editing, L.Z.;
sandwich composite structures reinforced by trapezoidal conceptualization, methodology, H.F.; formal analysis soft-
latticed webs was conducted using the experimental ware, J.W.: validation, writing- reviewing and editing, P. W.
study and the numerical simulation analysis. The major
results allow the following findings: Data availability statement: The original data can be
(1) The experimental results indicate that the 45° trape- found by clicking the figure directly on the computer
zoidal latticed specimen has the most ideal load–dis- installed with origin software.
placement curve. This specimen not only avoids the
problem of sudden drop in bearing capacity but also
greatly improves the elastic stroke. The elastic displa-
cement and bearing capacity after the compression References
stroke (PS) of foam-filled sandwich composite struc-
tures reinforced by 45° trapezoidal latticed webs are [1] AASHTO. Guide specification and commentary for vessel colli-
624.1 and 439.8%, respectively, in comparison with sion design of highway bridges, American Association of
foam-filled sandwich composite structures reinforced State. Highway Transp Office, 2009.
by vertical lattices. [2] Consolazio, G. R. and D. R. Cowan. Numerically efficient
(2) The FE model on account of experimental material dynamic analysis of barge collisions with bridge piers. Journal
of Structural Engineering, Vol. 131, 2005, pp. 1256–1266.
properties could well forecast the crush response.
[3] Wan, Y., L. Zhu, H. Fang, W. Liu, and Y. Mao. Experimental
The parameter analysis on account of the verified testing and numerical simulations of ship impact on axially
FE model demonstrated that the approach to improve loaded reinforced concrete piers. International Journal of
the elastic ultimate bearing capacity (PE) and the Impact Engineering, Vol. 125, 2019, pp. 246–262.518 Juan Han et al.
[4] Garrido, M., R. Teixeira, J. Correia, and L. Sutherland. Quasi- Newmark method. Engineering Structures, Vol. 189, 2019,
static indentation and impact in glass-fibre reinforced polymer pp. 111–128.
sandwich panels for civil and ocean engineering applications. [19] Mitra, N., A. Patra, S. Mondal, and P. K. Datt. Interfacial dela-
Journal of Sandwich Structures and Materials, Vol. 23, No. 1, mination crack profile estimation in polymer foam-cored
2021, pp. 194–221. sandwich composites. Engineering Structures, Vol. 189, 2019,
[5] Wang, L., L. Yang, D. Huang, Z. Zhang, and G. Chen. An impact pp. 635–643.
dynamics analysis on a new crashworthy device against [20] Luo, Y. H. and H. L. Fan. Energy absorbing ability of rectangular
ship–bridge collision. International Journal of Impact self-similar multi-cell sandwich walled tubular structure.
Engineering, Vol. 35, 2008, pp. 895–904. Thin-walled Structures, Vol. 124, 2018, pp. 88–97.
[6] Fang, H., Y. Mao, W. Liu, L. Zhu, and B. Zhang. Manufacturing [21] Chen, J., H. Fang, W. Liu, L. Zhu, Y. Zhuang, J. Wang, and J. Han.
and evaluation of large-scale composite bumper system for Energy absorption of foam-filled multi-cell composite panels
bridge pier protection against ship collision. Composite under quasi-static compression. Composites Part B:
Structures, Vol. 158, 2016, pp. 187–198. Engineering, Vol. 153, 2018, pp. 295–305.
[7] Zhu, L., W. Liu, H. Fang, J. Chen, Y. Zhuang, and J. Han. Design [22] Zhang, Z., H. Lei, M. Xu, J. Hua, C. Li, and D. Fang. Out-of-plane
and simulation of innovative foam-filled lattice composite compressive performance and energy absorption of multi-
bumper system for bridge protection in ship collisions. layer graded sinusoidal corrugated sandwich panels.
Composites Part B: Engineering, Vol. 157, 2019, pp. 24–35. Materials & Design, Vol. 178, 2019, id. 107858.
[8] Svensson, H. Protection of bridge piers against ship collision. [23] Amith Kumar, S. J. and S. J. Ajith Kumar. Low-velocity impact
Steel Construction, Vol. 2, No. 1, 2009, pp. 21–32. damage and energy absorption characteristics of stiffened
[9] Voyiadjis, G. Z., S. M. EI-Tawil, and P. J. Kocke. Feasibility of syntactic foam core sandwich composites. Construction and
tubular fender units for pier protection against vessel collision. Building Materials, Vol. 246, 2020, id. 118412.
Louisiana Transportation Research Center, Baton Rouge [24] Wu, Z., W. Liu, L. Wang, H. Fang, and D. Hui. Theoretical and
(LA), 2008. experimental study of foam-filled lattice composite panels
[10] Avalle, M., G. Belingardi, and A. Ibba. Mechanical models of under quasi-static compression loading. Composites Part B:
cellular solids: Parameters identification from experimental Engineering, Vol. 60, 2014, pp. 329–340.
tests. International Journal of Impact Engineering, Vol. 34, [25] Wang, L., W. Liu, Y. Fang, L. Wan, and R. Huo. Axial crush
No. 1, 2007, pp. 3–27. behavior and energy absorption capability of foam-filled
[11] Fan, W., W. C. Yuan, and B. S. Chen. Steel fender limitations GFRP tubes manufactured through vacuum assisted resin
and improvements for bridge protection in ship collisions. infusion process. Thin-walled Structures, Vol. 98, 2016,
Journal of Bridge Engineering, Vol. 20, No. 12, 2015, pp. 263–273.
id. 06015004. [26] ASTM D3039/D3039M-17. Standard test method for tensile
[12] Jiang, H. and M. G. Chorzepa. Evaluation of a new FRP fender properties of polymer matrix composite materials, ASTM, PA,
system for bridge pier protection in ship collisions. Journal of USA, 2017.
Bridge Engineering, Vol. 20, No. 2, 2015, id. 05014010. [27] ASTM D695-15. Standard test method for compressive prop-
[13] Ahmed, A. and L. Wei. The low-velocity impact damage resis- erties of rigid plastics, ASTM, PA, USA, 2015.
tance of the composite structures – a review. Reviews on [28] ASTM C365/C365-16. Standard test method for flatwise com-
Advanced Materials Science, Vol. 40, No. 2, 2015, pp. 127–145. pressive properties of sandwich cores, ASTM, PA, USA, 2016.
[14] Evaristo, F. and S. Basir. Shift in failure modes in foam core [29] Belytschko, T., J. I. Lin, and C. S. Tsay. Explicit algorithms for
sandwich composites subject to repeated slamming on water. the nonlinear dynamics of shells. Computer Methods in
Journal of the Mechanical Behavior of Materials, Vol. 22, Applied Mathematics, Vol. 42, No. 2, 1984, pp. 225–51.
No. 1–2, 2013, pp. 73–80. [30] Chang, F. K. and K. Y. Chang. Post-failure analysis of bolted
[15] Ismael de la, P. and S. Basir. Creep relaxation and fully composite joints in tension or shear-out mode failure.
reversible creep of foam core sandwich composites in sea- Journal of Composite Materials, Vol. 21, No. 9, 1987, pp.
water. Journal of the Mechanical Behavior of Materials, Vol. 24, 809–833.
No. 5–6, 2015, pp. 187–194. [31] Chang, F. K. and K. Y. Chang. A progressive damage model for
[16] Wu, Y., B. Tang, K. Liu, X. Zeng, J. Lu, T. Zhang, and X. Shen. laminated composites containing stress concentrations.
Enhanced flexural properties of aramid fiber/epoxy compo- Journal of Composite Materials, Vol. 21, No. 9, 1987,
sites by graphene oxide. Nanotechnology Reviews, Vol. 8, pp. 834–855.
No. 1, 2019, pp. 484–492. [32] Sayahlatifi, S., G. Rahimi, A. Bokaei. Experimental and
[17] Tao, J., F. Li, D. Zhang, J. Liu, and Z. Zhao. Manufacturing and numerical investigation of sandwich structures with balsa core
mechanical performances of a novel foam core sandwich- and hybrid corrugated composite/balsa core under three-
walled hollow column reinforced by stiffeners. Thin-walled point bending using digital image correlation. Journal of
Structures, Vol. 139, 2019, pp. 1–8. Sandwich Structures and Materials, Vol. 23, No. 1, pp. 94–131.
[18] Ahmadi, S. A., M. H. Pashaei, and R. A. Jafari-Talookolaei. [33] Hallquist, J. O. LS-DYNA keyword user’s manual, version 971,
Three-dimensional elastic-plastic pulse response and energy Livemore Software Technology Coporation, Livemore (CA),
absorption of curved composite sandwich panel using DQ – USA, 2010.You can also read