Quantum 3D Microscope - Benchmark Study - THE DIFFERENCES OF WORKING A CASE USING 3D MICROSCOPY VERSUS CONVENTIONAL COMPARISON MICROSCOPY - Ultra ...
←
→
Page content transcription
If your browser does not render page correctly, please read the page content below
Quantum 3D Microscope –
Benchmark Study
THE DIFFERENCES OF WORKING A CASE USING 3D MICROSCOPY VERSUS
CONVENTIONAL COMPARISON MICROSCOPY

July 2021

Ron Nichols, Paul Murphy, Andrew Boyle, and Michel Paradis
                                      1
TABLE OF CONTENTS

          1. INTRODUCTION                                                                                    3
          2. STUDY RESULTS – RON NICHOLS                                                                     9
          3. STUDY RESULTS – PAUL MURPHY                                                                   19
          4. DISCUSSION                                                                                    27
          5. CONCLUSION                                                                                    31

                                                       OVERVIEW
            ● This benchmark study involved the use of 3D microscopy to analyze a forensic firearm case,
              and examined the differences with conventional comparison microscopy.
            ● The case contained 24 bullets fired from Ruger brand firearms using 9 mm Luger
              ammunition.
            ● The work was performed independently by two seasoned forensic firearm examiners. Each
              of them analyzed the 24 bullets, first using a conventional comparison microscope, and then
              repeating the examination using a 3D microscope.

                                                       HIGHLIGHTS
            ● Using the Quantum 3D Microscope™ to analyze the 24 bullets yielded a 9x to 10x time
              saving compared to the use of a conventional comparison microscope.
            ● The superior quality of images produced by the Quantum 3D Microscope enhanced the
              confidence of common source determinations and alleviated some of the concerns for
              potential bias during the analysis work.
            ● The Quantum 3D Microscope improved the reliability of the common source determinations
              by providing scientifically defensible false match rates associated with the results obtained.
            ● In line with the AFTE Theory of Identification and Range of Conclusions, the RBL diagram of
              the Quantum 3D Microscope helped the examiners graphically establish clear distinctions
              between non-matching and matching conditions of the analyzed bullets.

          The copyright of this work belongs to the authors and Ultra Electronics Forensic Technology Inc., who
          are solely responsible for the content. This work is licensed under the Creative Commons Attribution-
          NonCommercial-NoDerivatives 4.0 International License (CC BY-NC-ND 4.0). To
          view a copy of this license, visit Creative Commons1 or send a letter to Creative
          Commons, 559 Nathan Abbott Way, Stanford, CA, 94305, USA.

1
    http://creativecommons.org/licenses/by-nc-nd/4.0

                                                           2
1. INTRODUCTION
   The purpose of this study was to compare how 3D microscopy can be applied to a
   forensic firearm case workflow, and to establish the differences when using a
   conventional comparison microscopy. More specifically, the Quantum 3D Microscope™
   was used with a case involving 24 bullets fired from multiple firearms, including two
   known firearms.

   The Quantum 3D Microscope
   The Quantum 3D Microscope (Q3M) (FIGURE 1) was first introduced in May 2020 by Ultra
   Forensic Technology. The Q3M is a workstation that allows the capture of marks on small
   objects, such as bullets, with surfaces having cylindrical, flat, and wavy shapes. While this
   typically involves bullets, it may include toolmarks such as those produced by the firearm
   chamber on the sides of fired cartridge cases. Accurate measurements of these
   toolmarks are assured as Q3M is calibrated using ISO 17025 certified reference targets.

                      FIGURE 1: QUANTUM 3D MICROSCOPE BY ULTRA FORENSIC TECHNOLOGY

   In addition to measuring and capturing toolmarks on object surfaces, quantitative
   analysis can be performed to establish the False Match Rate (FMR) between two bullets.
   The FMR calculation is based on two different scores: the pattern matching score and

                                                  3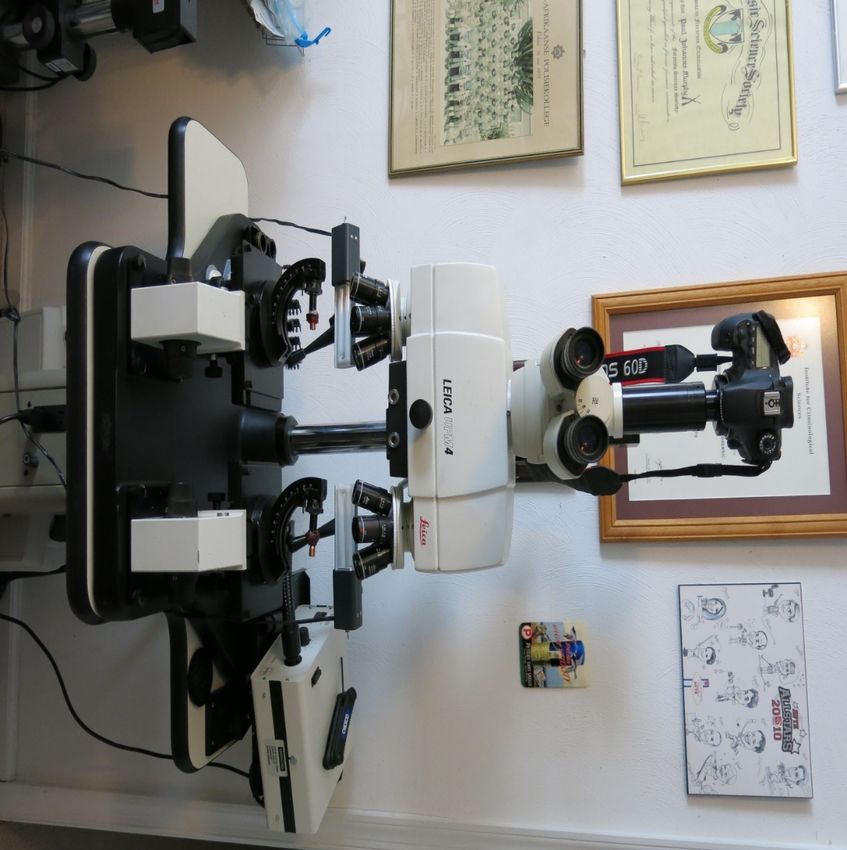
the line counting score. These scores are plotted on a RBL Graph (FIGURE 2). The pattern
           matching score (PMS) is represented horizontally and the line counting score (LCS) is
           represented vertically. The FMR is determined from the placement of these two scores
           within the graph. The FMR for a given similarity score represents the probability that two
           bullets that were not fired by the same firearm would generate a higher similarity score.

                     FIGURE 2: REPRESENTATIVE RBL GRAPH SHOWING A FMR INDEX OF 13.99 FOR TF-02-A AND TF-02-B

           Q3M has been discussed in previously published articles and webinars2 including:

            ●   Roberge, D., Beauchamp, A., Levesque, S., 2019. Objective identification of bullet
                based on 3D pattern matching and line counting scores. International Journal of
                Pattern Recognition and Artificial Intelligence 33(11) DOI: 10.1142.
            ●   Quantum 3D Microscope - What to Expect from the Arrival of the Quantum 3D
                Microscope. White Paper, Ultra Forensic Technology (2020).
            ●   Quantum 3D Microscope - Introducing a game changer for firearm and toolmark
                examiners. Webinar, Ultra Forensic Technology (May 2020).
            ●   Multi-Caliber Quantitative Analysis. Webinar, Ultra Forensic Technology (December
                2020).

2
    Published articles and webinars available at www.ultra-forensictechnology.com/en/quantum.

                                                               4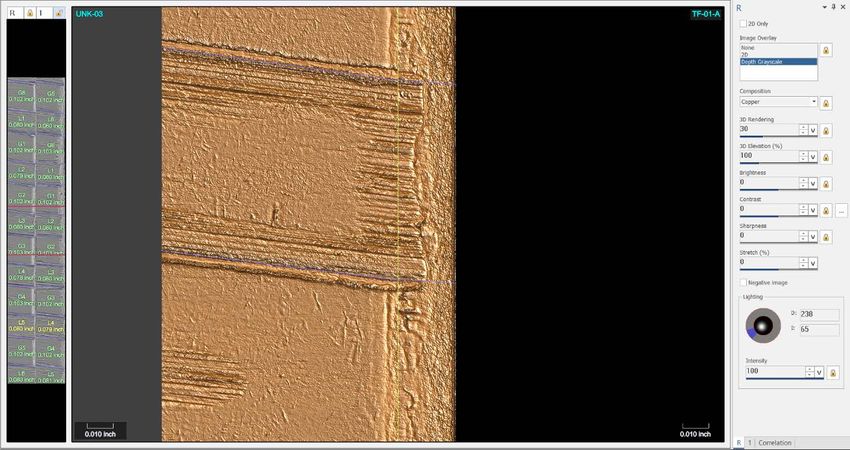
The Approach
This study involved 24 bullets were acquired using a Q3M Workspace labeled
FT_Trial_Set-01. Their relationship was that some of them were from known firearms
while others were unknowns. The goal was to emulate evidence that could have been
recovered from a crime scene, or related criminal cases involving firearms.

All bullets were fired by Ruger brand firearms, using 9 mm Luger ammunition of various
brands, and had six lands and grooves with a right twist and with similar dimensions. All
test fired bullets were supplied by the Allegheny County Crime Laboratory. Bullet
acquisitions into the Q3M took approximately 4.5 hours to complete. FIGURE 3 shows the
mounting of the bullet prior to acquisition.

                    FIGURE 3: BULLET MOUNTED PRIOR TO ACQUISITION INTO THE Q3M

The bullets were imaged into Q3M in the following numerical sequence:

                   Firearm 1                    Firearm 2                        Unknowns
                   TF-01-A                         TF-02-A                 UNK-01 through
                   TF-01-B                         TF-02-B                    UNK-20

The bullets were then sorted into individual bags for conventional comparison
microscope (CCM) examinations and given the following alphabetical naming sequence:

                   Firearm 1                    Firearm 2                        Unknowns
                   TF-01-A                         TF-02-A                  UNK-A through
                   TF-01-B                         TF-02-B                     UNK-T

                                               5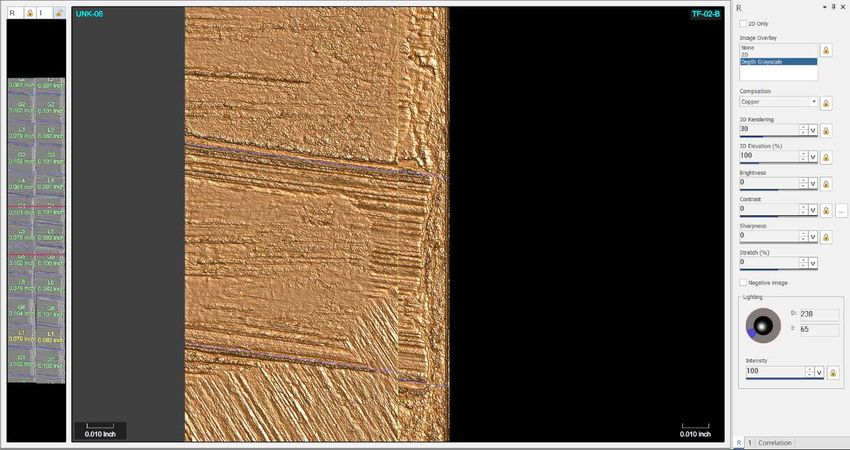
Different matching keys were used for the Q3M and CCM tests. The alphabetical
designations were randomly assigned to the 20 unknown bullets, so they were not
assigned in the same sequence as UNK-01 to UNK-20.

However, it is important to note that the CCM results in this study are presented using
their numerical equivalent instead of their letter designations. This conversion is useful
to have a correspondence with the Q3M results, and it also allows the key to the letter
designations to remain hidden for future participants desiring to complete a similar
study reusing these bullets.

The physical bullets were sent to two firearm examiners, Mr. Ron Nichols, and Mr. Paul
Murphy, along with a USB flash drive containing the FT_Trial_Set-01 workspace.
Instructions were to compare the 24 bullets using conventional comparison microscopy
as though they were bullets submitted in a typical case. Once completed, the 24 bullets
were to be compared using Q3M. The different designations prevented knowledge from
the conventional comparison microscope to be used when performing the comparisons
using the Q3M.

The examiners’ experiences and available conventional comparison microscopes were
slightly different. Therefore, the study results of each examiner will be presented
separately in the next sections.

About the Authors
Ronald Nichols, FORENSIC FIREARM EXAMINER, INSTRUCTOR AND
CONSULTANT – Ron began his forensic science career in 1984 with the
Contra Costa County Sheriff-Coroner laboratory in Northern
California. After five years performing casework in drug identification
as well as forensic toxicology Ron accepted a position with Oakland
Police Department, serving as a Criminalist until 2000. While with
Oakland he began his career specialty as a firearm and toolmark
examiner. In 2001, he was hired as a firearm and toolmark examiner
with the Bureau of Alcohol, Tobacco, Firearms and Explosive (ATF). He served in the
Western Regional Laboratory for approximately 12 years before transferring to Field
Operations where he served to help the reboot of the NIBIN program nationwide
including the development of the NIBIN National Correlation and Training Center. Ron
took early retirement in 2017 to establish a consulting and training firm. Since then, his
primary focus has been on case consultation along with the development and
implementation of training for current and new firearm examiners. Ron has published
two books (Firearm and Toolmark Identification: The Scientific Reliability of the Forensic
Science Discipline, and Developing a Preventive Crime Gun Strategy: A Playbook for Success).
Ron also has four different book contributions and has published 17 articles in scientific
journals. The bulk of his work has focused on understanding the scientific foundations
of the firearm and toolmark discipline.

                                            6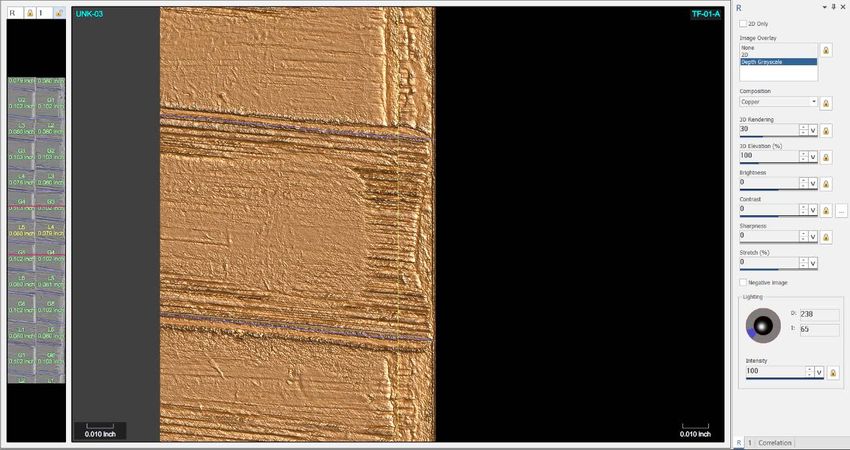
Paul Murphy, SENIOR FIREARMS TECHNICAL ADVISOR AND FORENSIC
FIREARM EXAMINER – Paul J. Murphy currently acts as Ultra Forensic
Technology’s Senior Firearms Technical Advisor and Subject Matter
expert. Paul has been in this role since 2005. Prior to this, Paul has
been a Forensic Firearm Examiner since 1984. He served in the
South African Police service for 22 years where he was trained as a
Forensic Firearm Examiner by the South African Police Forensic
Science Laboratory. During this period, Paul held the position of
Commanding Officer of the South African Police Service Eastern Cape Forensic Science
Laboratory, with the rank of Colonel until his resignation in 1999. Paul then move to the
United States and worked as a Senior Forensic Scientist for the Virginia DFS until 2005.
Paul cumulated 36 years of experience as a Forensic Firearm Examiner, and he is a
Distinguished Member of the Association of Firearm and Tool Mark Examiners (AFTE).

Andrew Boyle, FIREARMS FORENSIC SPECIALIST – During Andrew’s 27
years with Ultra Forensic Technology, he has held positions as an
IBIS Instructor, Firearm Researcher and Subject Matter Expert for
the Research & Prototyping Group. In the last 9 years, one of
Andrew’s roles has been to act as the liaison for the INTERPOL
Ballistics Information Network (IBIN) program. Working in
collaboration with INTERPOL, Andrew has travelled the world
promoting the benefits of IBIS and the IBIN program to forensic
firearm experts and government officials. Andrew currently works in the Marketing
department and is responsible for trials and demonstrations of IBIS products and the
Quantum 3D Microscope. Andrew designed and coordinated this benchmark study.

Michel Paradis, SENIOR PRODUCT MANAGER – After graduating from
the University of Sherbrooke, in Canada, with a degree in Electrical
Engineering, Michel started his career as a software designer in the
telecommunications industry. He joined Ultra Forensic Technology
in 2003 to lead the IBIS BRASSTRAX software development until 2006
when he became the product manager responsible for the
Integrated Ballistic Identification System (IBIS). As part of the
Marketing team, he is now responsible for the evolution of IBIS and the Quantum 3D
Microscope.

                                           7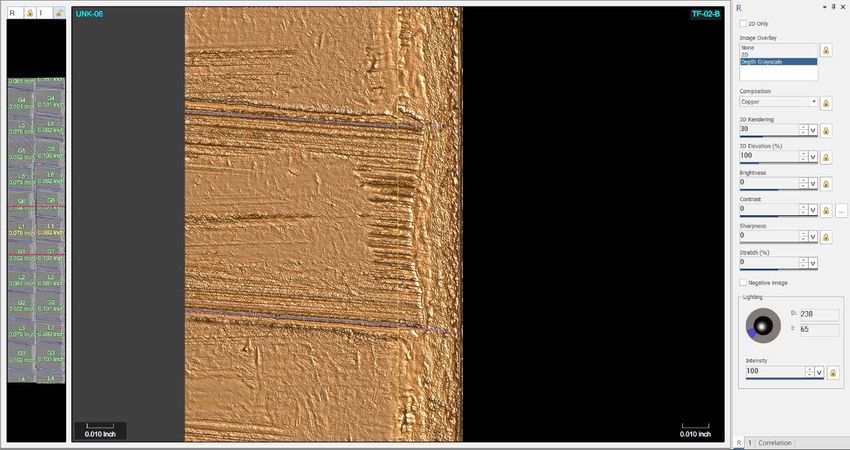
About Ultra Forensic Technology
Ultra Forensic Technology (www.ultra-forensictechnology.com) is a recognized leader in
providing innovative technology and sustainable solutions that help Law Enforcement &
Border Security agencies around the world prevent and solve crime. Ultra Forensic
Technology pioneered automated ballistic identification and analysis over 30 years ago
and continues to be a leader in forensic ballistics and firearm identification technologies
that promote a safer society. Ultra Forensic Technology created the Integrated Ballistic
Identification System (IBIS®) in 1991. IBIS technology can find the “needle in the
haystack”, suggesting possible matches between pairs of spent bullets and cartridge
cases, at speeds well beyond human capacity, in order to help forensic experts give
detectives more timely information about crimes, guns, and suspects.

Ultra Forensic Technology’s solutions help law enforcement and security agencies in
more than 130 countries solve firearm crime, authenticate questioned documents, and
investigate crime scenes.

Headquartered in Montreal (Canada), and with offices in the USA, Ireland, Switzerland,
Thailand, South Africa, and Mexico, Ultra Forensic Technology employs over 300
professionals worldwide. In 2014, Forensic Technology joined the Ultra group
(www.ultra.group), a successful publicly-traded international company headquartered in
London (United Kingdom). Ultra has a long and consistent record of innovating and
engineering solutions that satisfy customer requirements. Ultra provides application-
engineered solutions in the key elements of mission critical and intelligent systems.
Through innovative problem solving, using sustainable capabilities, and evolving
technologies, Ultra delivers outstanding solutions to its customers’ most complex
problems in defense, security, critical detection, and control environments.

                                            8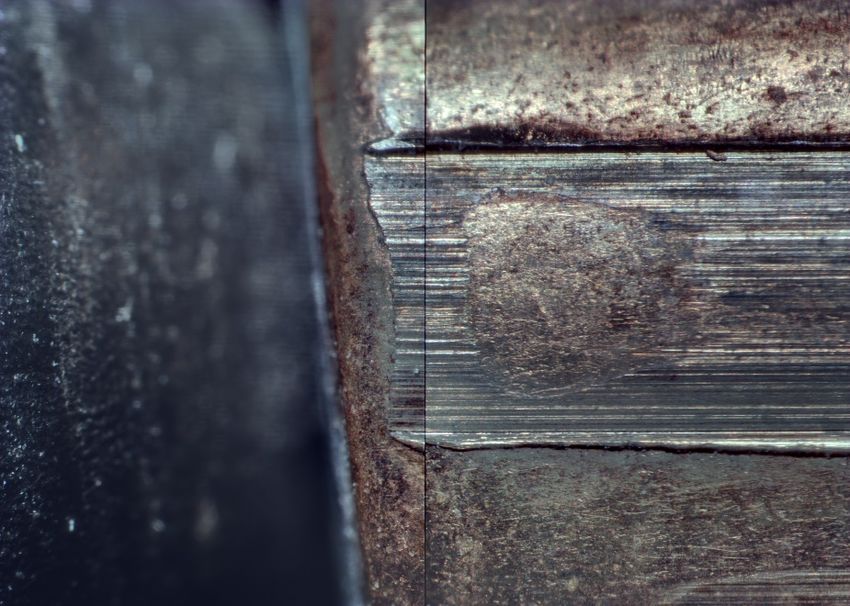
2. STUDY RESULTS – RON NICHOLS

   Conventional Comparison Microscopy
   EQUIPMENT. The initial comparisons were conducted using a VisionX equipped with
   objectives capable of the following magnifications – 6x, 10.8x, 19.4x, 32x, 57.6x, and 104x
   (FIGURE 4). Available lighting included LED ring lighting with the ability to be adjusted in
   quarters, spot lighting, and shadow-free lighting. For this study’s comparisons, shadow-
   free lighting was used. Photomicrographs of comparisons were taken using a 10MP
   USB-CMOS camera.

                          FIGURE 4: VISIONX CONVENTIONAL COMPARISON MICROSCOPE

                                                  9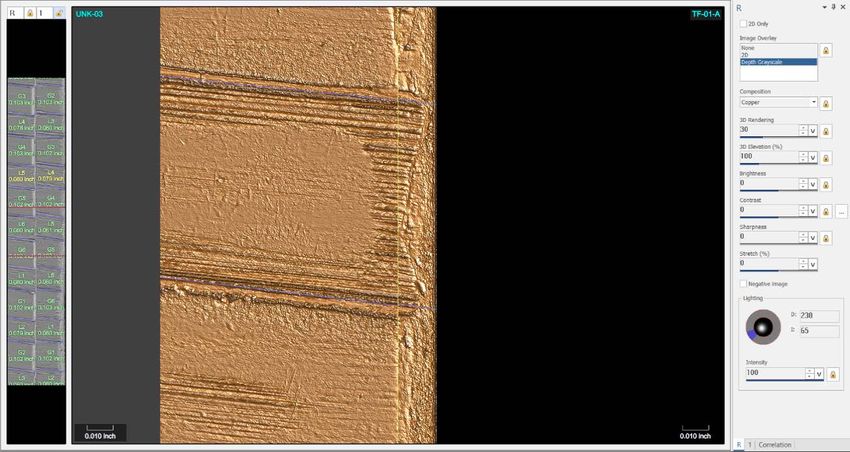
STRATEGY. Considering that the bullets were to be handled as a typical case submission,
the first step was to assess the class characteristics of the bullets to determine if any
could be distinguished based on differences in class characteristics. The next step was
to compare the test fired bullet pairs against each other to check for reproducibility. The
last step was to determine which of the 20 unknowns were fired by the known firearms
represented by the submitted test fired bullets. First, each of the unknowns A through T
were compared with TF-01 test fires, then TF-02 test fires were compared with Unknowns
A through T minus those identified to TF-01.

When comparisons to the known test fires were completed, the bullets identified to TF-
01 and TF-02 were removed, and a matrix was created to perform comparisons of the
remaining bullets. Note that this methodical and deliberate comparison strategy was
necessary to ensure the best results. The fact that all 20 unknowns had similar class
characteristics greatly complicated the process as none could be eliminated based on
class characteristics alone.

RESULTS. When comparing TF-01 with the 20 unknowns, two unknowns, 3 and 9, were
determined to have been fired from the same source. Only FT-01-A was used, after
strong reproducibility was established with FT-01-B, so this initial work involved a total of
20 comparisons, 18 of which were inconclusive. FIGURE 5 shows correspondence on three
different land-engraved areas of TF-01-A and Unknown 3.

          FIGURE 5: THREE DIFFERENT LAND-ENGRAVED AREAS OF TF-01-A AND UNKNOWN 3 USING VISIONX

When comparing TF-02-B with the remaining 18 knowns, two of them, 6 and 14, were
determined to have been fired from the same source. FIGURE 6 shows correspondence
on three different land-engraved areas of TF-02-B and Unknown 14. This work with TF-
02-B involved a total of 18 comparisons, 16 of which were inconclusive.

                                                  10
FIGURE 6: THREE DIFFERENT LAND-ENGRAVED AREAS OF TF-02-B AND UNK-14 USING VISIONX
Having identified four bullets to the two sets of knowns, 16 bullets remained and needed
to be compared with one another. A matrix such as the one below (FIGURE 7) was built to
ensure that all relevant comparisons were performed.
1 v 2 4 5 7 8 10 11 12 13 15 16 17 18 19 20
2 v 4 5 7 8 10 11 12 13 15 16 17 18 19 20
4 v 5 7 8 10 11 12 13 15 16 17 18 19 20
5 v 7 8 10 11 12 13 15 16 17 18 19 20
7 v 8 10 11 12 13 15 16 17 18 19 20
8 v 10 11 12 13 15 16 17 18 19 20
10 v 11 12 13 15 16 17 18 19 20
11 v 12 13 15 16 17 18 19 20
12 v 13 15 16 17 18 19 20
13 v 15 16 17 18 19 20
15 v 16 17 18 19 20
16 v 17 18 19 20
17 v 18 19 20
18 v 19 20
19 v 20
FIGURE 7: SAMPLE MATRIX OF COMPARISONS OF UNKNOWNS
As unknowns were identified with one another, samples identified as being from the
same firearm could be removed from the matrix to reduce the number of comparisons
performed.
11The results of the comparisons among the unknowns are listed below:
● Inferred Firearm A – Unknowns 4, 13, and 17
● Inferred Firearm B – Unknowns 5 and 20
● Inferred Firearm C – Unknowns 7, 11, 15, and 19
● Inconclusive – Unknowns 1, 2, 8, 10, 12, 16, and 18
FIGURE 8 and FIGURE 9 show correspondence for three different land-engraved areas of
Unknowns 13 and 17, and of Unknowns 15 and 19, respectively.
FIGURE 8: THREE DIFFERENT LAND-ENGRAVED AREAS OF UNKNOWNS 13 (LEFT) AND 17 (RIGHT) USING VISIONX
FIGURE 9: THREE DIFFERENT LAND-ENGRAVED AREAS OF UNKNOWNS 15 (LEFT) AND 19 (RIGHT) USING VISIONX
12Ideally, once a bullet was linked to another, it would be completely removed from the
matrix resulting in 100 performed comparisons. However, because the bullets varied in
design and the design difference could result in differences on how well-marked the
bullets were, an additional 44 comparisons were performed to address this. Of the 144
comparisons, 138 were inconclusive. Inconclusive results required extensive comparison
because every land-engraved area on one bullet had to be compared with every land-
engraved area on the second bullet. Approximately 80 hours were spent on the VisionX
in making these comparisons.
13Quantum 3D Microscope
STRATEGY. Given the power of the Q3M’s quantitative analysis technology, the decision
was made to target the comparisons to which initial attention should be directed. The
20 unknowns were compared against each other, and the results were sorted by the
False Match Rate Index in the Best Phase results.
FIGURE 10: TABULATED RESULTS (PARTIAL) AND RBL GRAPH FOR 20 UNKNOWNS
The preferred strategy of examining and comparing all the unknowns and making all
possible decisions regarding those unknowns prior to comparing with tests could be
employed. FIGURE 10 shows an excerpt of the highest tabulated results and the RBL
Graph of the 190 intercomparisons of the 20 unknowns.
14Once those comparisons were assessed and evaluated, the next step was to perform the
quantitative analysis of the test fires, TF-01 and TF-02. While this could be performed in
a combined graph with the unknowns compared against each other, it was instead done
separately to keep everything streamlined. For example, FIGURE 11 shows the partial
tabulated results with only the two unknowns sharing a common source with TF-01, and
the RBL Graph for TF-01 against all the unknowns.
FIGURE 11: TABULATED RESULTS (PARTIAL) AND RBL GRAPH FOR TF-01 VS. ALL UNKNOWNS
RESULTS. The results obtained using the Quantum 3D Microscope were the same as
they were for conventional comparison microscopy. The same bullets were identified,
and the same bullets had inconclusive results. What was significantly different was the
total amount of time spent performing the comparisons and the comfort with which they
were performed.
15When comparing the unknowns among themselves, the 12 highest scoring results were
confirmed within about one hour. The samples came up in the best “match” position and
could be phased immediately. Once the phase position was verified, it was easier to scan
the rest of the images to confirm that the two bullets showed sufficient correspondence
to conclude they shared a common source. While this is possible on the comparison
microscope, it does not happen often, and time must be taken to get the bullets into a
phase position. FIGURE 12 shows different land-engraved areas of UNK-04 and UNK-13.
FIGURE 12: THREE DIFFERENT LAND-ENGRAVED AREAS OF UNK-04 (LEFT) AND UNK-13 (RIGHT) USING Q3M
The pairs of bullets represented by the next 10 highest scores were assessed and
compared. The time spent was approximately 2½ hours and resulted in three same
source conclusions and seven inconclusive results. Once completed, samples with a
False Match Rate Index of less than 2 (FMR of 1 in 100) were compared. After several
were examined, it was decided that further comparisons would add no further value.
FIGURES 13A, 13B, AND 13C illustrate the strength of various FMR Index values combined
with the comparison viewing software showing one land-engraved area of the samples
in their best match position.
16FIGURE 13A: SAME SOURCE AT BEST MATCH POSITION, UNK-03 VS. UNK-09 – FMR INDEX: 19.20
FIGURE 13B: SAME SOURCE AT BEST MATCH POSITION, UNK-11 VS. UNK-15 – FMR INDEX: 4.32
FIGURE 13C: DIFFERENT SOURCE AT BEST MATCH POSITION, UNK-01 VS. UNK-17 – FMR INDEX: 1.85
17Once the unknowns were evaluated, they were compared with the known test fires. The
unknowns associated with each of those pairs of tests had a significantly higher FMR
Index and, when assessed and compared, were easily confirmed. In total, approximately
4 hours were spent performing the comparisons on the Quantum 3D Microscope. FIGURE
14 and FIGURE 15 show correspondence between TF-01-A vs. UNK-03 and TF-02-B vs.
UNK-14, respectively.
FIGURE 14: THREE DIFFERENT LAND-ENGRAVED AREAS OF UNK-03 (LEFT) AND TF-01-A (RIGHT) USING Q3M – FMR INDEX:
15.68
FIGURE 15: THREE DIFFERENT LAND-ENGRAVED AREAS OF UNK-14 (LEFT) AND TF-02-B (RIGHT) USING Q3M – FMR INDEX:
17.91
183. STUDY RESULTS – PAUL MURPHY
Conventional Comparison Microscopy
EQUIPMENT. The comparison work was conducted using a Leica UFM4 comparison
microscope equipped with fluorescent illumination and a Canon 60D DSLR camera
mounted with a phototube (FIGURE 16).
FIGURE 16: LEICA UFM4 CONVENTIONAL COMPARISON MICROSCOPE (CCM)
STRATEGY. Treating the trial bullets as a typical forensic firearms case submitted to a
forensic laboratory involved a series of steps. Firstly, a basic triage and examination of
the bullets was performed to determine caliber and class characteristics. The second
step was to microscopically intercompare the submitted test fires TF-01-A/B and TF-02-
A/B to determine reproducibility. The third step was to determine which of the unknown
bullets were fired by the same firearm that fired TF-01 and TF-02 pairs of submitted test
fired bullets. The fourth step was to examine the unknown bullets that were excluded as
19having been fired by TF-01 and TF-02 to determine from how many firearms they were
fired. Since all the submitted unknowns and test fired bullets were of the same caliber
and had similar general rifling class characteristics, the last step was complicated and
time consuming.
RESULTS. Comparison of the 20 unknown bullets to the TF-01 test fired bullets resulted
in 2 of the 20 unknowns identified as having been fired by the TF-01 firearm. Comparison
of the remaining 18 unknown bullets to the TF-02 test fired bullets resulted in 2 of the
remaining 18 unknown identified as having been fired by the TF-02 firearm. FIGURE 17
shows correspondence from comparisons of unknowns versus TF-01 and TF-02.
TF-01-B VS. UNKNOWN 9 TF-02-B VS. UNKNOWN 14
FIGURE 17: COMPARISONS OF TEST FIRES WITH UNKNOWNS USING LEICA UFM4 CCM
Intercomparison of the remaining 16 unknown bullets resulted in the following:
● A group of 3 unknown bullets were identified as having been fired by same firearm
and another (1) unknown was determined to be inconclusive as to having been fired
by the same firearm as this group. An example of the correspondence between two
of the three bullets identified in this group is show in FIGURE 18.
● Another group of 3 unknown bullets were determined to be inconclusive as to
having been fired by the same firearm.
● Another group of 2 unknown bullets were determined to be inconclusive as to
having been fired by the same firearm.
20Approximately 60 hours were spent performing all the comparisons on the Leica
microscope.
UNKNOWN 15 VS. UNKNOWN 19
FIGURE 18: CORRESPONDENCE OF TWO UNKNOWNS IDENTIFIED AS HAVING BEEN FIRED BY THE SAME FIREARM
21Quantum 3D Microscope
STRATEGY. The approach for performing the comparisons on the Quantum 3D
Microscope was similar to the strategy used for performing comparisons using
conventional comparison microscopy, namely:
1) Intercompare the TF-01 and TF-02 test fired bullet pairs to determine
reproducibility.
2) Compare the TF-01 and TF-02 test fired bullet pairs with the unknowns by means of
quantitative analysis to determine which bullets should be examined visually with
the comparison viewer:
a) Test fired pair 01 with 20 Unknowns.
b) Test fired pair 02 with 20 Unknowns.
3) Compare the remaining unknowns (not linked to TF-01 and TF-02) by means of
quantitative analysis to determine which groups of unknowns should be visually
examined with the comparison viewer to determine common source.
RESULTS. The results obtained by the Quantum 3D Microscope were more definitive
than the results obtained using conventional comparison microscopy. Step 1, which was
to intercompare the test fires within each pair to determine their reproducibility, was
done using quantitative analysis, and each pair demonstrated a high FMR Index. FIGURE
19 shows the RBL graph with the values for each of the test fire pairs.
TF-01-A VS. TF-01-B TF-02-A VS. TF-02-B
FIGURE 19: RBL GRAPHS OF TEST FIRE PAIRS USING Q3M
22For Step 2a, the TF-01 test fires were compared with the 20 unknowns, it was determined
that UNK-03 and UNK-09 were fired by the same firearm as TF-01. FIGURE 20 shows the
corresponding tabulated results with image comparison examples, and the RBL Graph.
UNK-09 VS. TF-01-B UNK-03 VS. TF-01-A
FIGURE 20: Q3M DATA FOR TF-01-A/B VS. UNK-03 AND UNK-09 (HIGHLIGHTED)
23For Step 2b, the TF-02 test fires were compared with the 20 unknowns, it was determined
that UNK-06 and UNK-14 were fired by the same firearm as TF-02. FIGURE 21 shows the
corresponding tabulated results with image comparison examples, and the RBL Graph.
UNK-06 VS. TF-02-B (LEA 3) UNK-14 VS. TF-02-B (LEA 4)
FIGURE 21: Q3M DATA FOR TF-02 VS. UNK-06 AND UNK-14 (HIGHLIGHTED)
24After the four unknowns were linked to the two firearms represented by the submitted
test fires, quantitative analysis was used to determine which of the remaining 16
unknowns should be compared with one another (Step 3). FIGURE 22 shows a portion of
the tabulated results and the RBL Graph for this quantitative analysis.
FIGURE 22: TABULATED RESULTS (PARTIAL) AND RBL GRAPH FOR 16 REMAINING UNKNOWNS
25Using Q3M, the following conclusions were confirmed for the unknowns that were not
previously identified to the submitted test fires. Three different groups of unknowns
were identified:
● UNK-05 and UNK-20 were identified as having been fired by the same firearm.
● UNK-04, UNK-13, and UNK-17 were identified as having been fired by the same
firearm.
● UNK-07, UNK-11, UNK-15, and UNK-19 were identified as having been fired by the
same firearm.
● The remaining seven unknowns revealed inconclusive results.
There were clear differences in the conclusions reached using Q3M compared to
conventional comparison microscopy. Positive conclusions were reached for two groups
of unknowns determined to be inconclusive using conventional comparison microscopy.
A positive conclusion was reached for a fourth bullet in the group of four identified
unknowns when that bullet was determined to be inconclusive using conventional
comparison microscopy.
264. DISCUSSION
One of the more obvious takeaways from the study was the time savings when
comparing the trial sets using conventional comparison microscopy versus using the
Quantum 3D Microscope. The VisionX is a well-designed comparison microscope with
three different lighting options and bullet holders allowing for ease of mounting and
orientation of bullets in near pristine condition. Even with this ease of bullet mounting
and alignment along with the good lighting conditions, the time spent performing the
comparisons on the VisionX was approximately 80 hours, that is 20 times more than the
time required to perform the comparisons on the Quantum 3D Microscope. While the
total number of hours was different for the second firearm examiner using the Leica
comparison microscope, the time-saving factor was similar using the Quantum 3D
Microscope.
One consideration that must be noted is the time required to acquire the bullets. In this
study, approximately 4.5 hours were needed to acquire the 24 bullets into the Quantum
3D Microscope. This should be added to the time spent by the examiners to perform the
comparisons (4 hours for the first examiner; 2 hours for the second examiner). However,
this is a task that can be assigned to a technician, leaving the firearm examiner free to
focus on the comparisons, a task for which they are uniquely and specially trained.
Furthermore, once acquired, the bullets do not need to be re-acquired every time
someone new wants to view the bullets. An analogy of this would be as if the bullets were
delivered to the examiner pre-mounted on the microscope with almost limitless lighting
conditions available. This allows for examinations to be repeated, unlike with
conventional comparison microscopy where different microscopes are used and with
which lighting conditions are difficult, if not impossible, to replicate.
It was physically and mentally taxing to perform the comparisons using conventional
comparison microscopy, and not only because of the number of hours involved. The
number of inconclusive results amplified this exhaustion which is a genuine concern
because ambiguous datasets combined with physical and mental tiredness can lead to
unintentional bias being introduced into the results. For example, there were instances
where some of the inconclusive results obtained with the VisionX microscope appeared
to be leaning toward a common source determination when in fact, they were fired from
different firearms. In other words, with the ambiguous datasets and fatigue, too much
significance was being ascribed to too little correspondence. An example of this is shown
in FIGURE 23.
27FIGURE 23: CORRESPONDENCE OBSERVED BETWEEN BULLETS FROM DIFFERENT SOURCES
Physical and mental fatigue is a very real issue with comparison microscopy. It must be
clear that the 80 hours spent on the VisionX and the 60 hours spent on the Leica
performing the comparisons were not continuous sessions. They were broken into
smaller segments to spread the work over the course of a full month.
No such fatigue was experienced while using the Quantum 3D Microscope which
provided an overall ease of comparison versus a conventional comparison microscope.
It is possible to compare two bullets (in 3D) without having seen the quantitative results,
but when the bullet pair is selected from the RBL graph, it is presented in the “best
match” position. This is generally the phase position examiners would find using
conventional comparison microscopy, and it highlights the land-engraved areas with the
highest similarity. With the Quantum 3D Microscope and its quantitative analysis, this
position was obtained within seconds as opposed to the many minutes required using
conventional comparison microscopy.
Once displayed on the screen, visual comparison is relatively straightforward. The 3D
images can be locked and manipulated as a pair, or they can be unlocked and
manipulated separately. While this can be performed on most modern current
conventional comparison microscopes, typically, finer adjustments are necessary.
Furthermore, once the 3D images are on the screen, lighting angle and intensity are
achieved with a simple movement of the mouse. When locked, it is the same for both
sides and no time is spent manually adjusting the lights. Movement of the mouse is
28continuous until optimal lighting is achieved. Lighting optimization can be quite time
consuming when using conventional comparison microscopy. Significant time and
energy are saved by using the Quantum 3D Microscope. In addition, it was discovered
that optimal lighting conditions for many samples would not be possible using the
VisionX in spite of its superior lighting options. FIGURE 24 shows a comparison of UNK-03
with TF-01-A with lighting coming from an 8 o’clock location.
FIGURE 24: UNK-03 WITH TF-01-A WITH LIGHTING AT 8 O’CLOCK
As mentioned previously, working with samples on the Quantum 3D Microscope
improved results believed to be inconclusive leaning towards an identification, when in
fact they were fired from different firearms. Additionally, several identifications were
achieved using the Quantum 3D Microscope that were inconclusive when using the Leica
comparison microscope. The Leica microscope is close to 30-years old and is believed to
be the average age of many microscopes in forensic science laboratories. Brand name
aside, older microscopes are limited and, as a result, may not always provide the
examiner with the best conditions to observe important details on the surface of bullets.
A unique advantage of the Quantum 3D Microscope is the ability to provide the courts
an answer to the question – “What is the probability that these two bullets were fired
from different firearms?” The courts have been asking this or similar questions for
decades, looking for quantified and objective answers, and these courts have become
increasingly displeased with the lack of answers. The Quantum 3D Microscope can
provide an answer. For example, as shown in FIGURE 25, one bullet pair had an FMR Index
of 10.71. This means that the probability that two bullets fired from a different firearm
would generate a higher similarity score is 1 over 1010.71 or approximately 1 in
51,000,000,000.
29Another innovation of the Quantum 3D Microscope provides FMR values using a
generalized method that is independent of bullet caliber and other characteristics,
meaning that different databases are not necessary to determine the False Match Rate.
FIGURE 25: FMR INDEX 10.71
Another advantage of the FMR is the confidence it provides the examiner when the
similarity score is low. When performing comparisons using a conventional comparison
microscope, one of the major concerns is unintentional bias when there is a weak
dataset. Examiners tend to spend a significant amount of time on such datasets, and it
is not unusual for examiners to observe what they believe is significant correspondence
only for it to be re-evaluated later and recognized as only incidental correspondence.
However, when bullets are accessed through the RBL Graph and there is no visible
correspondence (such as illustrated in FIGURE 26), an examiner can have confidence that
if the bullets are shown with their best similarity, the remaining surfaces of the bullets
are not likely to be of greater significance.
FIGURE 26: DIFFERENT SOURCE, UNK-08 AND UNK-16 – FMR INDEX:1.79
305. CONCLUSION
The Quantum 3D Microscope has a valid place in the modern forensic science laboratory,
and time efficiency is one of its major benefits. When considering time spent on bullet
acquisitions and comparisons, using Q3M was 9 to 10 times quicker than using a
Conventional Comparison Microscope (CCM). When factoring in the verification stage,
bullets no longer need to be mounted since acquisitions have already been performed.
Consequently, acquired bullets are available for verification as well as for any later
comparisons for current or future cases. Moreover, each Q3M acquisition is carefully
calibrated so that measurements are backed by certified reference targets. As a result,
a substantial amount of time is saved through this “acquire once, re-use often” process.
Image quality is another aspect to take into consideration. The second examiner was
able to conclude common source determinations using Q3M, when the same
comparisons resulted in inconclusive opinions while using the CCM. The first examiner
mentioned unachievable lighting conditions while using the CCM and stated that the
ease in comparisons alleviated potential bias concerns. The technology behind the
Quantum 3D Microscope provides much more information. This helps firearm examiners
make accurate common source determinations and have more confidence in
inconclusive results.
Q3M offers the courts what they have been looking for – a False Match Rate. Courts are
concerned with the reliability of examiners, especially when the certainty of a common
source determination cannot be articulated to their satisfaction. With Q3M, the courts
can be provided with a scientifically defensible False Match Rate (FMR) that the two
bullets were fired from different firearms. The RBL Graph also helps to graphically
illustrate the distinction between non-matching and matching conditions. This is in line
with the AFTE Theory of Identification and Range of Conclusions.
Even with the benefits of the Quantum 3D Microscope, the use of the CCM will continue
for years to come. One reason is that the identification criteria upon which examiners
draw their conclusions is based on a database of comparisons using CCM. Because Q3M
has more information upon which identification criteria can be based, examiners will
need to reassess their criteria for identification. Another reason for the coexistence of
CCM and Q3M is that some objects other than bullets may be too large to fit in the 3D
microscope. This is especially true when handling toolmarks from larger items and casts
of marks recovered from firearm crime scenes.
The use of 3D microscopy, especially with objective results such as those provided by the
Quantum 3D Microscope, has significant benefits for case work. It will also be a valuable
tool for other studies, as well as for training, because it makes the sharing of data and
the replication of datasets quite easy.
This study was based on the initial capabilities of this technology, and Ultra Forensic
Technology is already at work on additional innovations that will expand the value of 3D
microscopy for firearm and toolmark identification.
31Innovating Today for a Safer Tomorrow
www.ultra-forensictechnology.com
32You can also read