Noninvasive Skin Barrier Assessment: Multiparametric Approach and Pilot Study - MDPI
←
→
Page content transcription
If your browser does not render page correctly, please read the page content below
cosmetics
Article
Noninvasive Skin Barrier Assessment:
Multiparametric Approach and Pilot Study
Jade G. M. Logger § , Jill I. Olydam § , Wietske Woliner-van der Weg            and Piet E. J. van Erp *
 Department of Dermatology, Radboud University Medical Center, PO Box 9101, 6500 HB Nijmegen,
 The Netherlands; Jade.Logger@radboudumc.nl (J.G.M.L.); Jill.Olydam@radboudumc.nl (J.I.O.);
 Wietske.Woliner-vanderWeg@radboudumc.nl (W.W.-v.d.W.)
 * Correspondence: Piet.vanErp@radboudumc.nl; Tel.: +31-24-36-13548; Fax: +31-24-35122
 § Both authors contributed equally to this work.

 Received: 8 February 2019; Accepted: 13 March 2019; Published: 15 March 2019

 Abstract: The epidermal barrier function is disrupted in various inflammatory skin diseases.
 Accurate methods to measure skin barrier function are needed to assess the effect of therapeutic
 agents. Therefore, we developed a noninvasive multiparametric approach to measure four different
 parameters regarding the skin barrier. In the current pilot study, we evaluate this method in 14
 healthy volunteers. We assessed erythema, transepidermal water loss (TEWL), water content, and
 epidermal thickness at both cheeks before and 30 min after application of Lanette and Vaseline-Lanette
 cream. For this, we used spectrophotometry, the Aquaflux device, the Epsilon device, and reflection
 confocal microscopy, respectively. Stratum corneum (SC) thickness was significantly increased after
 application of both creams (p < 0.05), and this increase was larger after Lanette cream compared to
 after Vaseline-Lanette cream (p = 0.035). Erythema, TEWL, and water content did not significantly
 change after cream application. Our multiparametric approach is promising and offers a feasible
 and practical way to quickly obtain multifaceted information about skin barrier function. Further
 exploration of this approach after prolonged use of cream and in conditions of disrupted skin barrier
 are recommended areas for future research.

 Keywords: skin barrier; water content; transepidermal water loss; spectrophotometry; reflectance
 confocal microscopy; Aquaflux; Epsilon

1. Introduction
      The skin barrier acts as a first-order shield to protect the human body against micro-organisms,
ultraviolet (UV) light, and mechanical injury, and also helps regulate temperature and water flux [1,2].
It is predominantly formed by the outermost layer of human epithelial cells, the stratum corneum
(SC) [3]. The skin barrier function is disrupted in inflammatory skin diseases like rosacea and atopic
dermatitis [4–10]. An impaired skin barrier is characterized by increased transepidermal water
loss (TEWL) and reduced epidermal hydration, and predisposes one to cutaneous inflammation [2].
Conversely, skin moisturizers can improve the skin barrier and help prevent inflammation [2,9,11–14].
However, not all moisturizers are beneficial to the skin barrier, and, for unknown reasons, some topical
ointments may exacerbate symptoms in inflammatory skin disease [15,16].
      The skin barrier function is most often assessed using methods that quantify water content and
TEWL. Unfortunately, these are single-device methods that measure only one or a few parameters,
while a multiparametric approach is preferred to better assess subtle features of skin damage and
restoration in the very complex environment of the skin. In order to better understand the mechanisms
of skin therapeutic agents, accurate, objective, and reliable methods to measure skin barrier function
are needed. In addition to water content and TEWL, other skin parameters may influence skin barrier

Cosmetics 2019, 6, 20; doi:10.3390/cosmetics6010020                         www.mdpi.com/journal/cosmetics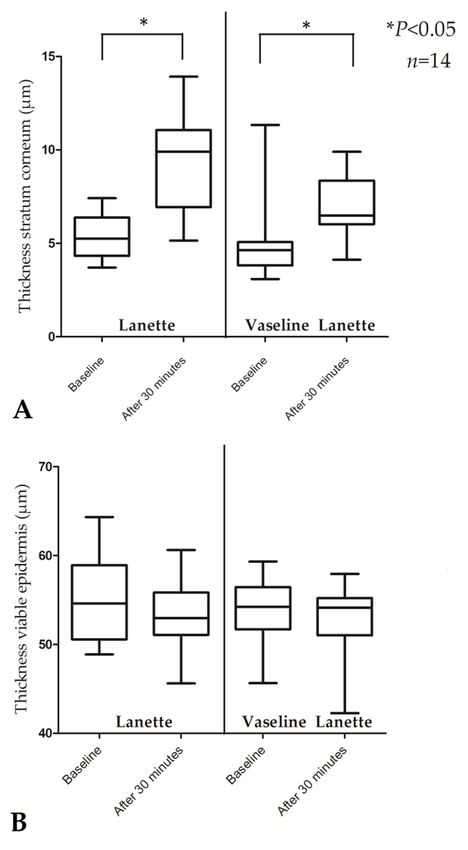
Cosmetics 2019, 6, 20                                                                                         2 of 11

function, such as natural moisturizing factor (NMF), SC thickness, dermal vasodilatation (erythema),
intracellular lipids, and pH [2,4,15]. A wide array of noninvasive biophysical and imaging methods
are available to assess most of these parameters [17]. In the current pilot study, we demonstrate the
feasibility of combining a quartet of biophysical/imaging devices to measure the following four skin
parameters noninvasively: erythema, TEWL, water content, and epidermal thickness. These four skin
parameters were selected for their ability to be measured in the face and for their practical use. To the
best of our knowledge, this combination of parameters was never previously studied in skin barrier
assessment. We quantify these parameters before and after the application of two different creams.

2. Materials and Methods

2.1. Study Subjects
      Fourteen healthy Caucasian volunteers (12 women and two men; mean age, 24 years; range,
21–26 years) with skin types I to III were included in the study after providing written informed
consent. The study was approved by the local medical ethics committee and conducted according
to the principles of the Declaration of Helsinki. Measurements were performed in October 2018 at
the department of Dermatology, Radboud University Medical Center, Nijmegen, the Netherlands.
The following exclusion criteria were adopted: age < 18 years, signs of skin disease at measurement
sites, known hypersensitivity reaction to Vaseline/Lanette cream, use of immunosuppressive
medication, or a diagnosis of inflammatory skin disease. Subjects did not use cream, body lotion,
make-up, or perfume on the day of measurements and refrained from physical exercise within three
hours before measurements.

2.2. Products
    We applied two widely used vehicles that are able to penetrate the skin within 30 min: Lanette
cream and Vaseline-Lanette cream (Table 1).

                                  Table 1. Ingredients of investigational products.

                        Product                Ingredients (in Order of Percentage of Cream Content)
                                                   Purified water, decyloleate, cetostearyl alcohol, B
                Lanette cream I FNA
                                                       emulsifying, sorbitol solution, sorbic acid
                                                Cetostearyl alcohol, B emulsifying, cetiol V, sorbic acid,
           Vaseline-Lanette cream FNA
                                             sorbitol solution, white petrolatum (vaseline), purified water
                                   FNA: Formularium der Nederlandse Apothekers.

2.3. Study Procedures and Technical Device Specifications
      Measurements of the four skin barrier parameters (erythema, TEWL, water content, and SC and
epidermal thickness) were performed on both cheeks. Firstly, measurement locations were demarcated
with a surgical pen (Figure 1). Table 2 shows a detailed overview of the measurement principles of the
four devices used to measure the skin barrier parameters. Facial skin was acclimatized to the ambient
air for at least 10 min before the start of the measurements, and room temperature and air humidity
were kept constant at 20–23 ◦ C and 38–55%, respectively. Volunteers were laid down in supine position
during the acclimatization period and measurement period to prevent possible orthostatic interactions.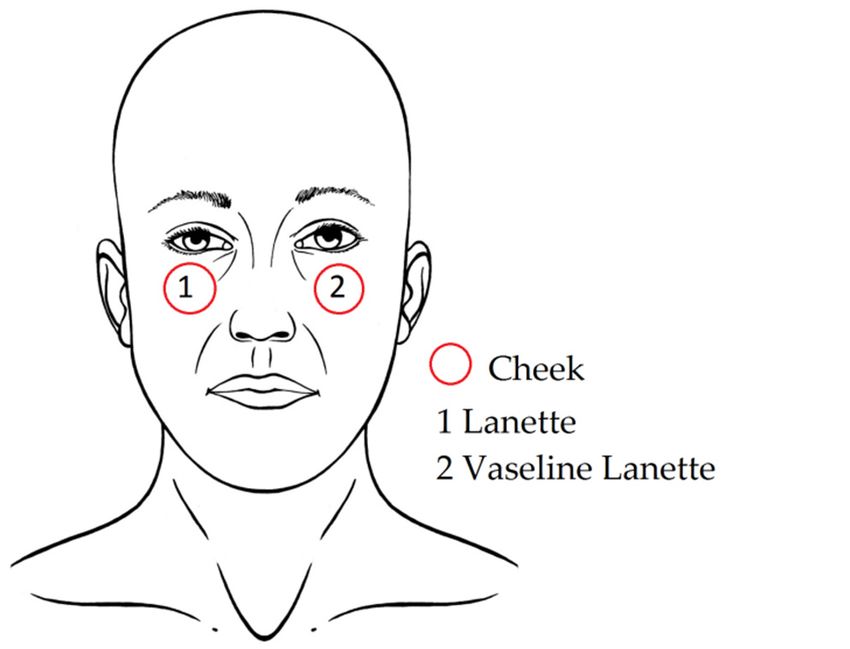
Cosmetics 2019, 6, 20                                                                                                                                                    3 of 11

                                          Table 2. Overview of the four devices used for the skin barrier function measurements.

               Device
                                              Measurement Principle                                        Output                          Measurement Time   References
       Skin Parameter Assessed
                                        Intense white light from a xenon lamp is       Color expressed as L*a*b color space. This is a
                                    emitted by a probe. The device is placed onto      three-dimensional coordinate system with an
                                       the skin. The color of the reflected light is    L*axis (brightness) and two orthogonal axes
     Spectrophotometer (Konica         analyzed by three photocells filtering the         representing chromaticity, namely a*axis
                                                                                                                                                 1.5 s         [17–19]
       CM-2600d) Erythema           primary colors (blue: 450 nm, green: 550 nm,            (red-green) and b*axis (yellow-blue).
                                      red: 610 nm). This allows measurement of         The a* value from the measurement locations is
                                     the absorbance and reflectance spectrum in        obtained after repeated calibration on a white
                                                 the 400–700-nm range.                  surface before each measuring session (0.00).
                                    A probe consisting of a closed chamber with
                                          a condenser and sensors for relative
                                      temperature and humidity is applied onto
        Aquaflux (Biox) TEWL                                                               Flux density of water vapor (g/m2 /h).             Max. 180 s       [20–22]
                                          the skin surface. The flux of vapor is
                                    calculated due to increasing temperature and
                                                     humidity rate.
                                                                                         Calibrated dielectric permittivity (ε) through
                                     A probe consisting of 76,800 sensors with a         the SC. Moreover, capacitive contact images
                                    sensing area of 1.3 cm × 1.5 cm, a resolution           can be obtained (brighter color = higher
     Epsilon (Biox) Water content   of 50 µm, and a measurement depth of 20 µm              dielectric constant; darker color = lower            30 s          [23–25]
                                        is placed onto the skin. The electrical         dielectric constant) for skin surface hydration
                                    capacitance of the skin surface is calculated.          mapping, taking skin relief and variable
                                                                                           distribution of sweat glands into account.
                                                                                             Black and white images showing skin
                                                                                                           morphology.
                                    Laser light at 830 nm is focused onto the skin
                                                                                                             Options:
                                     with maximum imaging depth of 200 µm
                                                                                                - VivaCam: dermoscopic image.
                                    below skin surface (papillary dermis). Due to
                                                                                         - Confocal: basic image of 500 µm × 500 µm.
        Reflectance Confocal        different refractive indexes between the cell
                                                                                       - VivaBlock: multiple confocals acquired at the
    Microscope (VivaScope 1500)      structures and the surrounding tissue, en                                                                 2–3 min        [17,26,27]
                                                                                           same level, stitched together to create one
    Thickness of SC and epidermis       face images at 30× magnification of
                                                                                              larger image (max. 8 mm × 8 mm).
                                     morphological and cellular resolution are
                                                                                       - VivaStack: multiple confocals along depth at a
                                     obtained. Horizontal resolution: 0.5–1 µm,
                                                                                        certain location, with interval steps of 3–5 µm.
                                             vertical resolution: 3–5 µm.
                                                                                            - Movie: e.g., to view blood flow in the
                                                                                                        superficial dermis.
                                                              SC, stratum corneum; TEWL, transepidermal water loss.
Cosmetics 2019, 6, 20 4 of 11
Cosmetics 2019, 6, x FOR PEER REVIEW 3 of 11
Figure
Figure 1. Measurement
1. Measurement locations
locations for erythema,
for erythema, transepidermal
transepidermal water
water loss loss (TWLE),
(TWLE), water and
water content, content,
skin and skin thickness
thickness per cheek.
per cheek.
Firstly, erythema
Table 2.was measured
Overview of thewith a spectrophotometer
four devices used for the skin(CM-2600d, Konica
barrier function Minolta, Ramsey,
measurements.
NJ, USA). Using the principle of diffuse reflectance spectroscopy, light absorption from primary
Device
chromophores in the skin (melanin, oxyhemoglobin, and deoxy-hemoglobin) was measured Measurement[19].
Skin parameter Measurement principle Output References
Before each measuring session, calibration to a standard white plate provided with the meter time was
assessed
performed. After pressing the calibrate button, three calibration measurements were automatically
taken. Next, three Intense white light on
measurements from a cheek
each Color
wereexpressed
taken; theas L*a*b
devicecolor
was lifted and gently
reapplied between xenon
eachlamp is emitted
recording. Thebyaverage
a space.
of theThis is consecutive
three a three-dimensional
erythema measurements
was automatically probe. The device
calculated by theisdevice. coordinatehead
placedThe measuring systemwaswith
keptansteady
L*axisand perpendicular
onto the skin. The color of the (brightness) and two orthogonal
to the skin surface with very light pressure against the skin during measurements to prevent minor
venous congestion. reflected
Morelight is analyzed
detailed by
information axes representing
about measurementchromaticity,
requirements can be found in
Spectrophotometer
Fullerton et al. three
[18]. photocells filtering the namely a*axis (red-green) and
(Konica CM-2600d) 1.5 s [17–19]
Next, TEWL primary colors (blue:
was measured with450 nm,
the b*axis (yellow-blue).
Aquaflux (AF200, Biox, London, UK). After calibration,
Erythema
three measurements green:per550 nm,were
cheek red: 610 nm). with standard
performed The a* settings
value fromandthe
a maximum measurement
time of 180 s. The average of the three measurements per cheek side is
This allows measurement of measurement locations was calculated. Also,
the Aquaflux devicethe absorbance
was keptand reflectance
steady obtained after
and perpendicular repeated
to the calibration
skin surface with very light skin
pressure during spectrum
measurements.in the 400–700-nm on a white surface before each
range. measuring session (0.00).
Thirdly, water content was determined by performing one measurement per cheek with the
A probe consisting of a closed
Epsilon (E100, Biox, London, UK), a new-generation corneometer. Compared to conventional
chamber with a condenser and
single-sensor corneometers, the Epsilon contains 76,800 sensors; thus, multiple measurements take
sensors for relative
place at once [25]. Moreover, analysis software is integrated into the device, and water-content-based
Aquaflux (Biox) temperature and humidity is Flux density of water vapor
images can be obtained. The burst mode option was used with a 5-s measurement delay after Max.first
180skin
s [20–22]
TEWL applied onto the skin surface. (g/m2/h).
contact to rule out initial variation in skin occlusion. A frame interval of 1 s and a total measurement
The flux of vapor is calculated
window of 30 s was selected. To keep contact with the skin surface, moderate pressure was applied.
due to increasing temperature
Lastly, the reflectance confocal microscope (RCM; Vivascope 1500, Mavig, Munich, Germany) was
and humidity rate.
used to determine skin thickness. For each cheek, one dermoscopic image (VivaCam) was obtained
Calibrated dielectric permittivity
and used as map. Next, five vertical mappings (VivaStacks) were performed at the center and at
A probe consisting of 76,800 (ɛ) through the SC. Moreover,
the four outer corners of the image (Figure 2). Series of images of 0.5 mm × 0.5 mm were obtained,
sensors with a sensing area of capacitive contact images can be
starting from the skin surface up to a depth of 100 µm with interval steps of 3 µm. With a standardized
1.3 cm × 1.5 cm, a resolution of obtained (brighter color = higher
protocol (Figure S1, Supplementary Materials) all VivaStack images were evaluated by one researcher
Epsilon
50 µm, and a measurement dielectric constant; darker color =
to determine thickness of the SC and the viable epidermis (without SC).
(Biox) 30 s [23–25]
depth of 20 µm is placed onto lower dielectric constant) for skin
Water content
the skin. The electrical surface hydration mapping,
capacitance of the skin surface taking skin relief and variable
is calculated. distribution of sweat glands into
account.
Reflectance Laser light at 830 nm is focused Black and white images showing 2–3 min [17,26,27]Cosmetics 2019, 6, 20 5 of 11
Cosmetics 2019, 6, x FOR PEER REVIEW 5 of 11
Figure
Figure 2. Dermoscopic
2. Dermoscopic image
image of of
thethe cheek
cheek made
made using
using thethe reflectance
reflectance confocal
confocal microscope.
microscope. TheThe
redred
dots
dots show
show thethe exact
exact locations
locations were
were thethe VivaStacks
VivaStacks were
were performed.
performed.
After
Afterbaseline
baselinemeasurements,
measurements,the theLanette
Lanettecream
creamwas wasapplied
appliedto to thethe
right cheek,
right cheek,andand thethe
Vaseline-Lanette cream
Vaseline-Lanette cream was applied
was to to
applied thethe
leftleft
cheek
cheek(Figure 1).1).
(Figure OneOne finger-tip unit
finger-tip (FTU)
unit of of
(FTU) cream
cream
was used
was usedperper
cheek side,side,
cheek according to thetofinger-tip
according method
the finger-tip [28]. One
method [28].FTU
Onecorresponds to 0.5 g.toAfter
FTU corresponds 0.5 g.
30After
min, the
30 creams
min, thewere completely
creams were absorbed
completely intoabsorbed
the skin, into
and all
theskin parameter
skin, and all measurements
skin parameter
(erythema, TEWL,(erythema,
measurements water content, and epidermal
TEWL, thickness)
water content, and were repeated
epidermal as described
thickness) were above.
repeated as
described above.
2.4. Analysis
2.4.Burst
Analysis
mode values from the Epsilon measurements were used to create regression functions,
and intersections with the
Burst mode values y-axis
from were calculated.
the Epsilon measurementsStatistical analysis
were used was regression
to create performedfunctions,
with SPSS and
(SPSS statistics 25,
intersections withIBM
theCorporation, Armonk, NY,
y-axis were calculated. USA). Possible
Statistical analysis baseline differences
was performed withofSPSS
the skin
(SPSS
barrier parameters
statistics 25, IBM between the right
Corporation, and left
Armonk, NY,cheek
USA).were explored
Possible withdifferences
baseline the Wilcoxon signed-rank
of the skin barrier
test. The Wilcoxon signed-rank test was also used to demonstrate significant
parameters between the right and left cheek were explored with the Wilcoxon signed-rankdifferences between
test. The
skin barrier parameters before and after application of both creams. A relationship between
Wilcoxon signed-rank test was also used to demonstrate significant differences between skin barrier the skin
parameters and environmental factors was investigated using Spearman’s correlation. For
parameters before and after application of both creams. A relationship between the skin parametersthe results,
p-values below 0.05 were
and environmental considered
factors significant.using Spearman’s correlation. For the results, p-values
was investigated
below 0.05 were considered significant.
3. Results
3. Results
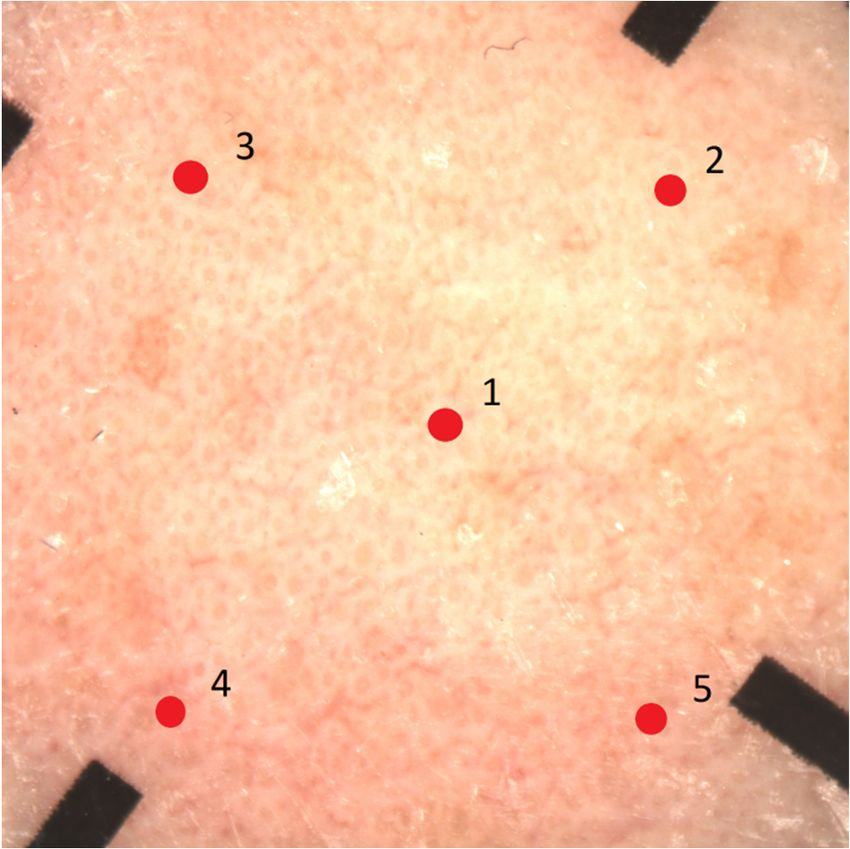
Compared to baseline, the thickness of the SC increased significantly after application of both
creams (p < 0.05, Figure 3 and Table 3). The absolute difference of the SC thickness before and after
Compared to baseline, the thickness of the SC increased significantly after application of both
application was significantly larger for Lanette cream compared to Vaseline-Lanette cream (p = 0.035).
creams (p < 0.05, Figure 3 and Table 3). The absolute difference of the SC thickness before and after
Figure 4 showswas
application no morphological changes
significantly larger for of corneocytes
Lanette creamincompared
the SC after
to cream application cream
Vaseline-Lanette with the(p =
RCM. Erythema,
0.035). Figure 4TEWL,
shows water content, andchanges
no morphological thicknessofof the viable epidermis
corneocytes did not
in the SC after significantly
cream application
change
with after application
the RCM. of Lanette
Erythema, TEWL, cream andcontent,
water Vaseline-Lanette cream.
and thickness ofAdditionally, relatively did
the viable epidermis largenot
interindividual variations
significantly change among
after skin parameters
application of Lanette were seen.and
cream Values of all skin parameters
Vaseline-Lanette at baseline
cream. Additionally,
compared
relatively large interindividual variations among skin parameters were seen. Values Table
to 30 min after cream application per subject are displayed in Figure S2 and of all S1
skin
(Supplementary Materials). No significant differences in median baseline values of
parameters at baseline compared to 30 min after cream application per subject are displayed erythema, TEWL,in
water content,
Figure andTable
S2 and thickness of the SC and the
S1 (Supplementary viable epidermis
Materials). were found
No significant betweenin
differences themedian
right and left
baseline
cheek among subjects (p > 0.050 for all values).
values of erythema, TEWL, water content, and thickness of the SC and the viable epidermis were
found between the right and left cheek among subjects (p > 0.050 for all values).Cosmetics 2019, 6, 20 6 of 11
Table 3. Skin parameters measured at baseline and at 30 min after cream application.
Skin Parameter Lanette Vaseline-Lanette
Baseline 30 min after cream application p-Value Baseline 30 minafter cream application p-Value
Erythema (a*) 48.40 (46.20–50.80) § 48.00 (46.10–50.60) 0.362 47.95 (44.60–49.80) 48.05 (43.20–49.80) 0.965
TEWL (g/m2 /h) 19.28 (14.05–25.31) 19.09 (15.87–26.71) 0.363 18.81 (13.67–27.22) 19.00 (14.61–24.54) 0.300
Water content (ε) 20.16 (14.86–33.94) 23.29 (15.89–28.33) 0.730 21.11 (16.31–47.02) 21.79 (14.03–40.02) 0.363
Thickness SC (µm) 5.25 (3.71–7.42) 9.90 (5.15–13.92) 0.001 * 4.64 (3.09–11.34) 6.49 (4.12–9.90) 0.016 *
Thickness viable
54.59 (48.86–64.32) 52.96 (45.61–60.61) 0.551 54.22 (45.64–59.31) 54.12 (42.26–57.91) 0.638
epidermis (µm)
§ Median (range). * p < 0.05 (baseline vs. 30 min after cream application).Cosmetics 2019,
Cosmetics 2019, 6,
6, 20
x FOR PEER REVIEW 77 of 11
of 11
Cosmetics 2019, 6, x FOR PEER REVIEW 7 of 11
Figure 3.
Figure 3. Thickness
Thickness ofof stratum
stratum corneum
corneum (A)
(A) and
and viable
viable epidermis
epidermis (B)
(B) measured
measured by
by the
the reflectance
reflectance
Figure
confocal3.microscope
Thickness ofat stratum
baseline corneum
and 30 (A)after
min andcream
viableapplication.
epidermis Values
(B) measured
are by the as
expressed reflectance
medians
confocal microscope at baseline and 30 min after cream application. Values are expressed as medians
confocal microscope
with interquartile at
interquartile rangesbaseline
rangesand and
and ranges 30 min after cream
ranges(minimum–maximum).
(minimum–maximum). application. Values are expressed as medians
with
with interquartile ranges and ranges (minimum–maximum).
Figure 4.
Figure 4. Representative
Representative reflectance
reflectance confocal
confocal microscopy
microscopy images
images of
of the
the stratum
stratum corneum
corneum at
at baseline
baseline
Figure
(A) and
(A) 4.
and 30 Representative
30 min
min after reflectance
after cream confocal
cream application
application (B).
(B). microscopy images of the stratum corneum at baseline
(A) and 30 min after cream application (B).
4. Discussion
4. DiscussionCosmetics 2019, 6, 20 8 of 11
There were no significant relationships between the four skin parameters. Additionally,
no biologically relevant correlations between the skin parameters and environmental factors were
found (data not shown).
4. Discussion
This is the first study that combines the noninvasive measurements of erythema, TEWL,
water content, and epidermal thickness to assess the effects of indifferent creams on the healthy
skin barrier. Cream application did not affect erythema, TEWL, and water content 30 min after
application on the cheeks, but did lead to increased SC thickness. The four modalities used in this
study (spectrophotometer, Aquaflux, Epsilon, RCM) can monitor the same facial skin location over time
without discomfort, damage, or alteration. All devices are portable and easy to use, and measurements
are painless and rapid (15 min total).
To measure TEWL, we used the Aquaflux, a condenser closed-chamber system. Earlier research
showed that this chamber system is the most sensitive TEWL system, allowing continuous
measurements, and is the least vulnerable to environmental influences [21,29]. However, some
drawbacks have to be taken into account. The device glides easily on the skin during measurements;
manual fixation is recommended, which we did. Start-up time including calibration takes relatively
long (15 min); thus, this should be prepared before measurements. Additionally, repeated
measurements on exactly the same location are challenging due to the small probe. This might
have resulted in small intraindividual variations, because TEWL values can vary between facial
areas [30–32].
Water content was measured with the Epsilon, a state-of-the-art corneometer using multi-sensor
skin mapping technology with correction for skin occlusive effects [24,25]. The sensing depth of the
Epsilon is restricted to the less hydrated SC, in contrast to earlier model conventional corneometers
that measure the deeper, more hydrated epidermis [32,33]; this potentially leads to more accurate water
content values. The Epsilon showed significant variations in water content at different anatomical
skin locations [25]; however, the size of the probe head (ca. 4 cm × 3 cm) restricts measurements to
non-recessed body parts.
Lastly, epidermal thickness was assessed using RCM. The images with cellular resolution
allow very detailed measurements of the epidermal layer [27]. Earlier work showed very good
correspondence of RCM and histology for epidermal thickness measurements [34]. Limitations for
use in daily practice are the high device cost and limited imaging depth, as imaging resolution
decreases substantially below 150 µm (superficial dermis). In addition, measuring facial skin may be
challenging. The transition from epidermis to dermis differs from other anatomical locations; in facial
skin, interpapillary processes do not or barely exist due to sun exposure, and the dermal–epidermal
junction is low refractive in skin types I/II because of limited melanin content in the basal layer [35,36].
Therefore, knowledge about skin morphology is recommended for evaluation of the images. Of all
imaging tools, RCM is superior for noninvasive skin thickness measurements. Possible alternatives are
high-frequency ultrasound, near-infrared spectroscopy, optical coherence tomography, or Raman
spectroscopy; however, these devices have lower resolution and are also expensive [17,37–39].
Moreover, they may not all be suitable for facial imaging due to their size (e.g., Raman spectroscopy).
It is already known that the application of moisturizers increases SC thickness, probably due
to the absorption of water (indicating increased water-binding capacity), corneocyte swelling, or
reorganization in the lipid bilayer [15,40,41]. Surprisingly, we did not measure increased water content
after cream application. Moreover, the RCM images showed no morphological changes of corneocytes
in the SC after cream application. This suggests that increased SC thickness in our study may not
be due to increased hydration or corneocyte swelling, but rather due to cream components other
than water [24]. Alternatively, it could be that we did not find increased SC water content because
water may have diffused into deeper layers of the epidermis in the 30 min after cream application,Cosmetics 2019, 6, 20 9 of 11
or it could be that repeated use of moisturizers is needed to significantly increase epidermal water
content [14,15,40,42–44].
Given the explorative design, our study consisted of a small number of young volunteers with
female predominance. It would be interesting to investigate our method with prolonged use of topical
creams in a larger population, at various facial locations and to include an untreated reference area.
Moreover, measurements in subjects after controlled skin barrier perturbation (e.g. tape-stripping [21])
or in patients with disturbed skin barrier function could provide more insight into the effect of
cream application. It would also be interesting to expand our method with other skin-barrier-related
parameters (sebum, pH).
In conclusion, we combined the noninvasive measurements of erythema, TEWL, water content,
and epidermal thickness to assess the effect of different creams on the healthy facial skin barrier.
Cream application did not affect erythema, TEWL, and water content, but did lead to increased
SC thickness. Our multiparametric approach is promising and offers a feasible and practical way
to quickly obtain multifaceted information about skin barrier function. Further exploration of this
approach after prolonged use of cream and in conditions of disrupted skin barriers are recommended
areas for future research.
Supplementary Materials: The following are available online at http://www.mdpi.com/2079-9284/6/1/20/s1:
Figure S1: Protocol used for VivaStack evaluation to determine thickness of the stratum corneum (SC) and
epidermis with reflectance confocal microscopy (adapted from Ardigo et al. [26]), with examples to distinguish the
boundaries between the different skin layers. The central part of the images was used to determine the transition
of the different skin layers, to rule out variation in depth (skin layers) within the images; Figure S2, Table S1:
Differences in erythema, transepidermal water loss, water content, and skin thickness between baseline and
30 min after cream application per volunteer.
Author Contributions: Conceptualization, J.G.M.L. and P.E.J.v.E.; formal analysis, J.G.M.L. and J.I.O.;
investigation, J.I.O.; methodology, J.G.M.L., J.I.O., and P.E.J.v.E.; project administration, J.G.M.L., W.W.-v.d.W.,
and P.E.J.v.E.; supervision, J.G.M.L., W.W.-v.d.W., and P.E.J.v.E.; validation, J.G.M.L., J.I.O., W.W.-v.d.W., and
P.E.J.v.E.; visualization, J.G.M.L. and J.I.O.; writing—original draft, J.G.M.L. and J.I.O.; writing—review and
editing, J.G.M.L., J.I.O., W.W.-v.d.W., and P.E.J.v.E.
Funding: This research received no external funding.
Conflicts of Interest: The authors declare no conflicts of interest.
Abbreviations
FTU Finger-tip unit
NMF Natural moisturizing factor
RCM Reflectance confocal microscope
SC Stratum corneum
TEWL Transepidermal water loss
References
1. Yousef, H.; Sharma, S. Anatomy, Skin (Integument), Epidermis. In StatPearls. Treasure Island (FL); StatPearls
Publishing LLC.: St. Petersburg, FA, USA, 2018.
2. Loden, M. Role of topical emollients and moisturizers in the treatment of dry skin barrier disorders. Am. J.
Clin. Dermatol. 2003, 4, 771–788. [CrossRef] [PubMed]
3. Rawlings, A.V.; Harding, C.R. Moisturization and skin barrier function. Dermatol. Ther. 2004, 17 (Suppl. 1),
43–48. [CrossRef] [PubMed]
4. Addor, F.A. Skin barrier in rosacea. Anais Brasileiros de Dermatologia 2016, 91, 59–63. [CrossRef] [PubMed]
5. Two, A.M.; Wu, W.; Gallo, R.L.; Hata, T.R. Rosacea: Part I. Introduction, categorization, histology,
pathogenesis, and risk factors. J. Am. Acad. Dermatol. 2015, 72, 749–758. [CrossRef] [PubMed]
6. Woo, Y.R.; Lim, J.H.; Cho, D.H.; Park, H.J. Rosacea: Molecular Mechanisms and Management of a Chronic
Cutaneous Inflammatory Condition. Int. J. Mol. Sci. 2016, 17, 1562. [CrossRef] [PubMed]
7. Addor, F.A.; Aoki, V. Skin barrier in atopic dermatitis. Anais Brasileiros de Dermatologia 2010, 85, 184–194.
[CrossRef] [PubMed]Cosmetics 2019, 6, 20 10 of 11
8. Dirschka, T.; Tronnier, H.; Folster-Holst, R. Epithelial barrier function and atopic diathesis in rosacea and
perioral dermatitis. Br. J. Dermatol. 2004, 150, 1136–1141. [CrossRef] [PubMed]
9. Tsakok, T.; Woolf, R.; Smith, C.H.; Weidinger, S.; Flohr, C. Atopic dermatitis: The skin barrier and beyond.
Br. J. Dermatol. 2019, 180, 464–474. [CrossRef] [PubMed]
10. Elias, P.M. Primary role of barrier dysfunction in the pathogenesis of atopic dermatitis. Exp. Dermatol. 2018,
27, 847–851. [CrossRef] [PubMed]
11. Levin, J.; Miller, R. A Guide to the Ingredients and Potential Benefits of Over-the-Counter Cleansers and
Moisturizers for Rosacea Patients. J. Clin. Aesthet. Dermatol. 2011, 4, 31–49. [PubMed]
12. Hon, K.L.; Kung, J.S.C.; Ng, W.G.G.; Leung, T.F. Emollient treatment of atopic dermatitis: Latest evidence
and clinical considerations. Drugs Context 2018, 7, 212530. [CrossRef] [PubMed]
13. Moss, J. The effect of 3 moisturisers on skin surface hydration: Electrical conductance (Skicon-200),
capacitance (Corneometer CM420), and transepidermal water loss (TEWL). Skin Res. Technol. 1996, 2,
32–36. [CrossRef] [PubMed]
14. Young, D.L.; Chakravarthy, D. A controlled laboratory comparison of 4 topical skin creams moisturizing
capability on human subjects. J. Wound Ostomy Cont. Nurs. 2014, 41, 168–174. [CrossRef] [PubMed]
15. Loden, M. Effect of moisturizers on epidermal barrier function. Clin. Dermatol. 2012, 30, 286–296. [CrossRef]
[PubMed]
16. Elias, P.M.; Wakefield, J.S.; Man, M.Q. Moisturizers versus Current and Next-Generation Barrier Repair
Therapy for the Management of Atopic Dermatitis. Skin Pharmacol. Physiol. 2019, 32, 1–7. [CrossRef]
[PubMed]
17. van Erp, P.E.J.; Peppelman, M.; Falcone, D. Noninvasive analysis and minimally invasive in vivo
experimental challenges of the skin barrier. Exp. Dermatol. 2018, 27, 867–875. [CrossRef] [PubMed]
18. Fullerton, A.; Fischer, T.; Lahti, A.; Wilhelm, K.P.; Takiwaki, H.; Serup, J. Guidelines for measurement of
skin colour and erythema. A report from the Standardization Group of the European Society of Contact
Dermatitis. Contact Dermat. 1996, 35, 1–10. [CrossRef]
19. Stamatas, G.N.; Zmudzka, B.Z.; Kollias, N.; Beer, J.Z. Non-invasive measurements of skin pigmentation in
situ. Pigment Cell Res. 2004, 17, 618–626. [CrossRef] [PubMed]
20. Imhof, R.E.; De Jesus, M.E.; Xiao, P.; Ciortea, L.I.; Berg, E.P. Closed-chamber transepidermal water loss
measurement: Microclimate, calibration and performance. Int. J. Cosmet. Sci. 2009, 31, 97–118. [CrossRef]
[PubMed]
21. Alexander, H.; Brown, S.; Danby, S.; Flohr, C. Research Techniques Made Simple: Transepidermal Water Loss
Measurement as a Research Tool. J. Investig. Dermatol. 2018, 138, 2295–3000.e1. [CrossRef] [PubMed]
22. Pinnagoda, J.; Tupker, R.A.; Agner, T.; Serup, J. Guidelines for transepidermal water loss (TEWL)
measurement. A report from the Standardization Group of the European Society of Contact Dermatitis.
Contact Dermat. 1990, 22, 164–178. [CrossRef]
23. Imhof, B. Stratum corneum hydration measurement using capacitance contact imaging. Presented at the
COMET 2017, Cergy Pontoise, France, 6–7 June 2017.
24. Zhang, X.; Bontozoglou, C.; Chirikhina, E.; Lane, M.; Xiao, P. Capacitive Imaging for Skin Characterizations
and Solvent Penetration Measurements. Cosmetics 2018, 5, 52. [CrossRef]
25. Logger, J.G.M.; Munchhoff, C.U.; Olydam, J.I.; Peppelman, M.; Van Erp, P.E.J. Anatomical site variation of
water content in human skin measured by the Epsilon: A pilot study. Skin Res. Technol. 2019. [CrossRef]
[PubMed]
26. Ardigo, M.; Longo, C.; Gonzalez, S. Multicentre study on inflammatory skin diseases from The International
Confocal Working Group: Specific confocal microscopy features and an algorithmic method of diagnosis. Br.
J. Dermatol. 2016, 175, 364–374. [CrossRef] [PubMed]
27. Levine, A.; Markowitz, O. Introduction to reflectance confocal microscopy and its use in clinical practice.
JAAD Case Rep. 2018, 4, 1014–1023. [CrossRef] [PubMed]
28. Finlay, A.Y.; Edwards, P.H.; Harding, K.G. “Fingertip unit” in dermatology. Lancet 1989, 2, 155. [CrossRef]
29. Farahmand, S.; Tien, L.; Hui, X.; Maibach, H.I. Measuring transepidermal water loss: A comparative in vivo
study of condenser-chamber, unventilated-chamber and open-chamber systems. Skin Res. Technol. 2009, 15,
392–398. [CrossRef] [PubMed]Cosmetics 2019, 6, 20 11 of 11
30. Voegeli, R.; Rawlings, A.V.; Seroul, P.; Summers, B. A novel continuous colour mapping approach for
visualization of facial skin hydration and transepidermal water loss for four ethnic groups. Int. J. Cosmet. Sci.
2015, 37, 595–605. [CrossRef] [PubMed]
31. Marrakchi, S.; Maibach, H.I. Biophysical parameters of skin: Map of human face, regional, and age-related
differences. Contact Dermat. 2007, 57, 28–34. [CrossRef] [PubMed]
32. Wa, C.V.; Maibach, H.I. Mapping the human face: Biophysical properties. Skin Res. Technol. 2010, 16, 38–54.
[CrossRef] [PubMed]
33. Tagami, H. Location-related differences in structure and function of the stratum corneum with special
emphasis on those of the facial skin. Int. J. Cosmet. Sci. 2008, 30, 413–434. [CrossRef] [PubMed]
34. Peppelman, M.; Wolberink, E.A.; Gerritsen, M.J.; van de Kerkhof, P.C.; van Erp, P.E. Application of
leukotriene B4 and reflectance confocal microscopy as a noninvasive in vivo model to study the dynamics of
skin inflammation. Skin Res. Technol. 2015, 21, 232–240. [CrossRef] [PubMed]
35. Robertson, K.; Rees, J.L. Variation in epidermal morphology in human skin at different body sites as
measured by reflectance confocal microscopy. Acta Derm. Venereol. 2010, 90, 368–373. [PubMed]
36. Puig, S.C.C.; Lovato, L. Reflectance Confocal Microscopy for Skin Diseases; Springer: Berlin/Hedelberg, Germany,
2012.
37. Van Mulder, T.J.; de Koeijer, M.; Theeten, H.; Willems, D.; Van Damme, P.; Demolder, M.; De Meyer, G.;
Beyers, K.C.; Vankerckhoven, V. High frequency ultrasound to assess skin thickness in healthy adults. Vaccine
2017, 35, 1810–1815. [CrossRef] [PubMed]
38. Miyamae, Y.; Kawabata, M.; Yamakawa, Y.; Tsuchiya, J.; Ozaki, Y. Non-Invasive Estimation of Skin Thickness
by near Infrared Diffuse Reflection Spectroscopy—Separate Determination of Epidermis and Dermis
Thickness. J. Near Infrared Spectrosc. 2012, 20, 617–622. [CrossRef]
39. Pena, A.; Arronte, M.; De Posada, E.; Ponce, L.; Flores, T. Non-invasive optical method for epidermal
thickness estimation. OnLine J. Biol. Sci. 2014, 14, 163–166.
40. Crowther, J.M.; Sieg, A.; Blenkiron, P.; Marcott, C.; Matts, P.J.; Kaczvinsky, J.R.; Rawlings, A.V. Measuring
the effects of topical moisturizers on changes in stratum corneum thickness, water gradients and hydration
in vivo. Br. J. Dermatol. 2008, 159, 567–577. [PubMed]
41. Manfredini, M.; Mazzaglia, G.; Ciardo, S.; Simonazzi, S.; Farnetani, F.; Longo, C.; Pellacani, G. Does skin
hydration influence keratinocyte biology? In vivo evaluation of microscopic skin changes induced by
moisturizers by means of reflectance confocal microscopy. Skin Res. Technol. 2013, 19, 299–307. [PubMed]
42. Nolan, K.; Marmur, E. Moisturizers: Reality and the skin benefits. Dermatol. Ther. 2012, 25, 229–233.
[CrossRef] [PubMed]
43. Constantin, M.M.; Poenaru, E.; Poenaru, C.; Constantin, T. Skin Hydration Assessment through Modern
Non-Invasive Bioengineering Technologies. Maedica (Buchar) 2014, 9, 33–38. [PubMed]
44. Pierre, J.; Francois, G.; Benize, A.M.; Rubert, V.; Coutet, J.; Flament, F. Mapping, in vivo, the uniformity of
two skin properties alongside the human face by a 3D virtual approach. Int. J. Cosmet. Sci. 2018, 40, 482–487.
[CrossRef] [PubMed]
© 2019 by the authors. Licensee MDPI, Basel, Switzerland. This article is an open access
article distributed under the terms and conditions of the Creative Commons Attribution
(CC BY) license (http://creativecommons.org/licenses/by/4.0/).You can also read