Large Day-to-Day Variability of Extreme Air Temperatures in Poland and Its Dependency on Atmospheric Circulation
←
→
Page content transcription
If your browser does not render page correctly, please read the page content below
atmosphere

Article
Large Day-to-Day Variability of Extreme Air Temperatures in
Poland and Its Dependency on Atmospheric Circulation
Katarzyna Szyga-Pluta

                                           Department of Meteorology and Climatology, Adam Mickiewicz University in Poznań, ul. Krygowskiego 10,
                                           61–680 Poznań, Poland; pluta@amu.edu.pl

                                           Abstract: The primary purpose of the study was the determination of the spatial day-to-day vari-
                                           ability of extreme air temperatures in Poland and the dependency of large temperature changes on
                                           atmospheric circulation in accordance with the Grosswetterlagen (GWL) classification. The goal
                                           was achieved based on data from 1966 to 2015, made available by the Institute of Meteorology and
                                           Water Management—National Research Institute. Day-to-day changes in maximum and minimum
                                           air temperatures were designated with a rate of ≥6 ◦ C (large) and with a rate of ≥12 ◦ C (very large)
                                           and their spatial distribution was presented. Finally, the analysis of the dependency of considerable
                                           temperature changes on atmospheric circulation in accordance with the Grosswetterlagen (GWL)
                                           classification was conducted. The obtained results showed that in Poland in the period 1966–2015
                                           there was a statistically significant increase in the number of large changes in both Tmax and Tmin.
                                           The number of large changes in Tmax increases from north to south, and the number of large
                                           changes in Tmin from north to east and south of Poland indicate the range of the effect of marine
                                           and continental properties on the climate of Poland and the influence of local relief as well as the
                                           atmospheric circulation impact. Large changes in Tmax occur more frequently in spring and in
                                           Tmin in winter. Large changes in Tmax and Tmin are mainly recorded during cyclonic circulation,
                                 however, the anticyclonic circulation types favour especially large decreases in Tmin.


Citation: Szyga-Pluta, K. Large            Keywords: air temperature extremes; day-to-day variability; large changes; circulation types;
Day-to-Day Variability of Extreme          Grosswetterlagen; Poland
Air Temperatures in Poland and Its
Dependency on Atmospheric
Circulation. Atmosphere 2021, 12, 80.
https://doi.org/10.3390/                   1. Introduction
atmos12010080
                                                The observed contemporary climate warming is visible in the increase of the average
                                           global air temperature [1]. In the majority of cases, changes in mean daily air temperature
Received: 15 December 2020
                                           are relatively low and rarely interrupted with high temperature increases [2]. Together
Accepted: 31 December 2020
                                           with climate change, the values of minimum and maximum temperatures also increase.
Published: 7 January 2021
                                           These result in day-to-day variability of maximum and minimum air temperatures. It is
Publisher’s Note: MDPI stays neu-
                                           also worth emphasizing that variations in minimum temperatures are usually greater than
tral with regard to jurisdictional clai-   those in maximum temperatures [3,4]. The variability of such changes in a year is probably
ms in published maps and institutio-       uneven. Air temperature is largely generated by circulation factors [2,5]. The greatest
nal affiliations.                          day-to-day changes in temperature are related to the North Atlantic Oscillation (NAO).
                                           The intense NAO is related to the lowest minimum temperature in winter, spring and over
                                           the whole year, and the highest maximum temperature is higher than usual in autumn and
                                           winter during the years in which the NAO was strong [6]. Notwithstanding this, higher
Copyright: © 2021 by the author. Li-       values of the NAO index are usually related not only to higher temperatures but also to
censee MDPI, Basel, Switzerland.
                                           lower day-to-day variability [3]. It was pointed out that extreme values of air temperature
This article is an open access article
                                           are associated with anticyclonic circulation and strong highs blocking the zonal circulation,
distributed under the terms and con-
                                           which in recent decades have been increasingly occurring over Europe, and are of particular
ditions of the Creative Commons At-
                                           importance [7–9].
tribution (CC BY) license (https://
                                                Analyses of trends in the period 1880–1998 [10] show that the variability of the spatial
creativecommons.org/licenses/by/
4.0/).
                                           distribution of day-to-day temperature changes was subject to the following changes: a 5%

Atmosphere 2021, 12, 80. https://doi.org/10.3390/atmos12010080                                         https://www.mdpi.com/journal/atmosphere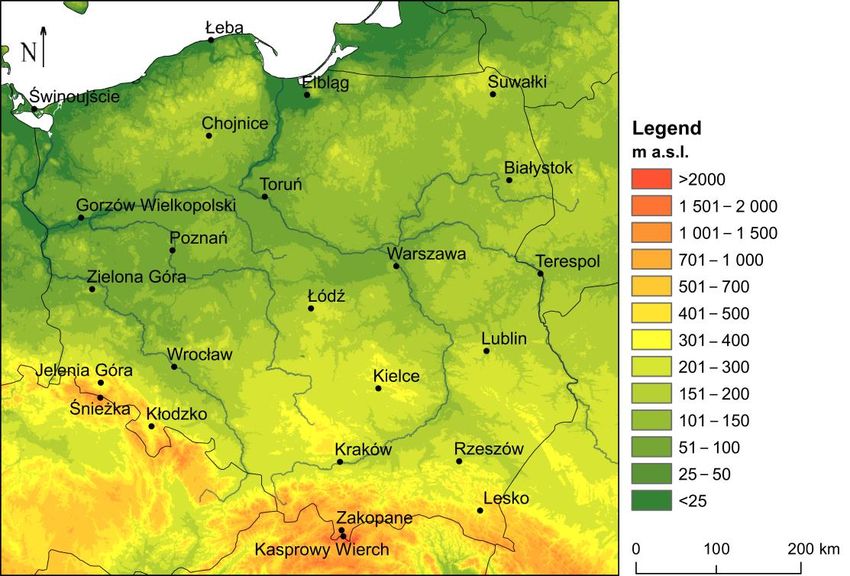
Atmosphere 2021, 12, 80                                                                                           2 of 20

                          increase occurred in south-western Europe, a change of 0 to −5% in the north-west, and a
                          decrease by 5 to 10% in north-eastern Europe. Very large day-to-day changes in temperature
                          are forecasted to occur increasingly frequently in summer [11]. The effects of climate change
                          can depend more on the change in the minimum (Tmin) or maximum air temperature
                          (Tmax) than mean temperature [12]. Otherwise, the effect of precipitation deficit on an
                          increase in extreme values of daily temperature amplitude has been observed [13]. Studies
                          of temperature and cloud cover indicate a strong relationship of a temperature increase
                          in Europe with a decrease in cloudiness [14]. In addition, several studies showed the
                          dependence of mid-latitude cloud radiative properties on temperature e.g., [15,16]. Clouds
                          and aerosols continue to contribute the largest uncertainty to estimates and interpretations
                          of the Earth’s changing energy budget [17]. The changes of atmospheric circulation in
                          Europe during 1981–2014 were accompanied generally by a reduction of the total cloud
                          cover over the continent, and this leads to an overall increase of the shortwave incoming
                          radiation at continental scale causing a possible increase of air temperature [18].
                                Day-to-day temperature variability is of significance not only as an important char-
                          acteristic of climate dynamics. Changes in mean daily temperature are on average lower
                          than those in the case of extreme air temperatures [19,20]. The decrease in the diurnal
                          temperature range is approximately equal to the increase in mean temperature [21]. It is
                          also interesting from a practical point of view. Substantial temperature fluctuations are
                          unfavourable for the well-being of man, showing an irritating effect [22], and can have
                          a negative impact on many areas of the economy, e.g., rapid cooling in spring can cause
                          freeze damage of plants, and rapid warming can lead to fast snowmelt resulting in flood
                          threat [22–25].
                                Fewer studies in the climatological literature are devoted to the day-to-day variability
                          of maximum and/or minimum air temperature e.g., [6,20,26–31] compared to the number
                          of studies concerning the mean temperature interdiurnal variations (ITV) or diurnal tem-
                          perature range (DTR) e.g., [3,10,11,25,32,33]. Additionally, the occurrence and changes of
                          extreme air temperature values should be discussed in the context of circulation conditions,
                          because atmospheric circulation is considered one of the most important factors influencing
                          weather and climate conditions in mean latitudes [34,35].
                                Bearing the aforementioned in mind, the knowledge of the probability and conditions
                          of occurrence of considerable temperature changes are of particular importance, especially
                          in the case of the impact on human well-being and the economy. The main objective of
                          the research was the determination of the spatial day-to-day variability of extreme air
                          temperatures in Poland and its circulation conditions. The implementation of the primary
                          study objective covers the determination of the spatial and multiannual variability of
                          changes in extreme air temperature: maximum (Tmax) and minimum (Tmin) from day to
                          day in the period 1966–2015, and the designation of cases of large (≥6 ◦ C) and very large
                          (≥12 ◦ C) increases and decreases in extreme temperatures in particular months, years,
                          and throughout the multiannual period. Particular attention was paid to the analysis of
                          the impact of atmospheric circulation on the occurrence of large changes in extreme air
                          temperature (Tmax and Tmin).

                          2. Materials and Methods
                               The analysis was based on meteorological data from 24 stations in Poland (Figure 1) be-
                          longing to the observation network of the Institute of Meteorology and Water Management—
                          National Research Institute (IMGW-PIB). The analysis covered the period 1966–2015.
                               The calculations were based on daily values of maximum and minimum air tem-
                          perature. A day-to-day change in maximum temperature (∆Tmax) was calculated as the
                          difference between maximum temperature on a given day and the preceding day. A day-to-
                          day change in minimum temperature was determined analogically (∆Tmin). The absolute
                          values of the changes were taken into account when calculating the mean annual day-to-day
                          changes. Day-to-day changes in maximum and minimum air temperatures were desig-
                          nated with a rate of ≥6 ◦ C, in the paper described as large, and those with a rate of ≥12 ◦ C,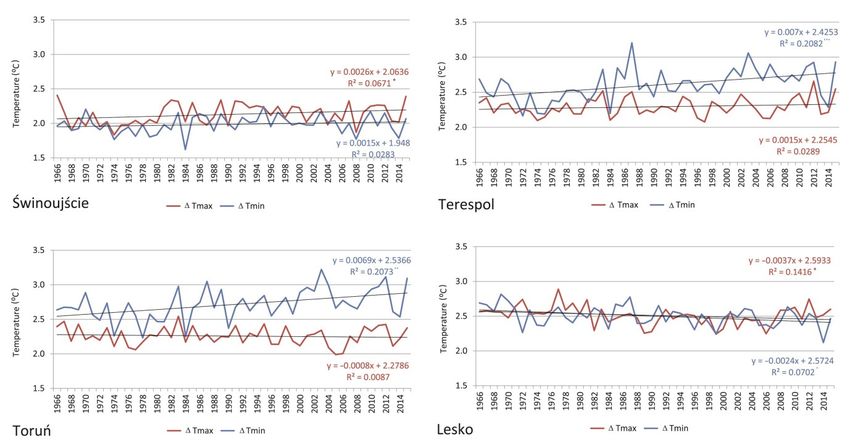
Atmosphere 2021, 12, 80 3 of 20
described as very large. These thresholds are considered for the area of Poland as having a
negative impact on people [22]. Day-to-day changes in air temperature of more than 6 ◦ C
have an irritating effect on the human organism (classification by Bajbakova et al. [22]),
and changes of more than 12 ◦ C are described as severe [22]. The number of positive
and negative changes were determined for Tmax (∆Tmax↑, ∆Tmax↓) and Tmin (Tmin↑,
Tmin↓), as well as their occurrence in particular months and years in the analysed period.
Trends of multiannual changes in temperature increases and decreases were determined,
as well as their statistical significance. The determination of the trend of values averaged
for the territory of Poland employed a 5-day moving average. The statistical assessment
of changes applied a nonparametric Mann-Kendall test, and their statistical significance
was
Atmosphere 2021, 12, x FOR PEER REVIEWassessed by means of the Sen method [36]. The spatial distribution of large changes3 ofin20
extreme air temperatures was presented in maps.
Figure1.1.Locations
Figure Locationsofofthe
theanalysed
analysedstations
stationsininPoland.
Poland.
Thenext
The calculations werethe
stage involved based on of
analysis daily values of maximum
the dependency and minimum
of considerable temperature air
temperature.
changes on theAatmospheric
day-to-day circulation
change in maximum temperature
in accordance with the (Grosswetterlagen
ΔTmax) was calculated (GWL)as
the difference
classification between
[37] maximum
(Table 1). temperature on afocuses
The “Grosswetterlagen” given day and theatmospheric
on similar preceding day. pro-A
day-to-day
cesses change
in a larger in minimum
area, e.g., Europe.temperature
The firstwas determined
calendar analogically
of European (ΔTmin). The
Grosswetterlagen
absolute values
comprised 21 GWL. ofBaur’s
the changes were taken
initial concept into account
was further developed whenand calculating
extended tothe mean
29 GWL
annual day-to-day changes. Day-to-day changes in maximum
in the following decades by Hess and Brezowsky [38], therefore, it is also known under and minimum air
temperatures
their name. Later were designated
updates werewith a rate by
published of ≥6 °C, in the paper
Gerstengarbe described
and Werner as Its
[39]. large, and
devel-
those with
opment a ratethe
involved of ≥12
use °C, described
of surface as very
synoptic large.
maps andThese thresholds
geopotential are considered
height charts at thefor
500
thehPa
arealevel, with consideration
of Poland of direction
as having a negative of air
impact onflow and[22].
people location of pressure
Day-to-day systems.
changes in air
Atemperature
total of 30 circulation
of more typesthan were
6 °Cdistinguished and additionally
have an irritating effect on grouped
the human in Grosswet-
organism
tertypen (GWT)by
(classification byBajbakova
air mass advection [39].
et al. [22]), andThe objective
changes method
of more thanfor12classifying synopticas
°C are described
weather
severe regimes
[22]. Theover Europe
number ofand the North
positive and East Atlantic,
negative basedwere
changes closely on the widely
determined for used
Tmax
(ΔTmax↑, ΔTmax↓) and Tmin (͉Tmin↑, ͉Tmin↓), as well as their occurrence in particular
Grosswetterlagen (GWL) series of Hess and Brezowsky, was constructed by James [37],
inmonths
which aandpattern
yearscorrelation technique
in the analysed is used
period. to find
Trends the best matching
of multiannual changes types from a set
in temperature
ofincreases
pre-defined
andpatterns
decreases representing the respective
were determined, GWLs.
as well as their statistical significance. The
determination of the trend of values averaged for the territory of Poland employed a
5-day moving average. The statistical assessment of changes applied a nonparametric
Mann-Kendall test, and their statistical significance was assessed by means of the Sen
method [36]. The spatial distribution of large changes in extreme air temperatures was
presented in maps.
The next stage involved the analysis of the dependency of considerable temperature
changes on the atmospheric circulation in accordance with the Grosswetterlagen (GWL)
classification [37] (Table 1). The “Grosswetterlagen” focuses on similar atmospheric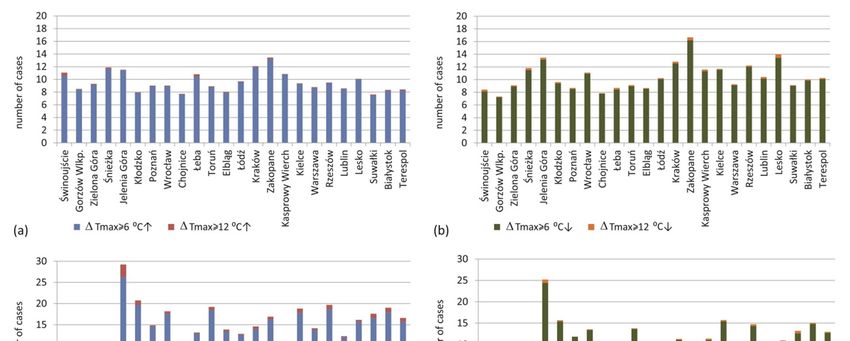
Atmosphere 2021, 12, 80                                                                                                           4 of 20

                Table 1. Definitions of the circulation types (GWT) and the atmospheric circulation patterns (GWL) [37].

   Circulation Type (Grosswettertype; GWT)              Symbol         Atmospheric Circulation Patterns (Grosswetterlage; GWL)
                                                          HB                                British Isles High
                                                         HNA                         Norwegian Sea High, anticyclonic
                                                         HNZ                          Norwegian Sea High, cyclonic
                          North
                                                          NA                          North Circulation, anticyclonic
                                                          NZ                           North Circulation, cyclonic
                                                         TRM                             Central Europe Trough
                                                         NEA                        Northeast Circulation, anticyclonic
                      Northeast
                                                         NEZ                         Northeast Circulation, cyclonic
                                                        HFA                        Fennoscandian High, anticyclonic
                                                         HFZ                         Fennoscandian High, cyclonic
                          East
                                                        HNFA                 Norwegian Sea/Fennoscandia High, anticyclonic
                                                        HNFZ                  Norwegian Sea/Fennoscandia High, cyclonic
                                                         SEA                        Southeast Circulation, anticyclonic
                      Southeast
                                                         SEZ                          Southeast Circulation, cyclonic
                                                          SA                          South Circulation, anticyclonic
                                                          SZ                            South Circulation, cyclonic
                          South
                                                          TB                                British Isles Low
                                                         TRW                             Western Europe Trough
                                                         SWA                        Southwest Circulation, anticyclonic
                      Southwest
                                                         SWZ                          Southwest Circulation, cyclonic
                                                         WA                            West Circulation, anticyclonic
                                                         WS                             West Circulation, cyclonic
                          West
                                                         WZ                             Southern West Circulation
                                                         WW                              Angled West Circulation
                                                         NWA                        Northwest Circulation, anticyclonic
                      Northwest
                                                         NWZ                         Northwest Circulation, cyclonic
                                                          HM                              Central European High
                Central Europe High
                                                          BM                              Central European Ridge
                Central Europe Low                        TM                              Central European Low
                                                           U                                     Undefined

                                         Since such circulation biases are hard to assimilate easily when 29 types are used,
                                   the GWLs were concatenated into a small set of basic circulation types representing west-
                                   erly, northerly, easterly, southerly, central, and cyclonic or anticyclonic circulation types,
                                   respectively (Table 2). Mixed types are grouped into both adjacent circulation types with
                                   half-weighting, respectively (e.g., northerly and westerly in the case of NWZ). In all cases,
                                   the circulation type definition is based on the character of circulation over Central Eu-
                                   rope [37]. Developed for central Europe (Germany), the GWL concept works well for a
                                   much larger region, covering all of Europe [40]. The typology has been used in numerous
                                   papers investigating Central Europe [23,41–47].

                    Table 2. Definition of the circulation types and their associated atmospheric circulation patterns.

 Circulation                                                   Associated Grosswetterlagen
    Type                                                Full Weight                                                 Half Weight
 Westerly         WA, WZ, WS, WW                                                                              SWA, SWZ, NWA, NWZ
 Northerly        NA, NZ, HNA, HNZ, HB, TRM                                                                   NWA, NWZ, NEA, NEZ
 Easterly         HFA, HFZ, HNFA, HNFZ                                                                        SEA, SEZ, NEA, NEZ
 Southerly        SA, SZ, TB, TRW                                                                             SWA, SWZ, SEA, SEZ
 Central          HM, BM, TM
 Cyclonic         WZ, WS, WW, SWZ, NWZ, TM, NZ, HNZ, TRM, NEZ, HFZ, HNFZ, SEZ, SZ, TB, TRW
 Anticyclonic     WA, SWA, NWA, HM, BM, NA, HNA, HB, NEA, HFA, HNFA, SEA, SA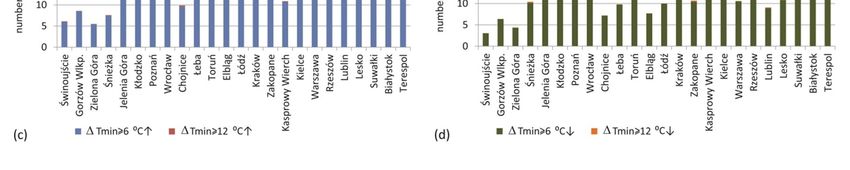
Atmosphere 2021, 12, 80                                                                                            5 of 20

                               In this research, to eliminate individual cases occurring in the few stations, only these
                          cases were analysed when large changes in extreme air temperature values occurred at
                          least in 20% of the stations. The frequency of occurrence of GWL circulation types in the
                          years 1966–2015 was calculated, as well as the probability of occurrence of large day-to-
                          day changes in Tmax and Tmin in particular atmospheric circulation patterns (GWL) of
                          particular circulation types (GWT).

                          3. Results
                          3.1. Mean Annual Day-to-Day Changes of Tmax and Tmin
                                 In the analysed period 1966–2015, the mean annual absolute values of the day-to-day
                          changes in Tmax and Tmin in Poland were 2.3 ◦ C and 2.5 ◦ C, respectively, and showed
                          spatial variability (Figure 2). Mean day-to-day changes in Tmax increased from the north to
                          the south of the country and ranged from 2.1 ◦ C in the Baltic Sea coast (Łeba, Świnoujście),
                          to 2.7 ◦ C at the foothill of Tatra Mountains (Zakopane). In the coastal region, day-to-day
                          air temperature changes are the least considerable as a manifestation of the mitigating
                          effect of the sea on the climate, as confirmed by earlier studies [27]. Mean absolute changes
                          in Tmin were lowest in the western part of Poland and increased south- and eastwards
                          generally except for the central-eastern area, which is characterised by rather lower values.
                          They varied from 2.0 ◦ C in the western parts of the Polish coastline (Świnoujście) and
                          Wielkopolska Lowland (Zielona Góra) to 3.2 ◦ C in the valley at the foot of the Sudetes
                          (Jelenia Góra). The higher day-to-day variability in east than in the west of Poland is
                          due to the maritime and continental air masses range influence, which manifests itself in
                          increasing thermal continentalism towards the east of the country. According to Kossowska-
                          Cezak [19], a very rapid change in thermal conditions in the lowland area of Poland is
                          caused by the advection of air masses and the inflow of air from over a thermally contrasting
                          surface. The high values of day-to-day changes at the foothills are due the effect of the
                          mountain ranges causing the local air circulation.
                                 Mean absolute day-to-day change in Tmax in Poland was the most considerable in
                          1983, reaching 2.5 ◦ C, and the lowest in 1974, reaching 2.0 ◦ C. In the analysed multiannual
                          period, the highest number of stations with the highest mean day-to-day change in Tmax,
                          i.e., 10 out of 24 of the analysed stations, was recorded in 1983. Nineteen-seventy-four
                          and 2005 were the years with the highest number of stations (5 out of 24 stations) with the
                          lowest mean day-to-day change in Tmax.
                                 Mean absolute day-to-day change in Tmin in Poland was the highest in 2012, reaching
                          3.2 ◦ C, and the lowest, reaching 2.2 ◦ C, in 1972. In 1987, the highest number of stations
                          was characterised by the highest mean day-to-day change in Tmax–5 out of 24 stations.
                          The lowest mean of the discussed changes in Tmin occurred in 1974 (8 stations out of 24).
                                 In the years 1966–2015, the number of considerable changes in both Tmax and Tmin
                          increased in Poland, although the variability shows spatial differentiation, and the changes
                          are statistically significant only in some of the stations. Mean changes for the entire country
                          showed a statistically significant increase in changes in extreme temperatures at a level of
                          0.001 (Figure 3).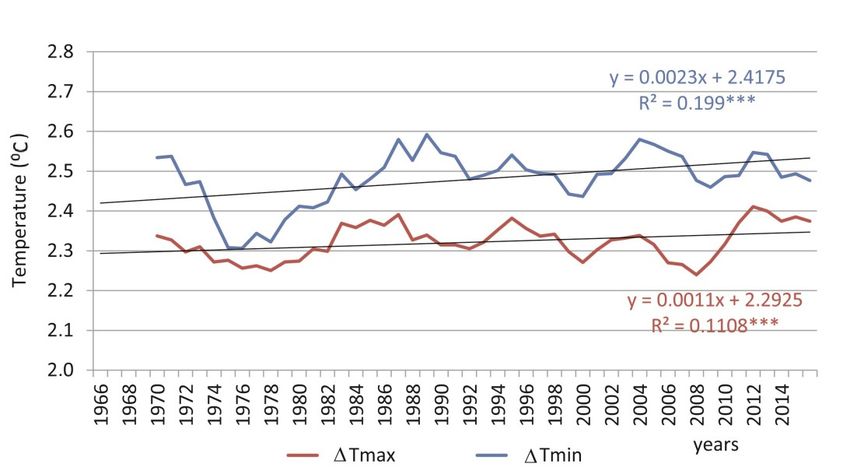
Atmosphere 2021, 12, 80                                                                                                       6 of 20
Atmosphere 2021, 12, x FOR PEER REVIEW                                                                                       6 of 20
                                                 (a)                                                             (b)

                Figure 2. Average annual day-to-day changes of Tmax (a) and Tmin (b) in Poland in the years 1966–2015.

                                                    Mean absolute day-to-day change in Tmax in Poland was the most con
                                              1983, reaching 2.5 °C, and the lowest in 1974, reaching 2.0 °C. In the analysed m
                                              period, the highest number of stations with the highest mean day-to-day chan
                                              i.e., 10 out of 24 of the analysed stations, was recorded in 1983. Nineteen-s
                                              and 2005 were the years with the highest number of stations (5 out of 24 statio
                                              lowest mean day-to-day change in Tmax.
                                                    Mean absolute day-to-day change in Tmin in Poland was the high
                                              reaching 3.2 °C, and the lowest, reaching 2.2 °C, in 1972. In 1987, the highes
                                              stations was characterised by the highest mean day-to-day change in Tmax
                                              stations. The lowest mean of the discussed changes in Tmin occurred in 197
                                              out of 24).
                                                    In the years 1966–2015, the number of considerable changes in both Tma
                                              increased in Poland, although the variability shows spatial differentiatio
                                              changes are statistically significant only in some of the stations. Mean chan
                                   (a)        entire country showed a statistically significant
                                                                                      (b)       increase in changes in extrem
                                              tures at a level of 0.001 (Figure 3).
             Figure 2. Average annual day-to-day changes of Tmax (a) and Tmin (b) in Poland in the years 1966–2015.
     Figure 2. Average annual day-to-day changes of Tmax (a) and Tmin (b) in Poland in the years 1966–2015.

                                      Mean absolute day-to-day change in Tmax in Poland was the most considerable in
                                1983, reaching 2.5 °C, and the lowest in 1974, reaching 2.0 °C. In the analysed multiannual
                                period, the highest number of stations with the highest mean day-to-day change in Tmax,
                                i.e., 10 out of 24 of the analysed stations, was recorded in 1983. Nineteen-seventy-four
                                and 2005 were the years with the highest number of stations (5 out of 24 stations) with the
                                lowest mean day-to-day change in Tmax.
                                      Mean absolute day-to-day change in Tmin in Poland was the highest in 2012,
                                reaching 3.2 °C, and the lowest, reaching 2.2 °C, in 1972. In 1987, the highest number of
                                stations was characterised by the highest mean day-to-day change in Tmax–5 out of 24
                                stations. The lowest mean of the discussed changes in Tmin occurred in 1974 (8 stations
                                out of 24).
                                      In the years 1966–2015, the number of considerable changes in both Tmax and Tmin
                                increased in Poland, although the variability shows spatial differentiation, and the
                                changes are statistically significant only in some of the stations. Mean changes for the
                                entire country showed a statistically significant increase in changes in extreme tempera-
                                tures at a level of 0.001 (Figure 3).

                                 Figure 3. Fluctuation of 5-year moving mean of day-by-day Tmax and Tmin changes in Poland in
                                 the years 1966–2015. (Explanation: *** p < 0.001).

                                       Most of the analysed stations (16 out of 24) showed a mean absolute changes increase
                                 in both Tmax and Tmin (Figure 4). A similar trend of changes was earlier found in north-
                                 eastern Poland—the direction of trends in the analysed stations was variable as Panfil [28]
                                 stated. However, only in Warsaw (p < 0.05), Świnoujście and Białystok (p < 0.1) this trend
                                 is statistically significant in the case of Tmax. Similarly, according to previous research [29],
                                 trends of multiannual changes in Olsztyn showed statistically significant increases and
                                 decreases only for Tmax. In the case of Tmin, a statistically significant increasing trend is
                                 typical mainly in the center of the country, e.g., Łódź (p < 0.01) and Terespol (p < 0.001) in the
                                 eastern part. In the Carpathian foothills, a decrease in these changes in the range of Tmax
                                 and Tmin are observed e.g., Lesko. In turn, a few stations, e.g., Toruń, are characterised by
                                 a negative tendency of changes in Tmax and positive in Tmin (p < 0.01).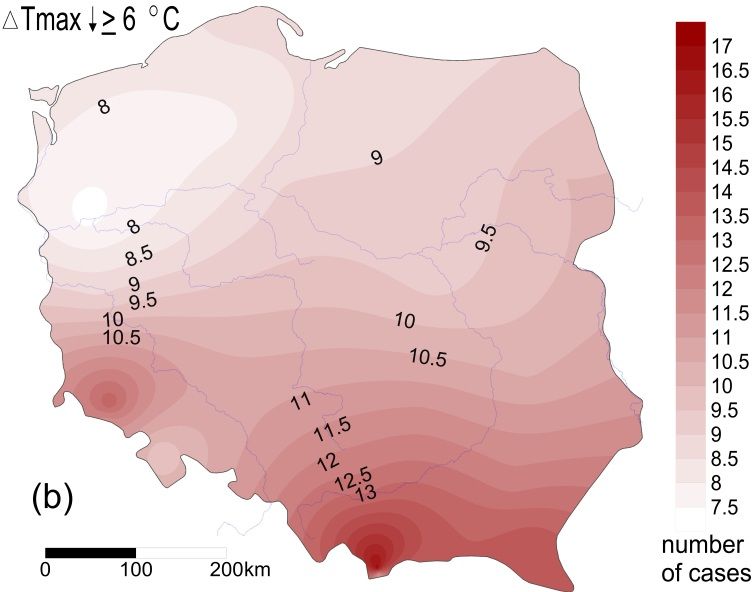
research [29], trends of multiannual changes in Olsztyn showed statistically significant
                                      increases and decreases only for Tmax. In the case of Tmin, a statistically significant in-
                                      creasing trend is typical mainly in the center of the country, e.g., Łódź (p < 0.01) and Te-
                                      respol (p < 0.001) in the eastern part. In the Carpathian foothills, a decrease in these
                                      changes in the range of Tmax and Tmin are observed e.g., Lesko. In turn, a few stations,
Atmosphere 2021, 12, 80                                                                                                      7 of 20
                                      e.g., Toruń, are characterised by a negative tendency of changes in Tmax and positive in
                                      Tmin (p < 0.01).

      Figure 4.
      Figure  4. Annual
                 Annualmean    day-by-day∆Tmax
                          meanday-by-day       ΔTmaxand   and∆Tmin
                                                                ΔTmin      course
                                                                        course   in in  selected
                                                                                     selected     stations
                                                                                               stations    in Poland
                                                                                                        in Poland     in the
                                                                                                                  in the     years
                                                                                                                          years    1966–2015
                                                                                                                                1966–2015 withwith
                                                                                                                                               the
      the trend
      trend lineslines (Explanations:
                   (Explanations: + p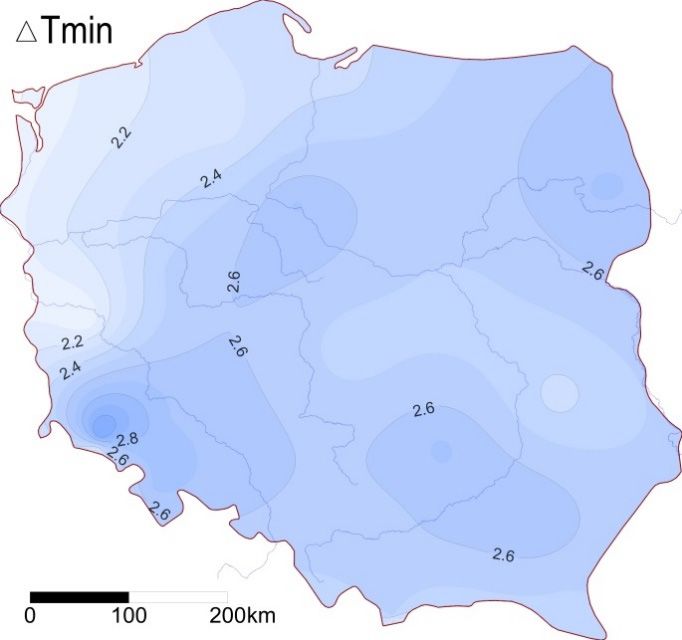
average 252 times in a year, and their number increased from the north-east to the
                                  south-west of the country. They most commonly occurred in the foothills of the Sudetes
                                  and the Carpathians (more than 12), and most seldom in north-western Poland (below 8)
                                  (Figures 5b and 6b). Very large increases in maximum air temperature (ΔTmax↑ >12 °C)
Atmosphere 2021, 12, 80           are very rare: up to 0.5 cases annually in Świnoujście and occasional occurrences in8 cen-
                                                                                                                        of 20
                                  tral Poland (Figures 5c and 6c). Very large decreases in Tmax (ΔTmax↓ >12 °C) were also
                                  infrequent: up to 0.5 cases/year at the Carpathian foothills (Figures 5d and 6d).

      Figure 5. Mean annual number of cases of large and very large day-to-day increase (↑; (a,b)) and decrease (↓; (c,d)) in Tmax
      Figure 5. Mean annual number of cases of large and very large day-to-day increase (↑; (a,b)) and decrease (↓; (c,d)) in
      and Tmin in Poland in years 1966–2015 (stations ordered according to their longitude).
      Tmax and Tmin in Poland in years 1966–2015 (stations ordered according to their longitude).

                                        Decreases
                                        The   spatialindiversity
                                                         large changes   inconsiderable
                                                                    of the                   ↓ ≥ 6 ◦ C) were
                                                                             Tmax (∆Tmaxday-to-day             recordedtemperature
                                                                                                           maximum        in Poland onchanges
                                                                                                                                         average
                                  252
                                  is   times
                                     the        in a year,
                                          reflection        andlocal
                                                        of the   theirconditions
                                                                       number increased
                                                                                    impact. from
                                                                                              Alongthethenorth-east
                                                                                                            Baltic Seato coast,
                                                                                                                         the south-west
                                                                                                                                 changes inof cir-
                                                                                                                                              the
                                  country.    They   most    commonly     occurred    in the foothills of  the  Sudetes
                                  culation directions may trigger abrupt temperature swings as a result of air moving in  and the   Carpathians
                                  (moreover
                                  from    than warm
                                                 12), andland
                                                            mostorseldom
                                                                    cool seain north-western
                                                                                (or the other Poland     (below 8)Such
                                                                                                way around).         (Figures 5b and
                                                                                                                          patterns   are6b). Very
                                                                                                                                          mostly
                                  large  increases    in maximum      air  temperature    (∆Tmax   ↑ ≥  12  ◦ C) are very rare: up to 0.5 cases
                                  typical of late spring and early summer, as Ciaranek [30] pointed out. As a result of the
                                  annually
                                  local   air incirculation
                                                  Świnoujściecausing
                                                                and occasional
                                                                          thermaloccurrences
                                                                                     inversioninincentral    Poland (Figures
                                                                                                      the foothills,    sudden  5c and  6c). Very
                                                                                                                                   temperature
                                  large  decreases      in Tmax    (∆Tmax     ↓ ≥ 12 ◦ C) were also infrequent: up to 0.5 cases/year at
                                  changes take place. Comparing the temperature changes at foothill stations characterized
                                  the Carpathian foothills (Figures 5d and 6d).
                                        The spatial diversity of the considerable day-to-day maximum temperature changes
                                  is the reflection of the local conditions impact. Along the Baltic Sea coast, changes in
                                  circulation directions may trigger abrupt temperature swings as a result of air moving
                                  in from over warm land or cool sea (or the other way around). Such patterns are mostly
                                  typical of late spring and early summer, as Ciaranek [30] pointed out. As a result of the
                                  local air circulation causing thermal inversion in the foothills, sudden temperature changes
                                  take place. Comparing the temperature changes at foothill stations characterized by the
                                  highest mean annual values, it can be noticed that the Jelenia Góra station is located in
                                  the lowest part of the valley, and the Zakopane station lies not in the lowest, but in the
                                  central part of the inlet cone, which gradually descends towards the north. Moreover,
                                  as Tang and Leng [14] note, cloud cover is either the major indicator of the summer mean
                                  daily maximum temperature changes (the effect) or the important local factor influencing
                                  the changes (the cause). Cloud cover is negatively correlated with mean daily maximum
                                  temperature variation in spring and autumn at the middle latitudes of North America [14].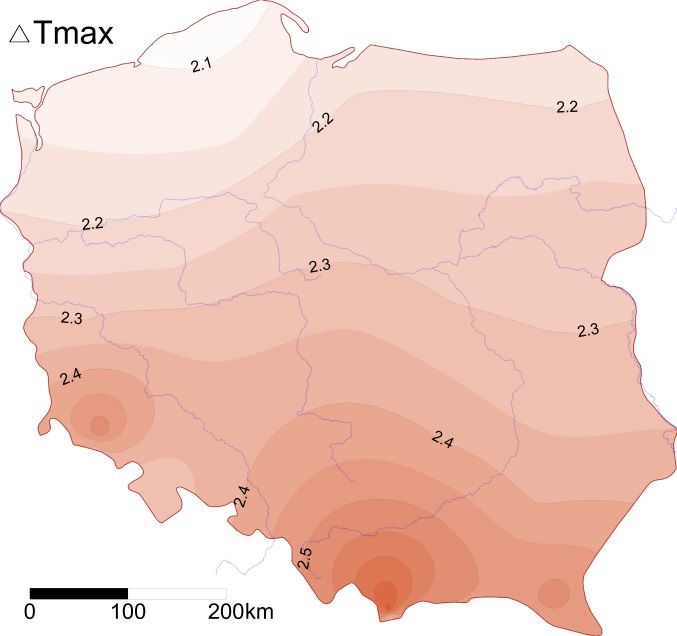
by the highest mean annual values, it can be noticed that the Jelenia Góra station is lo-
                                 cated in the lowest part of the valley, and the Zakopane station lies not in the lowest, but
                                 in the central part of the inlet cone, which gradually descends towards the north. More-
                                 over, as Tang and Leng [14] note, cloud cover is either the major indicator of the summer
                                 mean daily maximum temperature changes (the effect) or the important local factor in-
Atmosphere 2021, 12, 80                                                                                                 9 of 20
                                 fluencing the changes (the cause). Cloud cover is negatively correlated with mean daily
                                 maximum temperature variation in spring and autumn at the middle latitudes of North
                                 America [14].

     Figure 6. Spatial distribution of annual averages of large interdiurnal increases (a) and decreases (b) and very large increases
     (c) and 6.
     Figure  very  largedistribution
                Spatial  decreases (d)
                                     ofin Tmax averages
                                        annual  in Polandofinlarge
                                                              the years 1966–2015.
                                                                   interdiurnal increases (a) and decreases (b) and very large in-
     creases (c) and very large decreases (d) in Tmax in Poland in the years 1966–2015.
                                        Large increases in Tmin (∆Tmin↑ ≥ 6 ◦ C) in Poland occurred 356 times a year. Their num-
                                  ber generally   increased
                                       Large increases      infrom
                                                                Tminthe   west to the
                                                                        (ΔTmin↑      ≥ 6 east
                                                                                         °C) ofin the country,
                                                                                                   Poland      varying
                                                                                                            occurred    356from   6 cases
                                                                                                                              times        in Zielona
                                                                                                                                       a year.  Their
                                  Góra  and   Świnoujście   to  29  cases  annually    in Jelenia   Góra  (Figures    5a
                                 number generally increased from the west to the east of the country, varying from 6 cases  and   7a).  Decreases    in
                                  large  changes    in Tmin    (∆Tmin    ↓ ≥   6 ◦ C) in Poland were recorded on average 275 times in a
                                 in Zielona Góra and Świnoujście to 29 cases annually in Jelenia Góra (Figures 5a and 7a).
                                  year, and the
                                 Decreases        spatialchanges
                                               in large     distribution    of their
                                                                      in Tmin         number
                                                                                 (ΔTmin↓         was in
                                                                                              ≥ 6°C)   variable
                                                                                                          Poland (Figures    5b and 7b).
                                                                                                                   were recorded             They oc-
                                                                                                                                         on average
                                  curred   most   seldom     in  the  north-western       part  of  the country    with   the
                                 275 times in a year, and the spatial distribution of their number was variable (Figures 5b     lowest    number     of
                                  cases
                                 and     recorded
                                       7b).           in Świnoujście
                                             They occurred                (3 timesininthe
                                                                  most seldom            a year).   The highest
                                                                                             north-western      partnumber
                                                                                                                       of the of   large decreases
                                                                                                                                 country    with the
                                  in  Tmin   was   recorded     in  Jelenia  Góra    (more    than   25). Very   large
                                 lowest number of cases recorded in Świnoujście (3 times in a year). The highest number  increases     in minimum
                                  airlarge
                                 of   temperature
                                            decreases  (∆Tmin
                                                          in Tmin      12 ◦ C)
                                                                  ↑ ≥was        were the
                                                                            recorded     in most
                                                                                             Jeleniacommon     of all the
                                                                                                       Góra (more      thanvery
                                                                                                                              25).large
                                                                                                                                    Veryvariations
                                                                                                                                            large in-
                                  within   the  range   of 0.1  cases/year     in   northeastern     Poland
                                 creases in minimum air temperature (ΔTmin↑ ≥ 12 °C) were the most common     to  2.9  cases   annually    in
                                                                                                                                           of Jelenia
                                                                                                                                               all the
                                  Góra   (Figures    5c and   7c).  Very  large    decreases    in  Tmin   (∆Tmin    ↓  ≥ 12   ◦ C) did not exceed
                                 very large variations within the range of 0.1 cases/year in northeastern Poland to 2.9 cases
                                  0.6 cases a year in Suwałki (Figures 5d and 7d).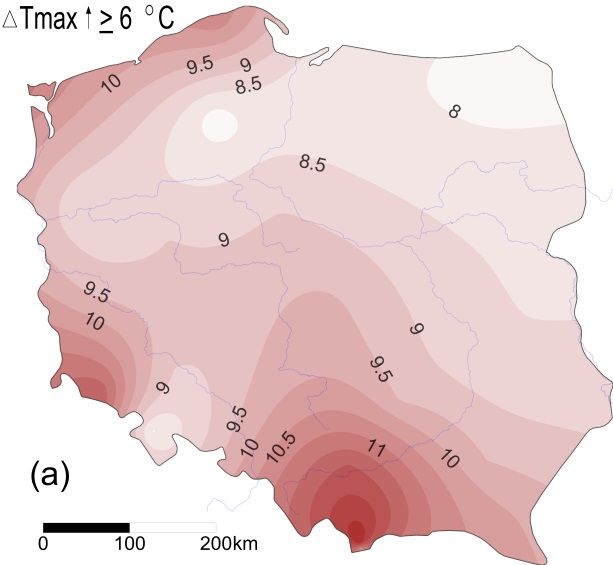
Generally, the number of large changes in Tmin in Poland is the lowest in the
                                 northwestern part and increases east and southward. The increasing number of cases
                                 towards the east of the country confirms the intensification of thermal continentalism in
                                 this direction. The presented results are consistent with the results of the research of
                                 Panfil and Dragańska [5], who showed that large (≥ 6 °C) day-to-day changes in temper-
Atmosphere 2021, 12, 80                                                                                               10 of 20
                                 ature occurred most frequently in the east of their study area. On the other hand, fre-
                                 quent large changes in temperature in the Jelenia Góra valley for example, result also
                                 from the local circulation conditions in this area, i.e., foehn winds.

                Spatialdistribution
     Figure7.7.Spatial
    Figure             distribution of
                                    of annual
                                       annualaverages
                                                averagesofoflarge
                                                              largeinterdiurnal increases
                                                                     interdiurnal         (a) (a)
                                                                                   increases   andand
                                                                                                   decreases (b) and
                                                                                                      decreases      veryvery
                                                                                                                 (b) and largelarge
                                                                                                                               increases
                                                                                                                                    in-
     (c) and(c)
    creases  very
                andlarge
                     verydecreases (d) in Tmin
                          large decreases  (d) ininTmin
                                                    Poland  in the years
                                                        in Poland    in the1966–2015.
                                                                            years 1966–2015.

                                        Generally, the number of large changes in Tmin in Poland is the lowest in the north-
                                      In the analysed period, the mean monthly number of days with large changes in
                                  western part and increases east and southward. The increasing number of cases towards
                                 Tmax (≥ 6 °C) in Poland reached 20 cases in a year, including 9.5 increases and 10.5 de-
                                  the east of the country confirms the intensification of thermal continentalism in this di-
                                 creases. The number of days with these changes in Tmin reached 26, including 15 in-
                                  rection. The presented results are consistent with the results of the research of Panfil and
                                 creases and 11 decreases. Large changes          in Tmax dominated in April and May,
                                  Dragańska [5], who showed that large (≥6 ◦ C) day-to-day changes in temperature occurred
                                 Tmin—from December to March (Figure 8). The lowest number of large changes in Tmax
                                  most frequently in the east of their study area. On the other hand, frequent large changes
                                 occurred in February and the period from August to November. Large changes in Tmin
                                  in temperature in the Jelenia Góra valley for example, result also from the local circulation
                                 occurred most seldom from June to August and in November.
                                  conditions in this area, i.e., foehn winds.
                                      Among the annual courses of large changes in maximum air temperature in all the
                                        In the analysed period, the mean monthly number of days with large changes in Tmax
                                 analysed
                                       ◦    stations, coastal stations stand out (Łeba and Świnoujście), showing the highest
                                  (≥6 C) in Poland reached 20 cases in a year, including 9.5 increases and 10.5 decreases.
                                  The number of days with these changes in Tmin reached 26, including 15 increases and
                                  11 decreases. Large changes in Tmax dominated in April and May, Tmin—from December
                                  to March (Figure 8). The lowest number of large changes in Tmax occurred in February
                                  and the period from August to November. Large changes in Tmin occurred most seldom
                                  from June to August and in November.
with the results of Panfil [28]. In the mountain stations (Śnieżka and Kasprowy Wierch),
the annual course of maximum temperatures changes is the same, i.e., the highest
monthly number is observed in cold seasons, and the lowest in the half-year. The oppo-
site annual course of Tmax versus Tmin large changes is characteristic for Zielona Góra—
the station situated in the western part of Poland. In turn, the specificity of the annual
Atmosphere 2021, 12, 80 11 of 20
course on the station in the north-eastern part of the country is the very high frequency of
large changes in Tmin in winter.
Atmosphere 2021, 12, x FOR PEER REVIEW 11 of 20
variability of the number of cases in a year (Figure 9). The highest monthly number of
increases and decreases in Tmax is observed in May there, and their lowest number in
November. Very large changes in Tmax (≥ 12 °C) also occur most frequently in these sta-
tions, with the highest number of cases recorded in May. The annual course of the num-
ber of both increases and decreases in Tmax reached culmination in spring, in accordance
with the results of Panfil [28]. In the mountain stations (Śnieżka and Kasprowy Wierch),
the annual course of maximum temperatures changes is the same, i.e., the highest
monthly number is observed in cold seasons, and the lowest in the half-year. The oppo-
site annual course of Tmax versus Tmin large changes is characteristic for Zielona Góra—
the station situated in the western part of Poland. In turn, the specificity of the annual
Figure 8.
8. Mean
Mean monthly
monthly number of of cases
cases of
of large
large day-to-dayincrease
increase((↑) and decrease((↓)
↑) and in Tmax
↓)ofin Tmax
Figure
course on the station innumber
the north-eastern part ofday-to-day
the country is the very highdecrease
frequency
and Tmin
and Tmin in
in Poland
Poland in
in the
the years
years 1966–2015.
1966–2015.
large changes in Tmin in winter.
Among the annual courses of large changes in maximum air temperature in all the
analysed stations, coastal stations stand out (Łeba and Świnoujście), showing the highest
variability of the number of cases in a year (Figure 9). The highest monthly number of
increases and decreases in Tmax is observed in May there, and their lowest number in
November. Very large changes in Tmax (≥12 ◦ C) also occur most frequently in these sta-
tions, with the highest number of cases recorded in May. The annual course of the number
of both increases and decreases in Tmax reached culmination in spring, in accordance
with the results of Panfil [28]. In the mountain stations (Śnieżka and Kasprowy Wierch),
the annual course of maximum temperatures changes is the same, i.e., the highest monthly
number is observed in cold seasons, and the lowest in the half-year. The opposite annual
course of Tmax versus Tmin large changes is characteristic for Zielona Góra— the station
situated in the western part of Poland. In turn, the specificity of the annual course on the
station
Figurein
8. the
Meannorth-eastern
monthly number part of the
of cases of country is the increase
large day-to-day very high frequency
(↑) and decrease of
(↓) large changes
in Tmax
in and
Tmin in in
Tmin winter.
Poland in the years 1966–2015.
Figure 9. Mean monthly number of cases of large day-to-day increase (↑) and decrease (↓) in Tmax and Tmin selected
stations in Poland in the years 1966–2015.
Figure 9. Mean monthly number of cases of large day-to-day increase (↑) and decrease (↓) in Tmax and Tmin selected
Figure 9. Mean monthly number of cases of large day-to-day increase (↑) and decrease (↓) in Tmax and Tmin selected
stations in Poland
stations in the
in Poland years
in the 1966–2015.
years 1966–2015.Atmosphere 2021, 12, 80 12 of 20
Changes in Tmin in the majority of the stations in Poland both increase and decrease
and are more considerable in winter than in summer, similarly proved by Wibig [27].
Fortuniak et al. [25] confirm that such considerable changes in temperature are usually
observed in the winter period as a result of the advection of both cool and warm air masses.
The temperature swings, which are most strongly felt by the human body and are not
prepared to rapidly adapt to them, are mainly those occurring in winter and spring as a
result of the advection of thermally different air masses, Kossowska-Cezak [2] explained.
Kossowski [48] pointed out that considerable short-term variations in temperature most
frequently occur in the cooler half of the year when the air masses over Poland are the most
thermally diverse and weather fronts are most frequent. In the summer months, such shifts
are smaller and happen less frequently, while changes in cloud cover, which influence
night-time radiation cooling, become a contributing factor [10,31].
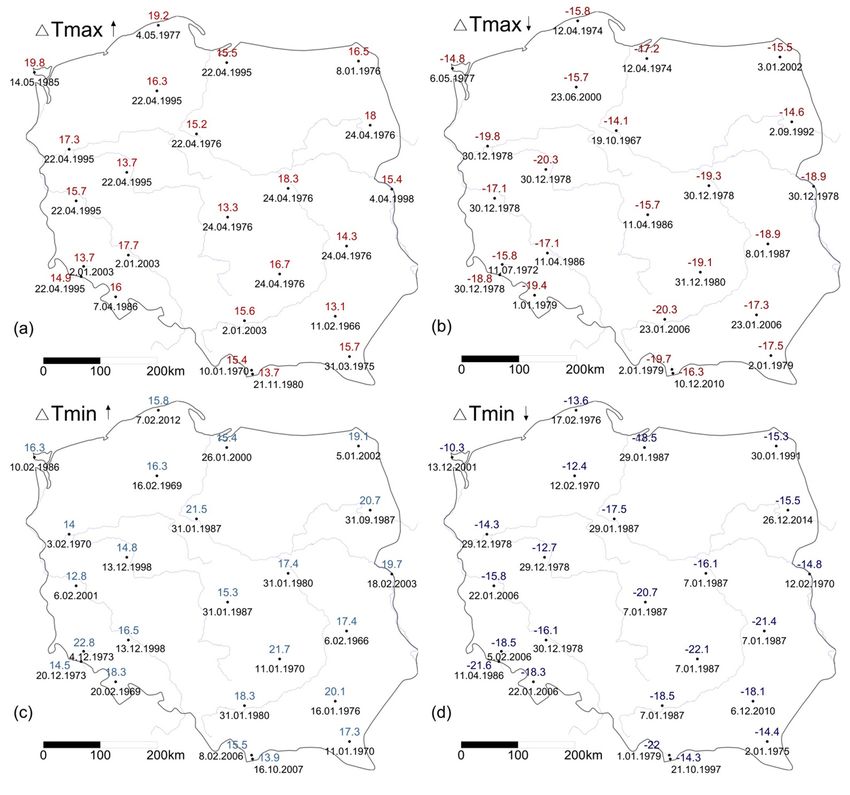
The occurrence of extreme temperature changes in Poland varies in time and space in
Poland, which proves dependence on the local conditions. During the period considered
in all the analysed stations in Poland, the highest daily decrease in Tmax exceeded 14 ◦ C,
and the increase exceeded 13 ◦ C (Figure 10). The highest decreases in particular stations
varied from −14.1 ◦ C in Toruń (19 October 1967) to −20.3 ◦ C in Poznań (30 December 1978)
and in Kraków (23 January 2006). The extreme Tmax decreases occurred mostly in winter.
Maximum increases in Tmax ranged from 13.1 ◦ C in Rzeszów (11 February1966) to 19.8 ◦ C
in Świnoujście (14 May1985). In the majority of stations, the values were recorded in April.
In such cases, a sudden increase in air temperature may lead to premature onset of the
vegetative period, while another rapid temperature drop may result in frost damage in
field crops and orchards. This may cause great losses to farmers and have an impact on the
human body as well [30].
The highest daily decrease in Tmin exceeded 10 ◦ C and the increase 12 ◦ C. Maximum
decreases in Tmin in particular stations are values from 10.3 ◦ C in Świnoujście (13 December
2001) to 22.1 ◦ C in Kielce (7 January 1987). Maximum increases in Tmin varied from 12.8 ◦ C
in Zielona Góra (6 February 2001) to 22.8 ◦ C in Jelenia Góra (4 December 1973). Extreme
values of Tmin changes occurred mostly in winter.
The large temperature changes can have strong impacts on local native plant distribu-
tions, as well as horticulture and agriculture. Mountainous terrain is well known for the
creation of local “frost hollows” due to cold air drainage [49]. Unfortunately, winter thaws
can have an immense impact on agricultural or horticultural activities as well as losses in
transport and buildings and infrastructure.
The share of temperature decreases and increases in the case of Tmax is more aligned
in comparison to Tmin in the study period. On average, in Poland, in 49.3% of cases,
an increase in Tmax occurred, and in 48.9% of cases a decrease occurred. While according
to Ciaranek [30], in the years 1961–2010 in Poland, the share of increases in large changes in
Tmax was lower than in the case of decreases and showed spatial variability. A day-to-day
decrease in Tmin occurs more frequently, averaging 50.6% of cases. The share of increases
in Tmin averages 47.7% in Poland. As Piskala and Huth [50] note, the asymmetries in the
large temperature changes (5 ◦ C and larger) were related to the passages of all three front
types in winter and to the passages of cold fronts in summer.
Interdiurnal Tmax increases occur more frequently in the south-west of Poland.
The stations in the north-western part of the country are characterised by the advan-
tage of a decrease in Tmax over a decline. The remaining area is dominated by interdiurnal
increase in Tmax.
The majority of the stations are characterised by the greatest advantage of Tmin
decreases over increases. The highest located stations stand out: at Śnieżka, the highest
peak in Karkonosze Mountains, the T min large increases prevail; and at Kasprowy Wierch
in Tatra Mountains, the large changes are aligned.
Considerably more day-to-day changes in minimum than maximum temperature
increase occurred in the analysed period. This is in accordance with the results of Panfil [28].
Similarly, Fortuniak et al. [25] determined that at the scale of the entire year, temperatureAtmosphere 2021, 12, 80 13 of 20
increases are characterised by a lower mean value, but higher frequency than temperature
decreases. This pattern is particularly evident in the warm season of the year. Regarding
day-to-day variations, Piotrowicz et al. [31] pointed out that large decreases in Tmax were
Atmosphere 2021, 12, x FOR PEER
moreREVIEW
numerous than in Tmin, whereas the opposite was true for large increases—they 13 of 20
were more numerous in the case of Tmin than for Tmax.
Figure 10. The highest
Figure 10. The interdiurnal increasesincreases
highest interdiurnal and decreases in Tmaxin
and decreases (a,b)
Tmaxand(a,b)
Tmin (c,d)
and in Poland
Tmin (c,d) inin 1966–2015
Poland with thewith the
in 1966–2015
date of its occurrence.
date of its occurrence.
3.3. InfluenceThe
of Atmospheric Circulation decreases and increases in the case of Tmax is more
share of temperature
aligned in comparison
The particular atmospheric to circulation
Tmin in the study period.
patterns On average,
cause certain thermalinconditions
Poland, inin
49.3% of
a research area. In the years 1966–2015, circulation types WZ (15.5%) and BM (10.8%) While
cases, an increase in Tmax occurred, and in 48.9% of cases a decrease occurred.
occurred according
the mostto Ciaranek(Figure
frequently [30], in11).
theThe
years 1961–2010
following in occurred
types Poland, the
the share of increases in
most seldom,
with a large changes
frequency in Tmax
below 1%: NAwas(0.6%)
lower and
thanSZin the case In
(0.8%). of decreases and showed
the aforementioned spatial vari-
period,
cyclonicability. A day-to-day
circulation decrease
considerably in Tmin
dominated occursover
(57.0%) moreanticyclonic
frequently,circulation
averaging (41.9%).
50.6% of cases.
The share of increases in Tmin averages 47.7% in Poland. As Piskala and Huth [50] note,
the asymmetries in the large temperature changes (5 °C and larger) were related to the
passages of all three front types in winter and to the passages of cold fronts in summer.
Interdiurnal Tmax increases occur more frequently in the south-west of Poland. The
stations in the north-western part of the country are characterised by the advantage of a
decrease in Tmax over a decline. The remaining area is dominated by interdiurnal in-
crease in Tmax.
The majority of the stations are characterised by the greatest advantage of Tmin de-
creases over increases. The highest located stations stand out: at Śnieżka, the highest peak3.3. Influence of Atmospheric Circulation
The particular atmospheric circulation patterns cause certain thermal conditions in a
research area. In the years 1966–2015, circulation types WZ (15.5%) and BM (10.8%) oc-
curred the most frequently (Figure 11). The following types occurred the most seldom,
Atmosphere 2021, 12, 80 14 of 20
with a frequency below 1%: NA (0.6%) and SZ (0.8%). In the aforementioned period, cy-
clonic circulation considerably dominated (57.0%) over anticyclonic circulation (41.9%).
Figure 11. Frequency of Grosswetterlagen (GWL) circulation types in the years 1966–2015. Explanations of the GWL types:
Figure 11. Frequency of Grosswetterlagen (GWL) circulation types in the years 1966–2015. Explanations of the GWL
see Table 1.
types: see Table 1.
Large day-to-day changes in Tmax primarily occurred during cyclonic circulation
Large
(Table day-to-day
3). The changes inofTmax
highest probability primarily
occurrence occurred
of a large during
increase cyclonic circulation
in maximum air temper-
(Table 3). The highest probability of occurrence of a large
ature was recorded during SWZ (8.3%) (Figure 12a). High probabilities increase in maximum
of ∆Tmax air≥tem-
6 ◦C
perature was recorded
also occurred during
during types TB SWZ
(8.0%),(8.3%)
TRW (Figure
(6.5%) and12a).SZHigh probabilities
(6.3%). of ΔTmax
The advection of warm≥6
°C also occurred during types TB (8.0%), TRW (6.5%) and SZ (6.3%). The
air masses is the cause of the temperature rise. The lowest probability of a large increase advection of
warm air masses is the cause of the temperature rise. The lowest probability
in Tmax was related to TRM and HB (1.5% each). A large decrease in Tmax was the most of a large
increase
probableinduring
TmaxHNZwas related to TRM
circulation (9.1%)and HB (1.5%
(Figure 12b). each). A large also
Such changes decrease in Tmax
occurred was
relatively
the most probable during HNZ circulation (9.1%) (Figure 12b). Such
frequently with TRM type (7.8%). The influence of cold air masses advection is reflectedchanges also oc-
curred relatively frequently
in the temperature with were
decline. They TRM recorded
type (7.8%).
most The influence
seldom duringof types
cold air
SZmasses ad-
(1.5%) and
vection is reflected in the temperature decline. They were recorded most seldom during
TB (1.8%).
types SZ (1.5%) and TB (1.8%).
Table 3. Frequency (%) of the occurrence of large interdiurnal extreme air temperature changes in the
Table 3. Frequency (%) of the occurrence
particular GWLofcirculation
large interdiurnal
types in extreme
the yearsair temperature
1966–2015. For changes in theofparticular
explanations GWLtypes,
the circulation
circulation types in the yearssee
1966–2015.
Table 2. For explanations of the circulation types, see Table 2.
Increase Decrease
Circulation Type Increase Decrease
Tmax > 6Type
Circulation °C Tmin >◦6 °C Tmax
◦
> 6 °C ◦
Tmin > 6 °C ◦
Tmax > 6 C Tmin > 6 C Tmax > 6 C Tmin > 6 C
Westerly 22.7 30.7 19.5 20.8
Northerly Westerly
17.6 22.7
23.7 30.7 39.5 19.5 32.920.8
Easterly Northerly
18.4 17.6
11.3 23.7 16.5 39.5 18.832.9
Southerly Easterly
29.4 18.4
21.7 11.3 12.7 16.5 13.918.8
Southerly 29.4 21.7 12.7 13.9
Central 8.6 10.0 9.2 9.9
Central 8.6 10.0 9.2 9.9
Cyclonic 58.7 59.8 54.8 43.0
Cyclonic 58.7 59.8 54.8 43.0
Anticyclonic 37.5
Anticyclonic 37.6
37.5 37.6 42.6 42.6 53.353.3
Undefined 3.8 2.6 2.6 3.7
A very high increase in Tmax over the predominant territory of Poland, i.e., a day-to-
day increase of more than 12 ◦ C, occurred in the study period sporadically. It occurred one
time during the following circulation types: NZ, HNZ, SWZ, and SEZ. A rapid day-to-day
decrease in maximum temperature, i.e., a decrease by more than 12 ◦ C, occurred seven
times in the study period in the majority of the analysed stations during the circulation
types: HNFZ, WS, WZ, HNFA, NZ, HM, and WA.
The southerly and westerly types especially favoured the increase of Tmax, causing
the advection of warm air masses over the area of Poland. Increase in air temperature for
southern and south-western circulation could be related to the foehn effect on the northern
slopes of Carpathian Mountains for the station in the south of Poland. The decrease of
Tmax occurred with the highest probability during the northerly types as the cold air
masses reached Poland.masses reached Poland.
The obtained results coincide with earlier studies. This is confirmed by research by
Wibig [27], according to which western types are characterised by an increase in tem-
perature, but maintain shorter for 4–5 days, and day-to-day changes are lower than in the
case of eastern types. Eastern types are characterised by a day-to-day decrease in tem-
Atmosphere 2021, 12, 80 perature maintained for 5–6 days. Panfil [29], analysing the dependencies of large 15 of 20
changes in extreme temperatures on the atmospheric circulation in Olsztyn, proved a
particular impact of the northern and westerly components.
(a)
Atmosphere 2021, 12, x FOR PEER REVIEW 16 of 20
(b)
(c)
(d)
Figure 12. Probability of the occurrence of large interdiurnal of extreme air temperature changes in the particular GWL
Figure 12. Probability of the
circulation types occurrence
in the of large
years 1966–2015: interdiurnal
(a) ΔTmax↑; of extreme
(b) ΔTmax↓; air temperature
(c) ΔTmin↑; changes of
(d) ΔTmin↓. Explanations inthe
theGWL
particular GWL
circulation types in the
types: see years
Table 1. 1966–2015: (a) ∆Tmax↑; (b) ∆Tmax↓; (c) ∆Tmin↑; (d) ∆Tmin↓. Explanations of the GWL types:
see Table 1.
Large day-to-day increase in Tmin (≥ 6 °C) more often occurred during cyclonic
circulation types (59.8%), while the anticyclonic circulation types caused large Tmin de-
clines (53.3%) (Table 3). The highest probability of occurrence of a large increase in
minimum temperature was recorded during SWZ (11.3%) and NWZ (10.1%) (Figure 12c).
SWZ circulation brings the warmer air masses over Poland, which may cause the large
Tmin increase. If the polar maritime air flows to Poland during the NWZ circulation in
winter, it may induce a thaw and large increase in temperature as well. The lowest
probability of a high increase in Tmin was usually related to circulation types SA (1.0%)Atmosphere 2021, 12, 80 16 of 20
The obtained results coincide with earlier studies. This is confirmed by research by
Wibig [27], according to which western types are characterised by an increase in tempera-
ture, but maintain shorter for 4–5 days, and day-to-day changes are lower than in the case
of eastern types. Eastern types are characterised by a day-to-day decrease in temperature
maintained for 5–6 days. Panfil [29], analysing the dependencies of large changes in ex-
treme temperatures on the atmospheric circulation in Olsztyn, proved a particular impact
of the northern and westerly components.
Large day-to-day increase in Tmin (≥6 ◦ C) more often occurred during cyclonic circu-
lation types (59.8%), while the anticyclonic circulation types caused large Tmin declines
(53.3%) (Table 3). The highest probability of occurrence of a large increase in minimum
temperature was recorded during SWZ (11.3%) and NWZ (10.1%) (Figure 12c). SWZ
circulation brings the warmer air masses over Poland, which may cause the large Tmin
increase. If the polar maritime air flows to Poland during the NWZ circulation in winter,
it may induce a thaw and large increase in temperature as well. The lowest probability of a
high increase in Tmin was usually related to circulation types SA (1.0%) and NEZ (1.5%).
The highest probability of occurrence of a large decrease in Tmin was recorded in type
HNA (9.4%) (Figure 12d). A higher number of large day-to-day changes in Tmin was also
probable during circulation WA (6.3%), as well as HB (6.2%). The advection of air masses
from the northern direction and the strong effective radiation in the anticyclonic conditions
cause the Tmin declines. The lowest probability of a high day-to-day decrease in Tmin
occurred in types SA and TM (2.1% each).
Very large changes in Tmin were recorded more frequently over a prevalent area of
Poland. Day-to-day changes in Tmin ≥ 12 ◦ C occurred 36 times in the period 1966–2015,
and the highest probability of their occurrence was determined during SZ, NZ, HB,
and SWZ types. A rapid decrease in Tmin was recorded six times: twice during type
WS and one occurrence each during types: WZ, NZ, NWZ, and BM. All these cases of rapid
changes in Tmin occurred in winter.
Large Tmin increase was associated with the westerly inflow mainly, and in turn,
decrease was associated especially with the northerly advection. The western circulation is
leading to an increase in minimum temperature in winter, causing thaws. The free passages
of polar oceanic air masses contribute to cooling down in the warm season. In winter,
high decreases in temperature correspond to circulation types of the easterly component,
particularly from the northern sector [19].
According to previous studies, extreme values of air temperature, rapid cooling or
warming depending on the season, are associated with anticyclonic circulation and strong
highs blocking the zonal circulation [7–9]. The radiative processes are most effective during
clear sky weather days under anticyclonic conditions. The persistence of anticyclonic
circulation for several days leads to increases in daytime temperatures, due to the positive
radiation balance in summer [8,50,51]. While Kuziemska [52] pointed to the important
role of advection in shaping considerable temperature anomalies in winter, both positive
and negative, the most high temperature decreases occur when the inflow of cold air
is accompanied by strong effective radiation, i.e., in the case of anticyclonic circulation
types. In summer, the dominant role in shaping thermal conditions is played by insolation,
and secondary, although still important, by advection. Kossowska-Cezak [2] evidenced that
day-to-day temperature changes also depend on the sequence of circulation types. Day-to-
day changes in minimum and maximum temperatures are usually the highest between
the second and fourth day of occurrence of a given circulation, and then they decrease or
even change the sign to the opposite one [27]. Sfîcă et al. [18] identified two major spatial
changes in cloud cover over Europe, in connection with atmospheric circulation, associated
with the latitudinal shift towards the north of the westerly circulation. The changes in cloud
cover distribution and also in radiation fluxes leading to temperature changes, imposed
by these shifts in atmospheric circulation over the continent, are higher in Eastern and
Central Europe.Atmosphere 2021, 12, 80 17 of 20
Temperature changes at moderate latitudes remain in close relation to the variability
of atmospheric circulation, particularly in winter when insolation plays a secondary role
in forming weather conditions [27]. However, besides the weather situation and the
advection of various air masses, the scale of short-term temperature changes is influenced
by local factors, such as relief and land cover [53]. Tomczyk [54] suggested that the
daily minimum temperature is less associated with the regional circulation patterns than
the daily maximum temperature and more influenced by local factors instead. In turn,
Piotrowicz et al. [31] suppose that the short-term variation in Tmax and Tmin decrease—
which has been gradual over the entire analysed long-term period, without clear and
sudden changes to the overall trend—was largely influenced by anthropogenic factors.
The decrease in the daily temperature range is partially related to increases in cloud cover.
Furthermore, a large number of atmospheric and surface boundary conditions are shown to
differentially affect the maximum and minimum temperatures. For rural sites, day-to-day
temperature variation was typically greater for Tmin than Tmax. The opposite was found
for urban locations, with statistically significant stronger signals for larger cities [33].
4. Summary and Conclusions
The spatial and temporal variability of large interdiurnal temperature changes in Poland
indicates the local conditions as well as the atmospheric circulation impact. The research on
large day-to-day changes in extreme temperature in Poland in the period 1966–2015 showed
that there was a statistically significant increase in the number of large changes in both
Tmax and Tmin, although the fluctuations show spatial variability. Higher fluctuations
of maximum than minimum temperature were recorded over the majority of the territory
of the country. The number of large changes in Tmax increases from north to south,
and the number of large changes in Tmin from north to east and south of Poland reflect
the range of the effect of marine and continental properties on the climate of Poland.
The highest number of large Tmax changes in the mountain foothills indicates the influence
of local relief. The research carried out showed that in Poland, day-to-day changes in Tmin
exceeding 6 degrees are considerably more frequent in winter. Large changes in Tmax,
however, show a higher frequency in spring.
Large changes in Tmax and Tmin are mainly recorded during cyclonic circulation,
however, the anticyclonic circulation types favour especially large decreases in Tmin.
The study showed the variability of the direction of atmospheric advection favouring
changes in Tmax and Tmin. Large increases in Tmax were favoured by southerly circulation
type, and in Tmin were primarily favoured by westerly types. The decreases in both Tmax
and Tmin occurred the most frequently during the northerly type of circulation.
The analysis of the dependency of considerable temperature changes on atmospheric
circulation is in accordance with the Grosswetterlagen (GWL) classification in this research.
However, for future works, COST733 software would be a different approach for similar
studies. In order to examine correspondence between different methods for circulation type
classification, a dataset of classification catalogs for 12 different European regions has been
created using a specially developed software package [55]. Twenty-seven basic automatic
classification methods have been applied in several variants to different input datasets
describing atmospheric circulation. Together with six manual classifications, a total of 33
methods are available for inter-comparison.
Linkages of the observed changes in Tmax, Tmin and the diurnal temperature range
to large-scale climate forcings, such as cloud cover, precipitation, anthropogenic increases
in sulfate aerosols, greenhouse gases, or biomass burning, remain tentative [21,33,56].
Future changes in Tmax, Tmin and diurnal temperature range urgently need to be better
understood as they provide vital scientific information for adapting to temperature changes
and effectively managing the related disaster risks [50]. Future research on temporal and
spatial variability and the influence of particular local conditions on the occurrence of large
changes in extreme temperatures would not only be valuable but also necessary.You can also read