Effects of Colored Light on Growth and Nutritional Composition of Tilapia, and Biofloc as a Food Source - MDPI
←
→
Page content transcription
If your browser does not render page correctly, please read the page content below
applied
           sciences
Communication
Effects of Colored Light on Growth and Nutritional
Composition of Tilapia, and Biofloc as a Food Source
Daniela Lopez-Betancur 1 , Ivan Moreno 2 , Carlos Guerrero-Mendez 1 ,
Domingo Gómez-Meléndez 1 , Manuel de J. Macias P. 3 and Carlos Olvera-Olvera 1, *
 1    Unidad Académica de Ingeniería Eléctrica, Universidad Autónoma de Zacatecas, Campus Siglo XXI,
      Zacatecas C.P. 98160, Mexico; danielalopez106@uaz.edu.mx (D.L.-B.);
      guerrero_mendez@uaz.edu.mx (C.G.-M.); domag5@hotmail.com (D.G.-M.)
 2    Unidad Académica de Ciencia y Tecnología de la Luz y la Materia, Universidad Autónoma de Zacatecas,
      Campus Siglo XXI, Zacatecas C.P. 98160, Mexico; imorenoh@uaz.edu.mx
 3    Unidad Académica de Ciencias Química, Universidad Autónoma de Zacatecas, Campus Siglo XXI,
      Zacatecas C.P. 98160, Mexico; mmacias@uaz.edu.mx
 *    Correspondence: colvera@uaz.edu.mx; Tel.: +52-492-107-0307

 Received: 28 November 2019; Accepted: 30 December 2019; Published: 3 January 2020

 Abstract: Light stimulation and biofloc technology can be combined to improve the efficiency and
 sustainability of tilapia production. A 73-day pilot experiment was conducted to investigate the
 effect of colored light on growth rates and nutritional composition of the Nile tilapia fingerlings
 (Oreochromis niloticus) in biofloc systems. The effect of colored light on the nutritional composition of
 bioflocs as a food source for fish was measured. Three groups were illuminated in addition to natural
 sunlight with colored light using RGB light emitting diodes (LEDs) with peak wavelengths (λ) of
 627.27 nm for red (R), 513.33 nm for green (G), and 451.67 nm for blue (B) light. LED light intensity
 was constant (0.832 mW/cm2 ), and had an 18-h photoperiod of light per day throughout the study.
 The control group was illuminated only with natural sunlight (natural). Tilapia had an average initial
 weight of 0.242 g. There was a significant effect of colored light on tilapia growth and composition.
 The R group showed the best growth rate, highest survival, and highest lipid content. The B group
 showed homogeneous growth with the lowest growth rate and lipid content, but the highest protein
 level. On the other hand, the biofloc composition was influenced by the green light in the highest
 content of lipids, protein, and nitrogen-free extract.

 Keywords: food science; light; color; LEDs; sustainable aquaculture; fish production;
 preliminary results

1. Introduction
     Aquaculture is one of the fastest-growing food production areas and it is one of the most important
sources of food, nutrition, income, and livelihood for hundreds of millions of people worldwide [1].
By 2030, the production of freshwater species such as carp, catfish, and tilapia is expected to represent
about 60% of total aquaculture production [2,3]. However, fish farming requires the use of land,
freshwater, and environmental resources, which are increasingly scarce and expensive worldwide.
By 2030, the world could have a global water deficit of 40% in the usual commercial scenario, and by
2050, the demand for water is expected to increase by 55% in all sectors of production [4]. Therefore,
an increase in aquaculture production must be carefully planned, minimizing the environmental
impact and optimizing the use of natural resources.
     Today, sustainable aquaculture systems produce more fish without affecting the environment,
such as using biofloc technology (BFT). In systems with BFT, there are limited exchanges of water

Appl. Sci. 2020, 10, 362; doi:10.3390/app10010362                              www.mdpi.com/journal/applsci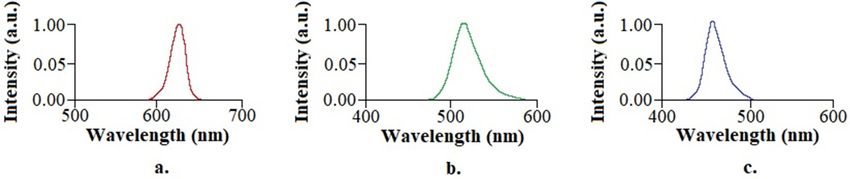
Appl. Sci. 2020, 10, 362                                                                             2 of 14

and, thus, there is an accumulation of organic matter and nutrients that promote the development of
a microbial community called a bioflocs [5]. Bioflocs are conglomerates of phytoplankton, bacteria,
zooplankton, microbial grazers, and particulate organic matter, which are mainly heterotrophic bacteria.
When this conglomerate is mixed with an added external carbon source, the growth of heterotrophic
bacteria is stimulated and the absorption of nitrogen occurs through the production of microbial
proteins, which serve as a food source for fish that is available 24 h per day [6–9]. Biofloc systems are
mainly used to cultivate tilapia (Oreochromis sp.) and white shrimp (Litopenaeus vannamei) because
both species can eat biofloc and live in environments with high levels of turbidity [10]. The biofloc
community can also be used to improve water quality by adding carbon sources to the pond [11,12].
      The development of new technologies and scientific studies in aquaculture is essential to improve
intensive fish production. A promising improvement in aquaculture comes from light emitting diode
(LED) lighting. It has been shown that lighting in aquaculture can influence embryonic development,
releasing reproductive hormones that increase fish growth [13,14]. However, fish are visual feeders that
need a minimum light intensity to eat and, thus, grow and develop [15]. In addition to the influence on
embryonic development, the intensity and spectrum light in certain photoperiods (intensity, duration,
and periodicity) can be used to alter and control the growth of fish [16–20]. Photoperiods also
influence the release of reproductive hormones, which play an important role in fish reproduction and
growth [13]. In addition, under short wavelengths such as blue light, melatonin (which is the hormone
that is responsible for sleep) decreases in the bass fish, and the lower the melatonin, the longer the fish
are awake, and the more they feed [21]. However, banana shrimp (Penaeus merguiensis) have a faster
growth related to the intensity of the lighting, and the higher the light intensity, the less the shrimp
feed, but they grow faster, possibly because of better efficiency of food assimilation [22]. For shrimp
with BFT, it was observed that when low light intensity was used, shrimp production decreased by
48%, and the density of microalgae, zooplankton, and rotifers also decreased by 60%, 60%, and 90%,
respectively [23].
      Tilapias are generally diurnal feeders that feed at different time periods during the day [24]. Using
fluorescent tube lamps with a photoperiod of 18L:6D and illuminance of 2500 lux, it is possible to
produce more Nile tilapia seeds (percentage of spawning synchrony and percentage of the sac and
swim-up fry stages) compared to a shorter photoperiod with less illumination (2500 lux/15 h, 2500
lux/12 h, 500 lux/18 h, 500 lux/15 h, and 500 lux/12 h) [14]. The promising new LED light technology,
which has not been widely explored in aquaculture, especially in BFT systems, can be a useful light
source tool if the light parameters (intensity, color, and periodicity) are analyzed and applied to
obtain benefits in the production of Nile tilapia in BTF. The rapid development of LED technology in
recent years has exceeded the characteristics of incandescent lamps in luminous efficiency, low heat
emission, robustness, environment resistance, non-toxicity, durability, and adjustable light intensity
and wavelength, which allows precise control of the light spectrum [25,26]. The aim of this study was
to investigate the effect of using colored LED light on tilapia growth, the nutritional composition of the
Nile tilapia fingerlings, and the composition of the bioflocs that are used as a food source for fish.

2. Materials and Methods

2.1. Ethics Statement
     All work with animals in this research was done in accordance with the “Guidelines
for the Use of Fishes in Research” published by the American Society of Ichthyologists
and Herpetologists (https://www.asih.org/sites/default/files/2018-05/asf-guidelines-use-of-fishes-in-
research-2013.pdf) and complied with the Mexican law on experimental animals according to the
protocols: NOM-062-ZOO-1999 and NOM-033-SAG/ZOO-2014.
     The experimental design and the fish-use protocol were approved within the project “LED lighting
to improve the production of tilapia in biofloc systems” by the ethics committee for animal research at
the “Autonomous University of Zacatecas” (authorization number: ACS/UAZ/036/2018).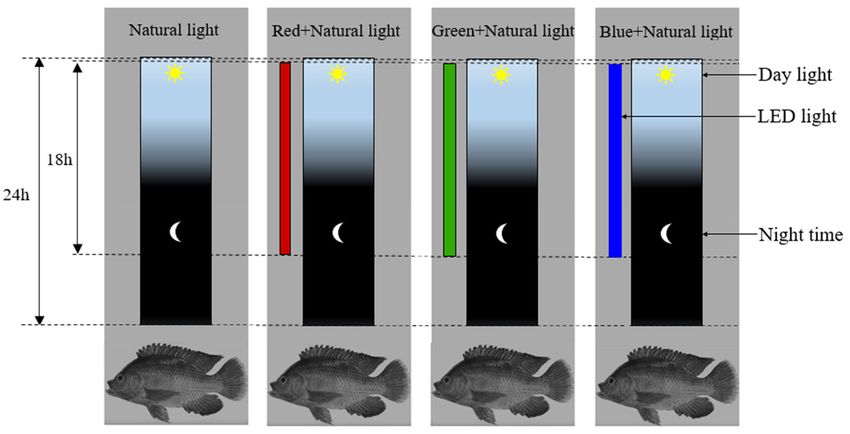
Appl. Sci. 2020, 10, 362                                                                           3 of 14

      The light intensities used in all the experiments did not exceed values that were observed in
natural waters. This study did not include endangered or protected species. All fish were acclimatized
for greenhouse conditions for 2 weeks, with the lamps off (the fish only received natural light),
before the start of the experiment. The duration of our experiment was 73 days and 489 Nile tilapia
fingerlings (Oreochromis niloticus) were used. During the planning stage of the experiment, water
quality parameters (temperature, dissolved oxygen, and pH) were monitored twice a day to confirm
optimal living conditions for tilapia. The average water quality parameters for fishponds were: 28.50 ◦ C
for temperature, 6.68 mg/L for dissolved oxygen, 7.9 for pH, 0.08 mg/L for ammonia, and 0.83 mg/L for
total ammonia nitrogen. The average ammonia and total ammonia nitrogen values were monitored
every 8 days. The fishponds were supplied with a 300 W thermostat heater (Grupo acuario LOMAS,
Ciudad de Mexico, CDMX, Mexico) to avoid temperature variations. Aeration was provided by a
Sino-Aqua blower (1/2 Hp of power, and 9” membrane diffuser discs). Additionally, 10% of the tank
water was exchanged each week. During the progress of this experiment, 105 fish died from natural
causes such as acclimatization, and no specific pathologies were observed to determine if the fish
should be euthanized. At the end of the experiment 384 fish were sacrificed. We carefully used
standardized procedures for fish euthanasia. Since Nile tilapia do not tolerate cold water, they were
sacrificed by rapid chilling (hypothermic shock) by keeping the tilapia in ice water at 2 ◦ C for 10 min
after the opercular movement stopped. The fish were stored in a freezer until chemical analysis of their
nutritional composition (approximately 72 h).

2.2. Laboratory Facilities and Fish Stocking
      A 73-day experiment was performed in a greenhouse in the prototypes laboratory at the
Autonomous University of Zacatecas, Mexico. Before the experiment started, 489 Nile tilapia
(O. niloticus) fingerlings were purchased from a commercial hatchery (AQUAMOL S.C. DE R.L., Jamay,
Jal., Mexico), and moved to the greenhouse, where they underwent a period of acclimatization. The Nile
tilapia fingerlings had an initial average weight of 0.242 ± 0.01 g. They were randomly distributed,
with a same density of 0.2 kg/m3 (approximately 123 fish per tank, and exactly 30 g of biomass per
tank), in circular tanks (150-L capacity, 39 cm high × 70 cm in diameter) under natural light. This is a
pilot study because in this experimentation there were no replicated tanks (n = 1). All results presented
are preliminary results, but significant because each tank contained a large number of fish.

2.3. Experimental Design and Setup
     The experiment was designed to study the effect of colored light under real light conditions.
The experiment could also be transferred to real production because real conditions were present
in the experiments, such as all four treatments received natural light, which is consistent with
aquaculture farms.
     This investigation implemented a special change, in addition to receiving natural light, three
treatments were illuminated with red, green, and blue LED lamps for 18 h per day. The illumination
was provided by RGB (red, green, and blue monochromatic light) LED lamps with peak wavelengths
(λ) of λ = 627.27 nm for the red light treatment (R), λ = 513.33 nm for the green light treatment
(G), and λ = 451.67 nm for the blue light treatment (B). LED lamps were positioned 25 cm above
the water surface, with the purpose that the lamp opening angle (110◦ ) should focus completely on
the water surface of the entire tank diameter. LED light intensity of all the lamps was constant at
0.832 mW/cm2 , and the natural light provided by the sunlight inside the greenhouse had a maximum
of irradiance of 0.95 mW/cm2 at 14:00 h. The fourth treatment, which we called “Natural” light
treatment, only received natural light, and served as a control treatment. The lighting conditions for
the four treatments are shown in Figure 1.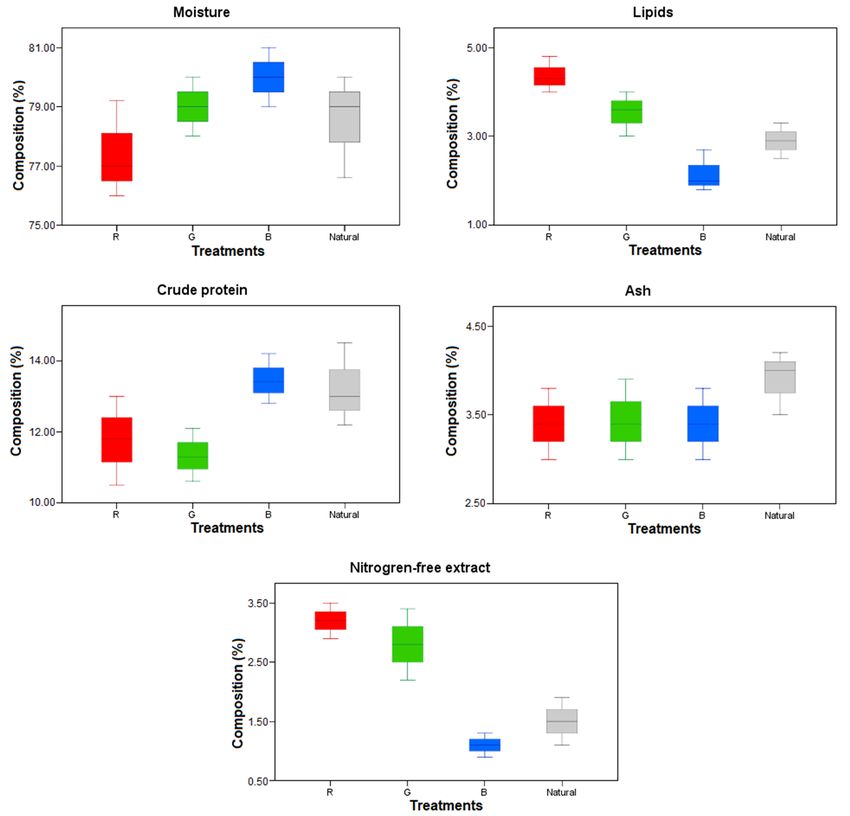
Appl. Sci. 2020, 10, 362                                                                                          4 of 14
Appl. Sci. 2020, 10, x FOR PEER REVIEW                                                                            4 of 15

     Figure   1. Light
      Figure 1.  Light periods
                        periods received
                                 received by
                                          by each
                                             each tank
                                                   tank during
                                                         during this
                                                                 this research.
                                                                       research. All
                                                                                 All treatments
                                                                                      treatments received
                                                                                                  received natural
                                                                                                            natural
     light,
      light, but three of the treatments were also illuminated with red, green, and blue colored light,
            but three of the treatments  were also  illuminated  with   red, green, and  blue colored  light, which
                                                                                                              which
     was provided by an LED lamp, with a photoperiod of 18 h per day.
      was provided by an LED lamp, with a photoperiod of 18 h per day.
2.4. Characterization of LED Lamps
 2.4. Characterization of LED Lamps
      The LED lamps used in this experiment were optically characterized using a spectrophotometer
       The LED
(USB2000,        lamps
             Ocean       usedLargo,
                    Optics,    in thisFL,
                                       experiment
                                          USA) andwere   optically
                                                    a NIST         characterized
                                                             calibrated            using
                                                                          radiometer       a spectrophotometer
                                                                                      (ILT-1400,   International
Light Technologies Inc., Peabody, MA, USA). Wavelength (λ) and spectral width (∆λ)International
 (USB2000,   Ocean   Optics,  Largo,  FL, USA)  and  a NIST  calibrated   radiometer   (ILT-1400,    parameters
 Light  Technologies    Inc., Peabody,   MA,  USA).   Wavelength    (λ)  and  spectral  width
were measured using the spectrophotometer device. The irradiance or radiant power density       (∆λ) parameters
                                                                                                          on the
 were measured
water   surface of using   the spectrophotometer
                   each tank   was measured usingdevice.    The irradiance
                                                     the radiometer.          or radiantLED
                                                                        The measured      power   density
                                                                                               lamp       on the
                                                                                                     parameters
 water  surface of each   tank  was  measured  using  the radiometer.   The  measured
                                                                                    2    LED   lamp
are presented in Table 1, where the average irradiance was 0.832 mW/cm . Figure 2 also shows the     parameters
 are presented
spectral  powerin   Table 1, where
                  distribution        theemitted
                                of light  averageby
                                                  irradiance  was LED
                                                    each colored            mW⁄cm . Figure 2 also shows the
                                                                    0.832lamp.
 spectral power distribution of light emitted by each colored LED lamp.
     Table 1. Optical properties of light colors in light emitting diode (LED) lamps: red (R), green (G),
     Table
     and    1. Optical
         blue  (B).    properties of light colors in light emitting diode (LED) lamps: red (R), green (G), and
     blue (B).
                                                                   LED Lamps
                              Parameters                          LED Lamps
                                    Parameters             R            G           B
                                                               R         G         B
                                  λ (nm)
                                       λ (nm)            627.27
                                                            627.27    513.33
                                                                      513.33         451.67
                                                                                 451.67
                                 ∆λ (nm)                  16.92        32.80          23.75
                                      Δλ  (nm)
                          Irradiance (mW/cm2 )
                                                             16.92
                                                          0.87
                                                                      32.80
                                                                       0.83
                                                                                 23.750.80
                               Irradiance (mW⁄cm )           0.87       0.83      0.80

      Figure 2.
     Figure  2. The
                The spectral
                    spectral power
                             power distribution
                                    distribution of
                                                 of the
                                                    the RGB
                                                        RGB LED
                                                            LED lamps
                                                                lamps used
                                                                      used in
                                                                           in the
                                                                              the study:
                                                                                  study: (a)
                                                                                         (a) R
                                                                                             R LED
                                                                                               LED lamp;
                                                                                                   lamp;
      (b) G LED  lamp; and  (c) B LED lamp.
     (b) G LED lamp; and (c) B LED lamp.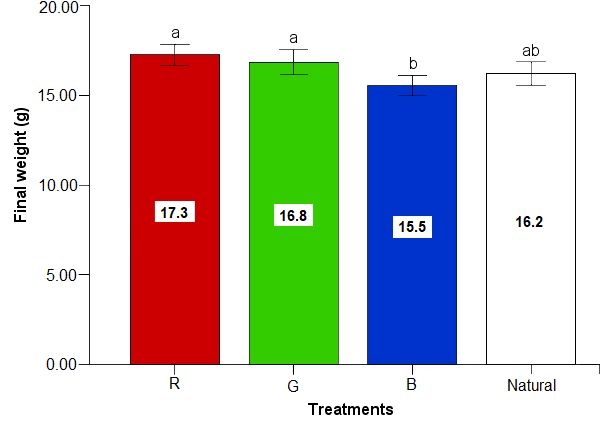
Appl. Sci. 2020, 10, 362                                                                                             5 of 14

2.5. Nile Tilapia Fingerlings and the Biofloc System
      All treatment groups began the study with tap water, which was previously aerated for 1 week to
allow water dechlorination. No water exchange was made, and the formation of the biofloc started
from zero when the tilapia arrived. Each tank was fixed at 29 ◦ C using a 300 W thermostat heater to
avoid high temperature variations, and to provide a comfortable temperature for the fish. Pure cane
sugar was added to each tank as a carbon source, which was calculated using the method described
by De Schryver et al. [27]. The use of a carbon-to-nitrogen (C/N) ratio of 20:1 in the tanks ensures
the water quality during the biofloc formation because we guarantee a low level of total ammonia
nitrogen (TAN) in the water [28,29]. The fish were fed by hand twice a day using the commercial
diet I during the first month, and then using the commercial diet II, according to the requirements of
the growth stage. The nutritional composition of the commercial diet I, commercial diet II, and cane
sugar used are listed in Table 2. The daily amount of food was adjusted every week (the feeding rate
started with 10% of the fish’s weight per day and it decreased to 5% per day) according to the growth
of the fish, fish survival, and the biofloc that was expected in each tank. The fish feed composition was
provided by the manufacturer and was also corroborated based on a bromatology test to guarantee the
consumption and quality of the feed. During the experimental period, the tanks were checked by hand
every day, and any dead fish were removed and recorded.

                    Table 2. Feed composition for tilapia and cane sugar used as a carbon source.

                                                                         Feed
                              Commercial      Commercial      Commercial        Commercial
                                                                                                Cane Sugar     Cane Sugar
                                Diet I           Diet I         Diet II            Diet II
                                                                                               (Manufacturer) (Laboratory)
                             (Manufacturer)   (Laboratory)   (Manufacturer)     (Laboratory)
      Moisture (%)               12.00            7.90           12.00              8.10           0.00            1.80
    Crude protein (%)            53.00           43.00           32.00             40.90           0.00           0.30
       Lipids (%)                15.00           12.30           6.00              12.80           0.00           0.00
     Crude fiber (%)             2.50             1.70           6.00               2.20           0.00           3.30
        Ash (%)                  12.00           7.80            15.00             10.00           0.00           0.10
 Nitrogen-free extract (%)        5.50           27.30           29.00             26.00          100.00          94.50

2.6. Water Quality Parameters
      Temperature, dissolved oxygen (measured by the YSI model 550A dissolved oxygen meter device
(Yellow Springs Instrument Co., Yellow Springs, OH, USA)), and pH (measured by the Hanna model
HI 98127 device (Hanna Instruments, Woonsocket, RI, USA)) were measured twice a day in each tank
at 10:00 and 20:00 h. Ammonia–nitrogen (NH3 − N), which is one form of ammonia in TAN that is toxic
for fish, was regulated by adding cane sugar. NH3 − N levels were measured once per week in the
tanks using the ammonia checker device (Hanna model HI715 (Hanna Instruments, Woonsocket, RI,
USA)). In addition, the TAN value was calculated using a modified mathematical expression described
by Boyd and Tucker [30], which is written as follows:

                TAN = (NH3 − N ) × 1 + antilog [0.09018 + (2729.92/(273.15 + T ))] − pH ,                                 (1)

where TAN is the total ammonia nitrogen, (NH3 -N) is the ammonia–nitrogen, T is the water
temperature (◦ C), and pH is the water pH.

2.7. Growth Rates
     Throughout the experiment, biometric measurements were made every week in a group of
randomly selected of 15 fish in each tank. At the end of the experiment, all the fish were weighed and
measured, and the growth rates were reported as the mean ± standard deviation. According to the
final number of fish in each treatment, there were 127 fish that underwent R treatment, 79 fish that
underwent G treatment, 94 fish that underwent B treatment, and 84 fish that underwent the Natural
treatment. The mean ± standard deviation is presented for the fish weight and length. Additional
Appl. Sci. 2020, 10, 362 6 of 14
measurements to evaluate fish growth were used, as follows: initial weight (g/fish), final weight (g/fish),
final body length (cm/fish), survival (%), specific growth rate (SGR), daily weight gain (DWG), and feed
conversion rate (FCR). The mathematical expressions of the evaluation metrics were extracted from
published studies [31,32]. These evaluation metrics are written as follows:
Initial weight (g) = (initial biomass (g))/(initial number of fish), (2)
Final weight (g) = (final biomass (g))/(final number of fish), (3)
PFinal number of fish
i=0 fish body length (i)
Final body length (cm) = , (4)
final number of fish
Survival (%) = (final number of fish)/(initial number of fish) × 100%, (5)
ln(final weight (g)) − ln(initial weight (g))
SGR (%/day) = × 100%, (6)
number of days
DWG (g/day)= (final weight (g) − initial weight (g))/(number of days), (7)
FCR = (total feed intake (g))/(total wet weight gain (g)), (8)
where the initial biomass is the weight of all the fish in each tank at the beginning of the experiment,
and the final biomass is the weight of all the fish at the end of the experiment. The total feed intake is
the amount of food supplied to the fish, and the total wet weight gain is the difference between the
final weight and the initial weight of the entire biomass.
2.8. Nutritional Composition of the Fish Body and Bioflocs
Composition of the fish body is valuable information about the nutritional contribution that the
fish meat will have for a consumer. A biofloc nutritional composition study also provided information
on whether the diet of the fish could be completed correctly using the biofloc. At the end of the
experiment, all the fish were caught for a biomass analysis. The water in the tanks was sieved using
a 200-mesh screen to maintain the greatest amount of biofloc. The composition of the fish body
and the bioflocs were determined by the composition of lipids, moisture, crude protein, crude fiber,
ash, and nitrogen-free extract, according to standard methods [33,34]. The values were determined
using Soxhlet extraction apparatus while the other parameters were determined with bromatology
using gravimetric techniques. The nutritional composition analysis was performed by the Chemical
Laboratory of Special Studies at the Autonomous University of Zacatecas.
2.9. Statistical Analysis
All the measured data and the metrics that were calculated in this research were analyzed to
achieve a performance evaluation and a broad comparison between the four light treatments. Since
the parameters obtained from the tanks are mean values, a one-way analysis of variance (ANOVA),
which compares the “variation” of a group of mean values, was used.
Water quality parameters cannot be analyzed using ANOVA because there are no replicate tanks
(n = 1). However, growth rates can be analyzed because each tank had many final fish as follows:
n = 127 for R treatment, n = 79 for G treatment, n = 94 for B treatment, and n = 84 for Natural treatment.
Thus, the growth rates were analyzed using the one-way ANOVA, followed by Tukey’s test, with a
significance level of 5%. Before performing the one-way ANOVA evaluation, the hypothesis of equality
(homogeneity) of variances was verified using the Levene’s test. Data analysis of the biofloc and fish
nutritional composition was performed using the mean values of three sample replicates.Appl. Sci. 2020, 10, 362 7 of 14
3. Results
3.1. Water Quality Parameters
The average values of the water parameters remained approximately equal between all groups
during the experimental period. Thus, a constant temperature was maintained, with a variation of
less than 1 ◦ C, the pH value showed a difference below 1.25%, the variation of ammonia–nitrogen
(NH3 -N) was less than 0.03 mg/L, and the difference in dissolved oxygen and TAN were less than 0.07
and 0.17 mg/L, respectively. The mean values of water quality parameters were calculated, and they
are shown in Table 3.
Table 3. Water quality parameters.
Treatments
Parameters
R G B Natural
Temperature (◦ C) 28.03 ± 1.03 28.38 ± 0.96 28.94 ± 1.22 28.65 ± 0.93
Dissolved Oxygen (mg/L) 6.65 ± 0.58 6.67 ± 0.43 6.71 ± 0.47 6.72 ± 0.47
pH 7.91 ± 0.17 7.91 ± 0.16 7.92 ± 0.16 8.01 ± 0.20
NH3 -N (mg/L) 0.07 ± 0.01 0.07 ± 0.01 0.08 ± 0.01 0.10 ± 0.01
TAN (mg/L) 0.79 ± 0.18 0.76 ± 0.21 0.86 ± 0.14 0.93 ± 0.22
Data are presented as the mean ± standard deviation.
3.2. Growth Rates
Mean weight, mean body length, survival, specific growth rate, and feed conversion ratio were
used as metrics to evaluate the effect of colored light. According to the measured data, the R group
showed the highest final weight among the fish, and it also had the lowest initial weight. Therefore,
the R group had the highest performance, with the best growth rates and DWG (see Table 4). In addition,
the data obtained show that the R and G groups presented the best gains in weight and length. However,
the G group had the worst survival. The feed conversion ratio was better in the R and Natural groups
compared with the other groups. The SGR value was significantly higher in the groups R and G
compared with the other groups. The quantitative distribution of the final weight of the fish for each
group is shown in Figure 3.
Table 4. Growth rates of Nile tilapia.
Treatments
Parameters
R G B Natural
Initial biomass (g) 30 30 30 30
Initial weight (g/fish) 0.2 0.2 0.3 0.3
Initial number of fish 133 132 111 113
Final Biomass (g) 2193 1330 1461 1362
Total biomass gained (g) 2163 1300 1431 1332
Final number of fish 127 79 94 84
Final individual weight (g/fish) 17.3 ± 3.3 a 16.8 ± 3.1 a 15.5 ± 2.8 b 16.2 ± 3.0 ab
Final individual body length (cm/fish) 8.2 ± 1.0 a 8.0 ± 0.9 a 7.7 ± 0.9 b 7.9 ± 0.8 ab
Survival (%) 95.5 59.9 84.7 74.3
SGR (%/day) 6.0 5.9 5.6 5.7
DWG (g/day) 0.2 0.2 0.2 0.2
FCR 0.8 1.3 1.2 1.0
SGR = specific growth rate; DWR = daily weight gain; FCR = feed conversion rate. Data are presented as the mean
± standard deviation. Values in the same row with different superscript letters indicate significant differences based
on the one-way ANOVA and Tukey’s test (p < 0.05).Appl. Sci.
Appl. Sci. 2020,
2020, 10,
10, 362
x FOR PEER REVIEW 89 of
of 14
15
Appl. Sci. 2020, 10, x FOR PEER REVIEW 9 of 15
Figure 3. The
Figure
Figure 3. mean
3. The meanfinal weight
final weightofofthe
the fish
thefish in each
fish in
in eachtreatment.
each treatment.
treatment. Each
Each barbar represents
represents the mean
the mean with the
with the the
standard
standard deviation.
deviation. Different
Different letters
letters (such
(such as a,
a, b,
b, and
and ab)
ab)represent significant
represent differences
significant (p
standard deviation. Different letters (such as a, b, and ab) represent significant differences (p < 0.05).<
differences 0.05).
(p < 0.05).
3.3. 3.3. Nutritional
3.3. Nutritional
Nutritional Composition
Composition
Composition ofofthe
of thetheFish
FishBody
Fish Body and
Body and Bioflocs
Bioflocs
Bioflocs
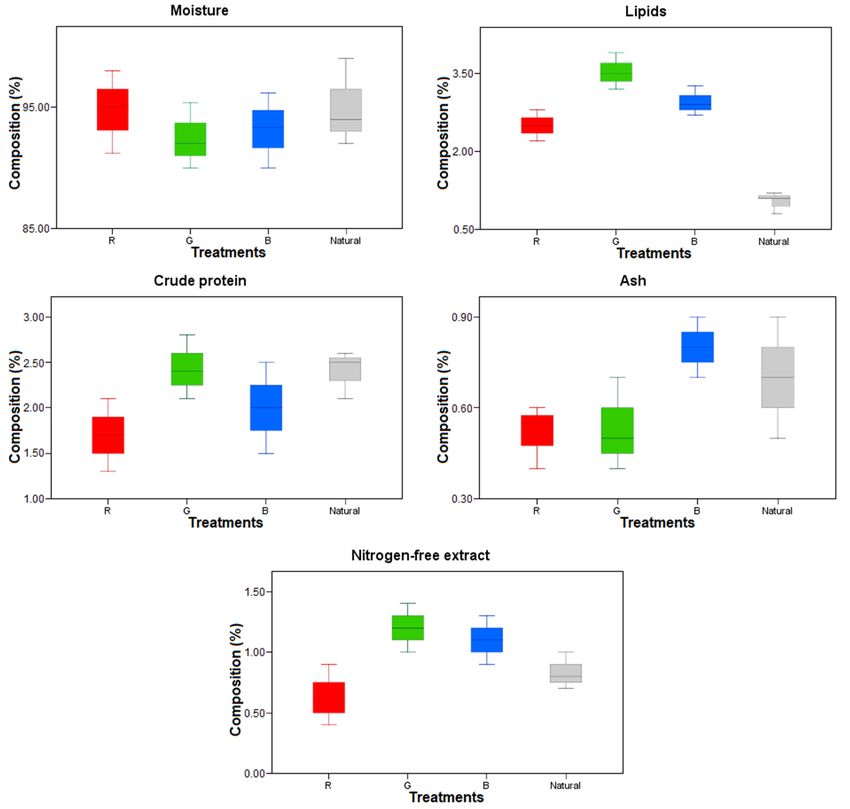
The The mean values for nutritional composition of the fish and thethe nutritional composition of the the
The mean
mean values
values for for nutritional
nutritional composition
composition of of the
the fish
fish and
and the nutritional
nutritional composition
composition of of the
bioflocs as a food source for fish are presented in Figures 4 and 5, respectively. The moisture value
bioflocs
bioflocs asasaafood
food source
source for fish
for are
fish presented
are presented in in
Figures
Figures4 and4 5, respectively.
and 5, respectively. The The
moisture valuevalue
moisture was
was higher in the body of the fish of group B. In addition, the body of the fish in groups B and Natural
higher in the
was presented
higher inbody
the of the
body fishfish
of the of group
of of
groupB. In In
addition, thethe body of thethefish iningroups B and
and Natural
a higher concentration crudeB.protein
addition,
compared body
to theof other fish groups
treatments. TheBmineral Natural
presented
presented a higher
contenta(ash)
higher concentration
concentration
in the fish in groupsof
of crude
R, crude
protein
G, and protein
compared
compared
Natural was less thanto
to the other
themeasured
that
treatments.
other treatments. The
in the fish inThe
group
mineral
mineral
content
content (ash)
(ash)in
B. Lipids in the
inthe fish
fishin
thebody ingroups
groupsR,R,of
composition G,
G, and
and
the Natural
fishNatural was
was
were most less
lessthan
influencedthanthat
bythatmeasured
the measured inin
use of coloredthe
thefish inFish
fish
lights. group
in groupB.
Lipids in the
B. Lipids Rbody
in the
in group body
showedcomposition
composition of the
a higher lipid of fishfish
the
content were
and most
were influenced
most
nitrogen-free extract.by by
influenced thethe
useuseof colored
of coloredlights. Fish
lights. in
Fish
group R showed
in group a higher
R showed lipid
a higher content
lipid andand
content nitrogen-free extract.
nitrogen-free extract.
Figure 4. Box-and-whisker plots showing the nutritional composition of the fish (%).
Figure
Figure 4. Box-and-whisker plots
4. Box-and-whisker plots showing
showing the
the nutritional
nutritional composition
composition of
of the
the fish
fish (%).
(%).Appl. Sci. 2020, 10, 362 9 of 14
Appl. Sci. 2020, 10, x FOR PEER REVIEW 10 of 15
Measurements of the mean nutritional composition of the bioflocs in the G and Natural groups
showed a Measurements of the mean
higher concentration nutritional
of crude proteincomposition
comparedoftothe
thebioflocs in the G andThe
other treatments. Natural groups
ash composition
showed a higher concentration of crude protein compared to the other treatments.
in the bioflocs from the R and G groups was lower than the content measured in the bioflocs from The ash the
composition in the bioflocs from the R and G groups was lower than the content measured in the
B and Natural groups. In addition, the mean nutritional composition of the biofloc in group G showed
bioflocs from the B and Natural groups. In addition, the mean nutritional composition of the biofloc
a higher content of lipids and nitrogen-free extract.
in group G showed a higher content of lipids and nitrogen-free extract.
Figure
Figure 5. Box-and-whiskerplots
5. Box-and-whisker plotsshowing
showing the
the nutritional
nutritionalcomposition
compositionof the biofloc
of the (%). (%).
biofloc
4. Discussion
4. Discussion
To investigate
To investigatethe the
effect of of
effect colored
coloredlight
lightin
inthe
the Nile tilapiafingerlings,
Nile tilapia fingerlings, thethe parameters
parameters that that
werewere
not related to the light color were kept
not related to the light color were kept constant, constant, but there were slight experimental variations in
there were slight experimental variations in these these
parameters
parameters thatthat
are are expected
expected not
not totosignificantly
significantly change
change thisthiscondition
condition of of
thethe
research. The The
research. meanmean
water temperature was maintained at less than 1 °C of variation, and all the tank
water temperature was maintained at less than 1 ◦ C of variation, and all the tank water temperatures water temperatures
were in accordance with the optimum range for the growth of the Nile tilapia fingerlings (26–30 °C),
were in accordance with the optimum range for the growth of the Nile tilapia fingerlings (26–30 ◦ C),
as indicated in [35]. The mean water temperature in the four treatments was 28.50 °C, which is very
as indicated in [35]. The mean water temperature in the four treatments was 28.50 ◦ C, which is very
close to the ideal temperature of 28 °C, as reported in [36]. The dissolved oxygen value did not have
close atovery
the significant
ideal temperature
variation of 28 ◦ C,all
between asthe
reported
groups inand [36]. The
it was dissolved
above oxygen
the level value
that was did notfor
acceptable have a
very significant
Nile tilapia (4–5 mg/L), in accordance with [37]. The pH fluctuated between 7 and 8 during the Nile
variation between all the groups and it was above the level that was acceptable for
tilapia (4–5 mg/L),stage,
experimental in accordance
which is the with
most [37]. The pH fluctuated
appropriate between
range in tilapia 7 and 8toduring
aquaculture theoptimum
obtain the experimental
stage,growth
whichand is the most rate,
survival appropriate range inby
as recommended tilapia aquaculture
[38]. The pH value towasobtain the optimum
not different betweengrowth
the R, and
survival rate, as recommended by [38]. The pH value was not different between the R, G, and B groups,
which could be because of a greater total amount of bacterial activity that is influenced by the use of
artificial light compared to the Natural group. Using a C/N ratio of 20, the TAN concentration has aAppl. Sci. 2020, 10, 362 10 of 14
similar behavior value to pH and it was maintained at levels that are suitable for Nile tilapia, according
to [39]. The NH3 − N values did not exceed the levels that were considered lethal for Nile tilapia during
the experiment, and this value remained below the recommended limit of 0.1 mg/L [40].
Light color was the only intentionally different parameter among all treatments. Therefore,
each treatment was only influenced by a certain color or wavelength of the light. There are not many
studies reported of the influence of colored light on the growth of Nile tilapia and fish of different species
in general [18], and as far as we know, this is the first study on the fingerling stage of development of
tilapia. Even more, all previous studies on light effect use other experimental conditions, which include
significant differences in: The lack of biofloc, the type or duration of photoperiod, the temperature,
the light intensity, peak wavelengths, light spectrum shapes, etc.
In this research, we studied the effect of colored light in Nile tilapia fingerlings and bioflocs, the R
light treatment was the aquaculture system that showed superior performance in many aspects. All the
groups received the amount of food according to the biomass that was present in each tank.
It is possible to ensure that the R treatment presented the best growth performance because it
obtained the best values of total biomass gained, SGR, and DWG. Additionally, there was a great
demand for feed intake; when food was provided it was consumed immediately, which was confirmed
because the R treatment had the best FCR of 0.8. This is consistent with [41], where feeding conduct
was analyzed, but in juvenile Nile tilapia under other experimental conditions, showing (in terms of
time (seconds), and chemical cues) that feeding motivation was higher in their red light environment.
As well, a similar behavior was found in adult rainbow trout [42], where the growth of fish was
increased at red illumination under other experimental conditions, showing low cortisol levels in their
blood (less stressful environments).
Nevertheless, the G light environment showed the second-best weight gain, but also had the
lowest survival. It is possible to rule out that the low survival was caused by a peak of ammonia
and TAN, because during the period in which these fish deaths occurred, measurements of ammonia
and TAN were in the optimal range for the life of tilapia. A similar low survival phenomenon using
green light was also observed and reported in [43], but in small fish groups (four fish per tank) of
adult tilapia under fluorescent lights and other experimental conditions. One possible reason to this
phenomenon could be that an aggressive behavior of the fish was observed in a green light environment.
Other related study determined (by blood test) the basal plasma cortisol levels (stress response) in
adult Nile tilapia, and it was found that cortisol levels increased with green light [44]. This could
be a cause of fish mortality because the green light may create stressful environment and increase
cortisol levels. A high level of cortisol also affects the nutritional composition of tilapia, causing high
moisture levels and low protein levels [45], which agree with our results. The low level of protein can
be attributed to an intensive use of muscle protein to get higher energy than that obtained from food,
which could be caused by the stress due to green light [46]. Green light may be an important factor of
mortality, but research with replicate tanks should be carried out to see all possible mortality factors.
Aly et al. [45] reported that hybrid red tilapia in saline water had a lower growth performance
under blue light and other experimental conditions. These results were attributed to a reduced
vision of the fish under green light, which reduced feeding (also see [47]). In addition, they reported
that hybrid red tilapia that were illuminated under red light had the best growth performance [45].
These observations are in agreement with our results, where the Nile tilapia fingerlings in freshwater
under blue light had the lowest growth performance, and those under red light had the best growth
performance. In addition, in [43], yellow light was shown to have the best growth performance,
which also agrees with our results, because the yellow light has a long wavelength that is close to the
wavelength of the red light.
In our research, the effect of colored light on the nutritional composition of Nile tilapia fingerlings,
and on the biofloc composition as a food source for tilapia was also measured, and this has not been
reported before. The effect of light on body composition of tilapia showed that the R group had the
highest lipid content and also the lowest moisture level (this indicates that moisture and lipid contentAppl. Sci. 2020, 10, 362 11 of 14
are inversely related, which is in accordance with [48]). However, under blue light, the fish had the
highest percentage of protein and moisture and the lowest level of lipids, while under green light,
the fish maintained a low content of lipids and proteins. Under natural light, the fish obtained a high
crude protein content and the highest content of ash.
The effect of light color on bioflocs showed that the G group had the highest lipid content.
In addition, the bioflocs in the G and Natural groups had the highest protein level. For the ash
content, B and Natural groups had the highest percentage. In addition, although the biofloc of B group
had a high level of lipids, the fish nutritional composition under B light had a low level of lipids.
This opposite relationship could be explained by the stress reduction under blue light [44], and also
a stress reduction under the lipid-rich diet [49]. Such a possible stress reduction, would reduce the
formation of lipid deposits in fish, indicating that such good health condition of tilapia under B light
could be because the lack of stress.
The results discussed above may have an important application in tilapia aquaculture with biofloc
systems because they improve our understanding of the significant effect that light color has on the
growth of fish and their nutritional composition of both the fish body and the bioflocs.
5. Conclusions
We investigated the influence of RGB colored light on the growth and nutritional composition in
tilapia in biofloc systems. We also measured the light effect on the biofloc nutritional composition.
The results showed that the peak wavelength or color of light had a significant effect on growth
performance and nutritional composition of Nile tilapia, which can be used to improve the sustainability
and efficiency of tilapia production based on the needs of the consumer. Fish under blue light had
the lowest growth performance, but blue light significantly improved the protein levels, had a low
lipid level, and obtained the most homogeneous growth among the treatments. The effect of the red
light on fish growth was significant. Tilapia under red light showed the best weight gain, body length,
and survival rate, and also showed the highest lipid content. The fish also had a lower ash content
under colored light compared to natural light. In addition, colored light influenced the lipid, protein,
and ash content in bioflocs.
These results provide support for further studies in aquaculture to improve efficient, sustainable,
and intensive fish production. For example, our results suggest that growth rates, feed utilization
efficiency, survival, and nutritional body composition may be controlled using colored light, which
can significantly modify the nutritional quality provided by Nile tilapia and bioflocs. In addition,
future research may include the effect of different intensity levels, photoperiods, and light spectra.
For example a broad light spectrum with a designed special shape [50], resulting from the combination
of LEDs of different colors and intensities, to obtain the best effects of each light wavelength and
maximize the nutritional quality of tilapia and bioflocs. This can be adjusted based on the needs of the
consumer and, in the future, the scarcity of food resources.
Author Contributions: Conceptualization, D.L.-B., C.O.-O. and I.M.; Methodology, D.L.-B. and C.G.-M.; Validation,
C.O.-O. and I.M.; Formal analysis, D.L.-B., and C.G.-M.; Investigation, D.L.-B. and C.G.-M.; Resources, C.O.-O.,
D.G.-M. and M.d.J.M.P.; Data curation, D.L.-B. and M.d.J.M.P.; Writing-original draft preparation, D.L.-B.;
Writing—review and editing, I.M., and D.L.-B.; Visualization, C.G.-M. and D.G.-M.; Supervision, C.O.-O. and I.M.;
Project administration, I.M., C.O.-O. and M.d.J.M.P. All authors have read and agreed to the published version of
the manuscript.
Funding: This research received no external funding.
Acknowledgments: This research was supported by CONACYT (Mexican Council for Science and Technology)
through financing scholarship granted to Daniela Lopez-Betancur.
Conflicts of Interest: The authors declare no conflict of interest.Appl. Sci. 2020, 10, 362 12 of 14
References
1. Belton, B.; Bush, S.R.; Little, D.C. Not just for the wealthy: Rethinking farmed fish consumption in the Global
South. Glob. Food Secur. 2017, 16, 85–92. [CrossRef]
2. FAO. Contributing to food security and nutrition for all. In The State of World Fisheries and Aquaculture, 2016;
FAO: Rome, Italy, 2016; p. 172.
3. Pauly, D.; Zeller, D. Comments on FAOs state of world fisheries and aquaculture (SOFIA 2016). Mar. Policy
2017, 77, 176–181. [CrossRef]
4. WWAP. The United Nations World Water Development Report 2015: Water for a Sustainable World; UNESCO:
Paris, France, 2015.
5. Arias-Moscoso, J.L.; Espinoza-Barrón, L.G.; Miranda-Baeza, A.; Rivas-Vega, M.E.; Nieves-Soto, M. Effect of
commercial probiotics addition in a biofloc shrimp farm during the nursery phase in zero water exchange.
Aquac. Rep. 2018, 11, 47–52. [CrossRef]
6. Avnimelech, Y. Feeding with microbial flocs by tilapia in minimal discharge bio-flocs technology ponds.
Aquaculture 2007, 264, 140–147. [CrossRef]
7. Avnimelech, Y.; Verdegem, M.; Kurup, M.; Keshavanath, P. Sustainable land-based aquaculture: Rational
utilization of water, land and feed resources. Mediterr. Aquac. J. 2008, 1, 45–55. [CrossRef]
8. Azim, M.E.; Little, D.C. The biofloc technology (BFT) in indoor tanks: Water quality, biofloc composition,
and growth and welfare of Nile tilapia (Oreochromis niloticus). Aquaculture 2008, 283, 29–35. [CrossRef]
9. Emerenciano, M.; Ballester, E.L.; Cavalli, R.O.; Wasielesky, W. Biofloc technology application as a food source
in a limited water exchange nursery system for pink shrimp Farfantepenaeus brasiliensis (Latreille, 1817).
Aquac. Res. 2012, 43, 447–457. [CrossRef]
10. Green, B.W.; Rawles, S.D.; Webster, C.D.; McEntire, M.E. Effect of Stocking Rate on Growing Juvenile
Sunshine Bass, Morone chrysops x M. saxatilis, in an Outdoor Biofloc Production System. J. World Aquac. Soc.
2018, 49, 827–836. [CrossRef]
11. Avnimelech, Y. Biofloc technology. In A Practical Guide Book; The World Aquaculture Society: Baton Rouge,
LA, USA, 2009; p. 182.
12. Crab, R.; Defoirdt, T.; Bossier, P.; Verstraete, W. Biofloc technology in aquaculture: Beneficial effects and
future challenges. Aquaculture 2012, 356, 351–356. [CrossRef]
13. Boeuf, G.; Le Bail, P.Y. Does light have an influence on fish growth? Aquaculture 1999, 177, 129–152. [CrossRef]
14. Ridha, M.; Cruz, E. Effect of light intensity and photoperiod on Nile tilapia Oreochromis niloticus L. seed
production. Aquac. Res. 2000, 31, 609–617. [CrossRef]
15. Moyle, P.B.; Cech, J.J. Fishes: An Introduction to Ichthyology; Pearson Prentice Hall: Upper Saddle River, NJ,
USA, 2004.
16. Heydarnejad, M.S.; Parto, M.; Pilevarian, A.A. Influence of light colours on growth and stress response of
rainbow trout (Oncorhynchus mykiss) under laboratory conditions. J. Anim. Physiol. Anim. Nutr. 2013, 97,
67–71. [CrossRef] [PubMed]
17. Karakatsouli, N.; Papoutsoglou, E.S.; Sotiropoulos, N.; Mourtikas, D.; Stigen-Martinsen, T.; Papoutsoglou, S.E.
Effects of light spectrum, rearing density and light intensity on growth performance of scaled and mirror
common carp Cyprinus carpio reared under recirculating system conditions. Aquac. Eng. 2010, 42, 121–127.
[CrossRef]
18. Ruchin, A.B. Environmental colour impact on the life of lower aquatic vertebrates: Development, growth,
physiological and biochemical processes. Rev. Aquac. 2018, 1–18. [CrossRef]
19. Ruchin, A.B. Influence of Colored Light on Growth rate of Juveniles of Fish. Fish Physiol. Biochem. 2004, 30,
175–178. [CrossRef]
20. Karakatsouli, N.; Papoutsoglou, S.E.; Pizzonia, G.; Tsatsos, G.; Tsopelakos, A.; Chadio, S.; Kalogiannis, D.;
Dalla, C.; Polissidis, A.; Papadopoulou-Daifoti, Z. Effects of light spectrum on growth and physiological status
of gilthead seabream Sparus aurata and rainbow trout Oncorhynchus mykiss reared under recirculating
system conditions. Aquac. Eng. 2007, 36, 302–309. [CrossRef]
21. Bayarri, M.; Madrid, J.; Sánchez-Vázquez, F. Influence of light intensity, spectrum and orientation on sea
bass plasma and ocular melatonin. J. Opineal Res. 2002, 32, 34–40. [CrossRef]Appl. Sci. 2020, 10, 362 13 of 14
22. Hoang, T.; Barchiesis, M.; Lee, S.Y.; Keenan, C.P.; Marsden, G.E. Influences of light intensity and photoperiod
on moulting and growth of Penaeus merguiensis cultured under laboratory conditions. Aquaculture 2003,
216, 343–354. [CrossRef]
23. Neal, R.S.; Coyle, S.D.; Tidwell, J.H.; Boudreau, B.M. Evaluation of stocking density and light level on the
growth and survival of the Pacific white shrimp, Litopenaeus vannamei, reared in zero-exchange systems.
J. World Aquac. Soc. 2010, 41, 533–544. [CrossRef]
24. Njiru, M.; Okeyo-Owuor, J.; Muchiri, M.; Cowx, I. Shifts in the food of Nile tilapia, Oreochromis niloticus (L.)
in Lake Victoria, Kenya. Afr. J. Ecol. 2004, 42, 163–170. [CrossRef]
25. Moreno, I.; Contreras, U. Color distribution from multicolor LED arrays. Opt. Express 2007, 15, 3607–3618.
[CrossRef] [PubMed]
26. Moreno, I.; Sun, C.C. Modeling the radiation pattern of LEDs. Opt. Express 2008, 16, 1808–1819. [CrossRef]
[PubMed]
27. De Schryver, P.; Crab, R.; Defoirdt, T.; Boon, N.; Verstraete, W. The basics of bio-flocs technology: The added
value for aquaculture. Aquaculture 2008, 277, 125–137. [CrossRef]
28. Crab, R.; Kochva, M.; Verstraete, W.; Avnimelech, Y. Bio-flocs technology application in over-wintering of
tilapia. Aquac. Eng. 2009, 40, 105–112. [CrossRef]
29. Poli, M.A.; Legarda, E.C.; de Lorenzo, M.A.; Martins, M.A.; do Nascimento Vieira, F. Pacific white shrimp
and Nile tilapia integrated in a biofloc system under different fish-stocking densities. Aquaculture 2019, 498,
83–89. [CrossRef]
30. Boyd, C.E.; Tucker, C.S. Pond Aquaculture Water Quality Management; Springer Science and Business Media:
Medford, MA, USA, 2012; ISBN 978-1-4615-5407-3.
31. Mansour, A.T.; Esteban, M.Á. Effects of carbon sources and plant protein levels in a biofloc system on growth
performance, and the immune and antioxidant status of Nile tilapia (Oreochromis niloticus). Fish Shellfish.
Immunol. 2017, 64, 202–209. [CrossRef]
32. Nhi, N.H.Y.; Da, C.T.; Lundh, T.; Lan, T.T.; Kiessling, A. Comparative evaluation of Brewer’s yeast as
a replacement for fishmeal in diets for tilapia (Oreochromis niloticus), reared in clear water or biofloc
environments. Aquaculture 2018, 495, 654–660. [CrossRef]
33. AOAC. Official Methods of Analysis of AOAC International, 18th ed.; AOAC International: Gaithersburg, MD,
USA, 2005.
34. NMX Water Analysis-Measurement of Extractables Fats and Oils in Natural Waters, Wastewaters and Treated
Wastewaters; Diario Oficial de la Federacion de la Secretaria de Economia del Gobierno de Mexico: Ciudad
de Mexico, CDMX, Mexico, 2013.
35. Azaza, M.; Dhraief, M.; Kraiem, M. Effects of water temperature on growth and sex ratio of juvenile Nile
tilapia Oreochromis niloticus (Linnaeus) reared in geothermal waters in southern Tunisia. J. Therm. Biol. 2008,
33, 98–105. [CrossRef]
36. El-Sayed, A.F.M.; Kawanna, M. Optimum water temperature boosts the growth performance of Nile tilapia
(Oreochromis niloticus) fry reared in a recycling system. Aquac. Res. 2008, 39, 670–672. [CrossRef]
37. Evans, J.J.; Shoemaker, C.A.; Klesius, P.H. Effects of sublethal dissolved oxygen stress on blood glucose and
susceptibility to Streptococcus agalactiae in Nile tilapia Oreochromis niloticus. J. Aquat. Anim. Health 2003, 15,
202–208. [CrossRef]
38. El-Sherif, M.S.; El-Feky, A.M.I. Performance of Nile tilapia (Oreochromis niloticus) fingerlings. I. Effect of pH.
Int. J. Agric. Biol. 2009, 11, 297–300.
39. Zeitoun, M.M.; EL-Azrak, K.E.D.M.; Zaki, M.A.; Nemat-Allah, B.R.; Mehana, E.S.E. Effects of ammonia
toxicity on growth performance, cortisol, glucose and hematological response of Nile Tilapia (Oreochromis
niloticus). Aceh. J. Anim. Sci. 2016, 1, 21–28. [CrossRef]
40. El-Shafai, S.A.; El-Gohary, F.A.; Nasr, F.A.; van der Steen, N.P.; Gijzen, H.J. Chronic ammonia toxicity to
duckweed-fed tilapia (Oreochromis niloticus). Aquaculture 2004, 232, 117–127. [CrossRef]
41. Volpato, G.L.; Bovi, T.S.; de Freitas, R.H.; da Silva, D.F.; Delicio, H.C.; Giaquinto, P.C.; Barreto, R.E. Red light
stimulates feeding motivation in fish but does not improve growth. PLoS ONE 2013, 8, e59134. [CrossRef]
42. Karakatsouli, N.; Papoutsoglou, S.E.; Panopoulos, G.; Papoutsoglou, E.S.; Chadio, S.; Kalogiannis, D. Effects
of light spectrum on growth and stress response of rainbow trout Oncorhynchus mykiss reared under
recirculating system conditions. Aquac. Eng. 2008, 38, 36–42. [CrossRef]Appl. Sci. 2020, 10, 362 14 of 14
43. Luchiari, A.; Freire, F. Effects of environmental colour on growth of Nile tilapia, Oreochromis niloticus
(Linnaeus, 1758), maintained individually or in groups. J. Appl. Ichthyol. 2009, 25, 162–167. [CrossRef]
44. Volpato, G.L.; Barreto, R. Environmental blue light prevents stress in the fish Nile tilapia. Braz. J. Med.
Biol. Res. 2001, 34, 1041–1045. [CrossRef]
45. Aly, H.; Abdel-Rahim, M.; Lotfy, A.; Abdelaty, B. Impact of Different Colors of Artificial Light on Pigmentation
and Growth Performance of Hybrid Red Tilapia (Oreochromis mosambicus x O. hornorum) Reared in Saline
Well Water. J. Mar. Sci. Res. Dev. 2017, 7, 229. [CrossRef]
46. Sabri, D.M.; Elnwishy, N.; Nwonwu, F. Effect of environmental color on the behavioral and physiological
response of Nile tilapia, Oreochromis niloticus. Glob. J. Front. Res. 2012, 12, 11–20.
47. Douglas, R.H.; Hawryshyn, C.W. Behavioural studies of fish vision: An analysis of visual capabilities.
In The Visual System of Fish; Douglas, R., Djamgoz, M., Eds.; Springer: Dordrecht, The Netherlands, 1990;
pp. 373–418. ISBN 978-94-009-0411-8.
48. Younis, E.S.M.; Al-Quffail, A.S.; Al-Asgah, N.A.; Abdel-Warith, A.W.A.; Al-Hafedh, Y.S. Effect of dietary fish
meal replacement by red algae, Gracilaria arcuata, on growth performance and body composition of Nile
tilapia Oreochromis niloticus. Saudi J. Biol. Sci. 2018, 25, 198–203. [CrossRef]
49. He, A.Y.; Ning, L.J.; Chen, L.Q.; Chen, Y.L.; Xing, Q.; Li, J.M.; Qiao, F.; Li, D.L.; Zhang, M.L.; Du, Z.Y. Systemic
adaptation of lipid metabolism in response to low- and high-fat diet in Nile tilapia (Oreochromis niloticus).
Physiol. Rep. 2015, 3, e12485. [CrossRef] [PubMed]
50. Moreno, I.; Ramos-Romero, I.R. Light spectrum for maximum luminous efficacy of radiation and high color
quality. In Current Developments in Lens Design and Optical Engineering XIX; International Society for Optics
and Photonics: Bellingham, WA, USA, 2018; Volume 10745.
© 2020 by the authors. Licensee MDPI, Basel, Switzerland. This article is an open access
article distributed under the terms and conditions of the Creative Commons Attribution
(CC BY) license (http://creativecommons.org/licenses/by/4.0/).You can also read