Attractive entry point for BMED, upgrade to Buy; FBK down to Neutral
←
→
Page content transcription
If your browser does not render page correctly, please read the page content below
14 January 2021 | 10:05PM GMT
Italy Asset Managers
Attractive entry point for BMED, upgrade to Buy; FBK
down to Neutral
While we acknowledge that the political backdrop in Italy is uncertain, we Roberta De Luca
+44(20)7051-2264 |
reassess our estimates for the Italian asset gatherers into 4Q20 earnings. We roberta.deluca@gs.com
Goldman Sachs International
upgrade BMED to Buy (from Neutral) with a TSR of 25.6% (new PT €8.70 from
Charles Mayne
€7.70 previously); we believe the stock’s P/E multiple compression (-1.5x since +44(20)7774-4628 |
charles.mayne@gs.com
Aug-20) implies that the market is underestimating BMED’s potential earnings Goldman Sachs International
For the exclusive use of NICOLE.ZANCANELLA@COMMUNITYGROUP.IT
growth derived from its high exposure to equity markets as well as its
stronger-than-expected operational results in 2020. We downgrade FBK to
Neutral (new PT €14.70 from €14.20 previously) as we see limited upside to
FBK’s valuation from the current NTM P/E of 27.6x (Datastream consensus). We
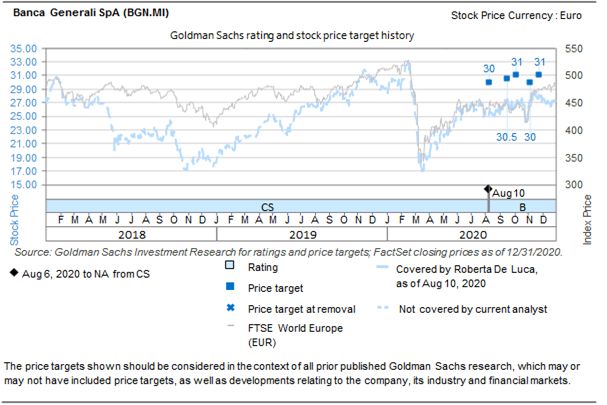
also increase our estimates for AZMT and BGN by an average of 5.2% over
2020-22, driving increases in AZMT’s PT to €21.10 (from €20.3) and BGN’s to
€32.50 (from €31.0). Since being added to the Buy List on August 10, 2020, FBK
shares are up by 10.5% vs. the FTSE World Europe up 12.5%; we believe the
narrow underperformance was driven by decreasing rates in 2H driving a
marginal negative impact on FBK’s earnings.
1. BMED: Equity exposure supports AuM growth. We believe the market is
underestimating the positive impact on BMED’s 2020E and 2021E earnings from
the strong rally in European and US equity markets in 4Q20 (Euro STOXX 600 up
11% and S&P 500 up 12%) and the positive expectations GS strategists have for
8ca1e8f0991046b0a28d4408a62e3240
2021 (see here). With c.50% of Mutual Funds invested in equity (GS FY20
estimate) we believe BMED will be the main beneficiary of this trend relative to
Italian asset gatherer peers, which on our estimates supports 9% EPS growth in
4Q20E and an 18% CAGR over 2020-22E, while the current market valuation
implies -1.5x P/E multiple compression since last August.
2. Flows accelerated in December, leading to strong organic growth for
FY20E. Strong AuM flows reported for December for the asset gatherers
conclude a year that has seen an acceleration of their market share gains at the
expense of small local banks, with capital moving towards more digital,
client-centric services able to support clients throughout the market volatility. We
expect this trend to be sustained and benefit the four companies in our
coverage, led by FBK (25% flows market share in 2020E).
Goldman Sachs does and seeks to do business with companies covered in its research reports. As a result,
investors should be aware that the firm may have a conflict of interest that could affect the objectivity of this
report. Investors should consider this report as only a single factor in making their investment decision. For Reg AC
certification and other important disclosures, see the Disclosure Appendix, or go to
www.gs.com/research/hedge.html. Analysts employed by non-US affiliates are not registered/qualified as research
analysts with FINRA in the U.S.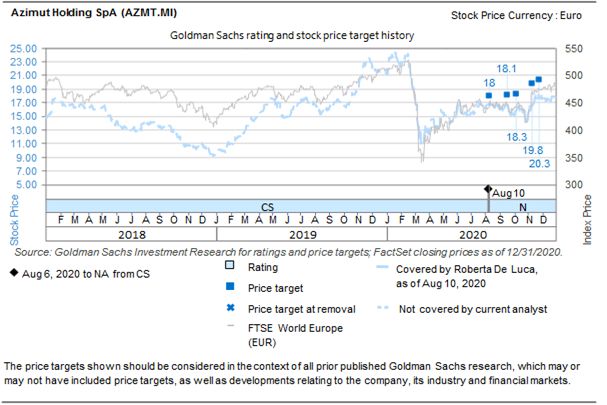
Goldman Sachs                                                                            Italy Asset Managers

                                                                                 3. Organic AuM growth to remain strong despite the macro environment. While
                                                                                    we acknowledge that the political backdrop in Italy is uncertain, we note that the
                                                                                    asset managers’ sensitivity to political tensions in the Italian government has been
                                                                                    relatively muted historically, with our four coverage companies posting consistent
                                                                                    strong organic AuM growth since at least 2013. We therefore expect the organic
                                                                                    growth of the companies to remain solid (avg. organic AuM growth over 2021-23E of
                                                                                    5.7%). This will be driven in our view by the growth initiatives launched by each
                                                                                    company, supported by their continued market share gains.
For the exclusive use of NICOLE.ZANCANELLA@COMMUNITYGROUP.IT

                                                                                                                                                                               8ca1e8f0991046b0a28d4408a62e3240

                                                               14 January 2021                                                                                            2
Goldman Sachs Italy Asset Managers
Market dynamics favor BMED, while sector earnings growth should
remain strong
With the strong equity market performance in Europe and the US over 4Q20 and
expected for most of 2021 on GS estimates, we expect BMED’s earnings growth to
accelerate vs. peers thanks to its strong exposure to equity markets, which we estimate
make up c.50% of the company’s mutual funds AuM. We see the 4Q reporting
scheduled for February 9 as the first catalyst for the stock to re-rate. We expect organic
AuM growth to remain strong across our coverage, thanks to the flight to quality last
year in the midst of the pandemic, and we expect the trend to continue due to individual
growth initiatives launched by the companies. While we acknowledge that the political
backdrop in Italy is uncertain, we note that the asset gatherers’ sensitivity to political
tensions in the Italian government has been relatively muted historically, with our four
For the exclusive use of NICOLE.ZANCANELLA@COMMUNITYGROUP.IT
coverage companies posting consistent strong organic growth since at least 2013.
1. Equity exposure to support AuM growth
The last quarter of 2020 saw a strong European and US equity market rally since the
announcement of the first vaccine in November. Additionally, the potentially fast
deployment of the vaccines and hope for further stimulus by central banks has led to GS
expectations of a strong recovery in 2021. GS strategists expect the STOXX 600 and the
S&P 500 to grow by 5.1% and 12.9% respectively in 2021 (see here).
In this context, we believe the market is underestimating the positive impact of BMED’s
high exposure to equity will have on the company’s earnings. We estimate the firm has
c.50% of mutual fund and unit-linked AuM invested in equity as of end-2020, against
c.38% for AZM and c.32% for FBK. This will drive in our numbers a stronger positive
impact for BMED’s organic AuM growth, on a relative basis. We expect the investment
performance alone to drive an average annualised organic AuM growth of 6.9% for
8ca1e8f0991046b0a28d4408a62e3240
BMED over 4Q20-4Q21.
Exhibit 1: We estimate BMED has the highest exposure of the ITA Exhibit 2: ...which should support a strong positive impact from
asset gatherers to equity markets... investment performance
Equity % of AuM at end-2020E Investment performance vs. AuM
50% 25% 3.5%
3.0%
20%
40%
2.5%
15%
30% 2.0%
1.5%
10%
20%
1.0%
5%
0.5%
10%
0% 0.0%
BMED FBK AZIM BGN
0%
BMED AZMT FBK 4Q20E 2021E
BGN excluded from the analysis due to lack of data. For BMED we use the equity proportion Source: Goldman Sachs Global Investment Research
reported for mutual fund and unit-linked assets (50% in 3Q20) as a proxy for total AuM.
Source: Goldman Sachs Global Investment Research
14 January 2021 3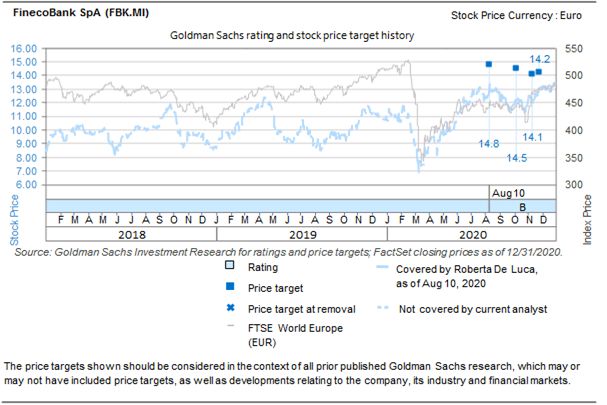
Goldman Sachs Italy Asset Managers
2. Flows accelerated in December, leading to a strong organic AuM growth for FY20
In December the four firms in our coverage — AZM, BGN, BMED and FBK — reported
strong sales, supported by the positive market environment. The highest AuM organic
growth was posted by FBK, delivering €791 mn of sales in AuM, followed by BGN and
BMED. This closes 2020 with strong operating performance for all the companies,
despite the spikes in volatility and market uncertainty.
The Italian asset gatherers under our coverage continued to benefit throughout the year
from the macro trends we discussed in our initiation report. The pandemic led to a
search for quality within the Italian asset management space. Following bank branch
closures in March/April 2020 and on the back of continued lockdowns, the asset
gatherers managed to gain market share from small local banks thanks to their flexibility,
client-centric businesses and higher levels of digitalisation of their services. This
resulted in FBK capturing 25% of the market share in 2020 from an initial AuM market
share of 9% registered in December 2019. Similarly, BGN and BMED captured 19% and
For the exclusive use of NICOLE.ZANCANELLA@COMMUNITYGROUP.IT
20% of the Italian financial network sales from an initial market share of 11% and 14%
respectively.
We expect this trend to continue in the medium term as we see the effects of COVID
as an accelerator of the digitalisation trend within the Italian banks market.
Exhibit 3: The reported December organic AuM growth was strong Exhibit 4: Market share growth accelerated throughout the year
across the board AuM market share in Dec-19 vs. Jan-Nov 2020 flows market share
AuM organic growth (Dec-20, annualised)
25%
23%
25%
20%
18% 20%
19%
16%
15% 13% 14%
11%
10% 9%
10%
8ca1e8f0991046b0a28d4408a62e3240
6%
5%
AZM BGN BMED FBK
0%
FBK BGN BMED AZM AuM mkt share, Dec-19 Mkt share of Jan-Nov flows
Source: Company data, Goldman Sachs Global Investment Research Source: Assoreti, Company data, Goldman Sachs Global Investment Research
3. Organic growth to remain strong despite the macro environment
We believe the flight to quality in the Italian financial markets, coupled with the
numerous initiatives launched by the four companies, will drive solid organic growth
over the coming years. While acknowledging the recent tension with the ruling coalition,
we note that the asset gatherers’ sensitivity to political tensions in the Italian
government has been relatively muted historically, with our four companies posting
consistent strong organic growth since at least 2013.
We believe FBK will continue to see the highest AuM organic growth (8.5% annual
organic growth on AuM in 2021-23E) driven by its complete offering of a fully integrated
digital bank with highly competitive and transparent pricing. We also see the growth of
Fineco Asset Management (FAM) accelerating, providing additional support to AuM
14 January 2021 4Goldman Sachs Italy Asset Managers
growth.
We expect BGN to deliver an average annual organic growth of 6.1% over the same
period, supported by the group’s strong hiring efforts, the robust pipeline of Lux IM
(in-house asset management products) and by the innovative product offering in
Switzerland. Additionally, we see the growth in the insurance space accelerating thanks
to the increasing demand in the space and the recent initiatives launched by the group.
We expect BMED to organically grow AuM at 5.2% annually on average over 2021-23
thanks to the continuous launch of new products within the asset management arm of
the group that effectively targets changes in client needs, and to the strong marketing
campaigns that have been driving continued growth in recent years. Additionally, we
remain bullish on the insurance growth of BMED, which started adding insurance
experts to its distribution network in order to increase the insurance coverage of its
clientele. The group targets a total of €400 mn in insurance premiums generating c.€120
For the exclusive use of NICOLE.ZANCANELLA@COMMUNITYGROUP.IT
mn of annual insurance revenues by 2024.
Finally, we see AZM organically growing AuM at c.3% over 2021-23 as the company
does not have the full benefit of the banking operations the other peers leverage on, and
as we continue to expect a slight deceleration in the organic growth due to the
transition the company is making to increase its efforts in private markets.
Exhibit 5: We expect AuM organic growth to continue to be the
highest for FBK
AuM organic growth (%)
12.0%
10.0%
8.0%
6.0%
8ca1e8f0991046b0a28d4408a62e3240
4.0%
2.0%
0.0%
FBK BGN BMED AZIM
2020 Avg 2021E-23E
Source: Company data, Goldman Sachs Global Investment Research
Estimate changes
The recently reported December flows, in addition to the positive impact we expect
from the 4Q20 equity market rally, drive a c.9% increase in our estimates for BMED
(2020-22E). Additionally, we increase the earnings of AZM on the back of the company’s
preview of its FY20 net income which it expects to be higher than in 2019. However, we
expect most of the upside on AZM to come from performance fees, therefore only
affecting 2020E earnings. Finally, we make minor adjustments on BGN and FBK
earnings to reflect the December flows reported and the market moves.
14 January 2021 5Goldman Sachs Italy Asset Managers
Exhibit 6: Summary of estimate and 12m price target changes
Price 12M PT Upside/ 2020E EPS (new) EPS (old) New vs. old (%)
Company Cur. Rating Cur.
Current New Old % Downsid divi yield 2020E 2021E 2022E 2020E 2021E 2022E 2020E 2021E 2022E
Azimut € 18.9 Neutral 21.10 20.30 3.9% 11.6% 6.3% € 2.12 1.92 1.92 1.91 1.83 1.87 11.3% 4.8% 2.8%
Banca Mediolanum € 7.2 Buy 8.70 7.70 13.0% 20.1% 5.5% € 0.50 0.64 0.69 0.49 0.58 0.61 2.9% 10.9% 13.6%
Banca Generali € 27.3 Buy 32.50 31.00 4.8% 19.1% 5.6% € 2.15 2.37 2.45 2.13 2.24 2.31 1.0% 5.6% 5.7%
FinecoBank € 13.9 Neutral 14.70 14.20 3.5% 5.8% 2.8% € 0.55 0.58 0.64 0.54 0.57 0.62 0.4% 3.2% 3.1%
Source: Datastream, Goldman Sachs Global Investment Research
Key financials
Exhibit 7: FinecoBank key financials
€ mn 2019 2020E 2021E 2022E 2023E 2024E Key profitability ratios 2019 2020E 2021E 2022E 2023E 2024E
AuA 81,419 91,709 101,903 113,235 122,528 132,590 As percentage of average AuA
- managed assets 40,505 45,382 51,111 57,364 62,187 67,422 Gross fee income
- under custody 40,913 46,328 50,792 55,871 60,341 65,168 - management fees 1.22% 1.15% 1.22% 1.20% 1.20% 1.20%
For the exclusive use of NICOLE.ZANCANELLA@COMMUNITYGROUP.IT
Net inflows 5,840 9,282 8,706 9,630 7,388 7,996 - performance fees
FAs 2,541 2,582 2,592 2,612 2,632 2,652 - other fees
Net fee income 0.87% 0.90% 0.83% 0.80% 0.78% 0.77%
AuA / FAs (mn) 32.0 35.5 39.3 43.4 46.6 50.0 Net revenue 0.87% 0.90% 0.83% 0.80% 0.78% 0.77%
Managed assets / AuA 50% 49% 50% 51% 51% 51% Pre-tax profit 0.51% 0.55% 0.52% 0.51% 0.51% 0.51%
RoAuA 0.36% 0.38% 0.37% 0.36% 0.36% 0.36%
Income statement 2019 2020E 2021E 2022E 2023E 2024E
Net commissions 325 403 450 497 547 595 Commission pay out - - - - - -
Net interest income 281 274 260 263 269 273 C / I ratio 38% 34% 33% 32% 31% 30%
Trading profit 48 99 89 98 108 119 Tax rate 30% 30% 29% 29% 29% 29%
Other fees 4 2 1 1 1 1
Net revenues 658 778 801 859 924 987 Growth rates 2019 2020E 2021E 2022E 2023E 2024E
Net fee income 658 778 801 859 924 987 AuA growth 17% 13% 11% 11% 8% 8%
Other income 0 0 0 0 0 0 net inflows 8% 11% 9% 9% 7% 7%
Net revenues 658 778 801 859 924 987 market performance 9% 1% 2% 2% 2% 2%
Operating costs -250 -262 -265 -273 -282 -291 FAs -1% 2% 0% 1% 1% 1%
Operating profit 408 516 536 586 642 696 Revenue 5% 18% 3% 7% 8% 7%
Other items -22 -44 -35 -37 -39 -41 Net commissions 8% 24% 12% 10% 10% 9%
Pre-tax profit 386 473 501 549 603 655 Net interest income 1% -2% -5% 1% 2% 1%
8ca1e8f0991046b0a28d4408a62e3240
Taxes -118 -139 -145 -159 -175 -190 Costs 2% 5% 1% 3% 3% 3%
Net income statutory 269 333 356 390 428 465 Net income 10% 24% 7% 10% 10% 9%
Source: Company data, Goldman Sachs Global Investment Research
14 January 2021 6Goldman Sachs Italy Asset Managers
Exhibit 8: Banca Mediolanum key financials
€ mn 2019 2020E 2021E 2022E 2023E 2024E Key profitability ratios 2019 2020E 2021E 2022E 2023E 2024E
AuA 84,716 93,569 100,796 107,720 114,928 122,539 As percentage of average AuA
- managed assets 61,604 66,574 71,932 77,125 82,558 88,389 Gross fee income 2.37% 1.77% 1.88% 1.87% 1.87% 1.86%
- other assets 23,112 26,995 28,863 30,595 32,370 34,150 - management fees 1.29% 1.19% 1.25% 1.24% 1.23% 1.22%
Net inflows 4,064 7,716 5,029 5,287 5,456 5,739 - performance fees 0.54% 0.07% 0.12% 0.12% 0.12% 0.12%
FAs 5,197 5,377 5,405 5,435 5,465 5,495 - other fees 0.54% 0.51% 0.51% 0.52% 0.52% 0.53%
Net fee income 1.49% 0.98% 1.04% 1.05% 1.05% 1.05%
AuA / FAs (mn) 16.3 17.4 18.6 19.8 21.0 22.3 Net revenue 1.90% 1.29% 1.31% 1.29% 1.28% 1.27%
Managed assets / AuA 73% 71% 71% 72% 72% 72% Pre-tax profit 0.93% 0.52% 0.62% 0.62% 0.63% 0.64%
RoAuA 0.71% 0.41% 0.49% 0.49% 0.50% 0.50%
Income statement 2019 2020E 2021E 2022E 2023E 2024E
Management fees 1,027 1,063 1,216 1,288 1,364 1,448 Commission pay out 61% 62% 64% 64% 64% 64%
Performance fees 425 59 115 124 132 142 C / I ratio 43% 58% 54% 52% 51% 50%
Other fees 432 456 498 539 583 624 Tax rate 23% 21% 21% 21% 21% 21%
Gross fee income 1,883 1,579 1,829 1,951 2,080 2,213
For the exclusive use of NICOLE.ZANCANELLA@COMMUNITYGROUP.IT
Commission expenses -625 -661 -778 -825 -873 -927 Growth Rates (yoy %) 2019 2020E 2021E 2022E 2023E 2024E
Net fee income 1,258 917 1,051 1,126 1,207 1,287 AuA growth 14% 10% 8% 7% 7% 7%
Other income 251 232 225 223 220 217 net inflows 5% 9% 5% 5% 5% 5%
Net revenues 1,509 1,149 1,276 1,349 1,427 1,504 market performance 9% 1% 2% 2% 2% 2%
Operating costs -654 -667 -683 -707 -728 -751 FAs -1% 3% 1% 1% 1% 1%
Operating profit 856 481 593 642 699 753 Revenue 44% -24% 11% 6% 6% 5%
Other items -117 -21 8 8 8 8 Management fees 3% 4% 14% 6% 6% 6%
Pre-tax profit 739 461 601 650 707 761 Performance fees 203% -86% 94% 8% 7% 7%
Taxes -174 -98 -128 -139 -151 -163 Costs 6% 2% 2% 3% 3% 3%
Net income statutory 565 363 473 511 556 598 Net income 121% -36% 30% 8% 9% 8%
Source: Company data, Goldman Sachs Global Investment Research
8ca1e8f0991046b0a28d4408a62e3240
14 January 2021 7Goldman Sachs Italy Asset Managers
Valuation and risks
Since last August, the share prices of the four Italian asset gatherers in our coverage
increased by 11% but their multiples compressed on average by 0.4x. Notably, FBK is
the only name that enjoyed a significant margin expansion (1.7x). Its share price gained
roughly 10% while its earnings suffered from headwinds on NII which have a more
significant weight on the firm vs. peers (35% of total earnings).
FBK: Downgrade to Neutral (from Buy). We remain bullish on the organic AuM growth
prospects of FBK, and we continue to expect an 8.5% average organic growth on AuM
over 2021-23 and a further 3% revenue CAGR in its broking business over the forecast
period to 2024E from the highest-ever reported broking results in 2020. However, we
believe the growth is fully captured in the stock’s current valuation of 27.6x NTM P/E on
Datastream consensus earnings. We therefore downgrade our rating to Neutral (from
For the exclusive use of NICOLE.ZANCANELLA@COMMUNITYGROUP.IT
Buy) while updating our PT to €14.70 (from €14.20 previously).
BMED: Upgrade to Buy (from Neutral). We believe that the P/E multiple compression
we have seen on BMED since last August (1.5x) is not justified in light of the positive
AuM organic growth we expect the company will deliver over the forecast period to
2024E in its investing business and also the tailwind provided by the equity market
performance in 4Q20 and expected to continue in 2021, which historically has had a
particularly positive effect on BMED vs. peers. We estimate the company’s total AuM
organic growth in 4Q20 of 8% (31% annualised) and the strong performance of the
equity markets should ensure sustained fee margins throughout 2021, supporting the
top line. This results in EPS growth of 9% for 4Q20E alone in our numbers. Given the
higher-than-expected operational results reported in FY20 and the strong performance of
equity markets in 4Q20, we increase our earnings by c.9% on average in 2020-22E and
raise our PT to €8.70 (from €7.70 previously). With the stock currently at €7.2, 13x its
NTM P/E (Datastream consensus), we see this as an attractive entry point for BMED
8ca1e8f0991046b0a28d4408a62e3240
and upgrade our rating to Buy.
Exhibit 9: FBK is the only stock in our coverage that saw multiple Exhibit 10: ...despite its strong reliance on NII on total revenues
expansion in 2020... NII as % of net revenues in 2020E
NTM P/E
30.0x
40%
35%
25.0x 35%
20.0x 30%
25%
15.0x 21%
20%
16%
10.0x
15%
5.0x 10%
5%
0.0x
Jul-20
Aug-20
Nov-20
Jan-20
Feb-20
Jun-20
Sep-20
Jan-21
Mar-20
Apr-20
May-20
Dec-20
Oct-20
0%
BGN BMED FBK
AZMT BMED BGN FBK NII as % of net revs
Source: Datastream Azimut excluded as it has no banking operations
Source: Company data, Goldman Sachs Global Investment Research
14 January 2021 8Goldman Sachs Italy Asset Managers
Valuation and risks
Azimut (Neutral):
n Valuation: Our 12-month P/E-based price target is €21.10 (from €20.3), applying an
11x multiple to average 2021/22E EPS (unchanged) and implies 12% upside.
n Risks: The main upside and downside risks to our investment case are higher/lower
flows, especially in relation to the private markets segment, a better- or worse-than
expected macro environment, and better- or worse- than expected emerging market
performance.
Banca Generali (Buy):
n Valuation: Our 12-month P/E-based price target is €32.50 (from €31.0), using a
13.5x multiple applied to average 2021/22E EPS (unchanged), and implies 19%
upside from current market levels.
For the exclusive use of NICOLE.ZANCANELLA@COMMUNITYGROUP.IT
n Risks: The main downside risks to our investment case are a worsening macro
environment, lower-than-expected demand for Lux IM, lack of demand in
Switzerland, adverse regulation and technological issues.
Banca Mediolanum (Buy, up from Neutral):
n Valuation: Our 12-month P/E-based price target is €8.70 (from €7.7), applying a 13x
multiple to average 2021/22E EPS (unchanged), and implies 20% upside.
n Risks:
o Worse-than-expected macro environment. A worsening in the macro
environment that is quicker or more accentuated than we expect could result
in lower organic growth for the company and a deterioration in market
performance, decreasing AuM and therefore earnings for BMED.
o Lower-than-expected flows. Lower inflows in to BMED assets, especially in
8ca1e8f0991046b0a28d4408a62e3240
the insurance business, could result in lower-than-expected organic growth of
total AuM, affecting earnings and having a direct impact on valuation.
o Possible stock overhang. The potential stock disposal by large stakeholders
could represent a risk to the valuation of the company.
14 January 2021 9Goldman Sachs Italy Asset Managers
FinecoBank (Neutral, down from Buy):
n Valuation: Our 12-month P/E based price target is €14.70 (from €14.2), using a 24x
multiple applied to an average of 2021-22E EPS (unchanged), and implies 6%
upside.
n Risks:
o Better- or worse-than-expected macro environment. An improving or
worsening macro environment could result in higher or lower organic growth
for the company.
o Higher- or lower-than-expected demand for Fineco Asset Management.
Improving or worsening performance of the FAM funds could result in higher-
or lower-than-expected organic growth and penetration of total AuM in the
short to medium term, affecting earnings and having a direct impact on
valuation.
For the exclusive use of NICOLE.ZANCANELLA@COMMUNITYGROUP.IT
o Higher or lower volatility. A sharp decrease in volatility would negatively
affect the broking revenue growth we model, affecting earnings and valuation.
o Higher- or lower-than-expected UK growth. Fluctuations in the growth of
Fineco UK could have a significant impact on the UK revenue we currently
estimate.
o Competition. Currently, there are few players that offer the fully integrated
multi-channel platform that FBK does – this could change, however, which
would potentially have a negative impact on FBK’s market share prospects
and growth potential in Italy and the UK.
Pricing in this report is as of January 13, 2021, unless otherwise indicated.
8ca1e8f0991046b0a28d4408a62e3240
14 January 2021 10Goldman Sachs Italy Asset Managers
Disclosure Appendix
Reg AC
We, Roberta De Luca and Charles Mayne, hereby certify that all of the views expressed in this report accurately reflect our personal views about the
subject company or companies and its or their securities. We also certify that no part of our compensation was, is or will be, directly or indirectly,
related to the specific recommendations or views expressed in this report.
Unless otherwise stated, the individuals listed on the cover page of this report are analysts in Goldman Sachs’ Global Investment Research division.
GS Factor Profile
The Goldman Sachs Factor Profile provides investment context for a stock by comparing key attributes to the market (i.e. our coverage universe) and its
sector peers. The four key attributes depicted are: Growth, Financial Returns, Multiple (e.g. valuation) and Integrated (a composite of Growth, Financial
Returns and Multiple). Growth, Financial Returns and Multiple are calculated by using normalized ranks for specific metrics for each stock. The
normalized ranks for the metrics are then averaged and converted into percentiles for the relevant attribute. The precise calculation of each metric may
vary depending on the fiscal year, industry and region, but the standard approach is as follows:
Growth is based on a stock’s forward-looking sales growth, EBITDA growth and EPS growth (for financial stocks, only EPS and sales growth), with a
higher percentile indicating a higher growth company. Financial Returns is based on a stock’s forward-looking ROE, ROCE and CROCI (for financial
stocks, only ROE), with a higher percentile indicating a company with higher financial returns. Multiple is based on a stock’s forward-looking P/E, P/B,
price/dividend (P/D), EV/EBITDA, EV/FCF and EV/Debt Adjusted Cash Flow (DACF) (for financial stocks, only P/E, P/B and P/D), with a higher percentile
indicating a stock trading at a higher multiple. The Integrated percentile is calculated as the average of the Growth percentile, Financial Returns
For the exclusive use of NICOLE.ZANCANELLA@COMMUNITYGROUP.IT
percentile and (100% - Multiple percentile).
Financial Returns and Multiple use the Goldman Sachs analyst forecasts at the fiscal year-end at least three quarters in the future. Growth uses inputs
for the fiscal year at least seven quarters in the future compared with the year at least three quarters in the future (on a per-share basis for all metrics).
For a more detailed description of how we calculate the GS Factor Profile, please contact your GS representative.
M&A Rank
Across our global coverage, we examine stocks using an M&A framework, considering both qualitative factors and quantitative factors (which may vary
across sectors and regions) to incorporate the potential that certain companies could be acquired. We then assign a M&A rank as a means of scoring
companies under our rated coverage from 1 to 3, with 1 representing high (30%-50%) probability of the company becoming an acquisition target, 2
representing medium (15%-30%) probability and 3 representing low (0%-15%) probability. For companies ranked 1 or 2, in line with our standard
departmental guidelines we incorporate an M&A component into our target price. M&A rank of 3 is considered immaterial and therefore does not
factor into our price target, and may or may not be discussed in research.
Quantum
Quantum is Goldman Sachs’ proprietary database providing access to detailed financial statement histories, forecasts and ratios. It can be used for
in-depth analysis of a single company, or to make comparisons between companies in different sectors and markets.
Disclosures
The rating(s) for Azimut Holding SpA, Banca Generali SpA, Banca Mediolanum SpA and FinecoBank SpA is/are
relative to the other companies in its/their coverage universe:
Amundi, Anima Holding SpA, Ashmore Group, Azimut Holding SpA, Banca Generali SpA, Banca Mediolanum SpA, CMC Markets Plc, DWS Group, EQT
AB, FinecoBank SpA, FlatexDEGIRO AG, Man Group, Partners Group, Schroders, Standard Life Aberdeen Plc
8ca1e8f0991046b0a28d4408a62e3240
Company-specific regulatory disclosures
The following disclosures relate to relationships between The Goldman Sachs Group, Inc. (with its affiliates, “Goldman Sachs”) and companies covered
by the Global Investment Research Division of Goldman Sachs and referred to in this research.
Goldman Sachs beneficially owned 1% or more of common equity (excluding positions managed by affiliates and business units not required to be
aggregated under US securities law) as of the month end preceding this report: FinecoBank SpA (€13.84)
Goldman Sachs has received compensation for investment banking services in the past 12 months: Banca Generali SpA (€26.96) and FinecoBank SpA
(€13.84)
Goldman Sachs expects to receive or intends to seek compensation for investment banking services in the next 3 months: Azimut Holding SpA
(€18.58), Banca Generali SpA (€26.96), Banca Mediolanum SpA (€7.20) and FinecoBank SpA (€13.84)
Goldman Sachs had an investment banking services client relationship during the past 12 months with: Banca Generali SpA (€26.96) and FinecoBank
SpA (€13.84)
Goldman Sachs had a non-investment banking securities-related services client relationship during the past 12 months with: Banca Generali SpA
(€26.96)
Goldman Sachs had a non-securities services client relationship during the past 12 months with: Azimut Holding SpA (€18.58), Banca Generali SpA
(€26.96), Banca Mediolanum SpA (€7.20) and FinecoBank SpA (€13.84)
Distribution of ratings/investment banking relationships
Goldman Sachs Investment Research global Equity coverage universe
Rating Distribution Investment Banking Relationships
Buy Hold Sell Buy Hold Sell
Global 49% 35% 16% 64% 57% 54%
14 January 2021 11Goldman Sachs Italy Asset Managers
As of January 1, 2021, Goldman Sachs Global Investment Research had investment ratings on 3,072 equity securities. Goldman Sachs assigns stocks
as Buys and Sells on various regional Investment Lists; stocks not so assigned are deemed Neutral. Such assignments equate to Buy, Hold and Sell for
the purposes of the above disclosure required by the FINRA Rules. See ‘Ratings, Coverage universe and related definitions’ below. The Investment
Banking Relationships chart reflects the percentage of subject companies within each rating category for whom Goldman Sachs has provided
investment banking services within the previous twelve months.
Price target and rating history chart(s)
For the exclusive use of NICOLE.ZANCANELLA@COMMUNITYGROUP.IT
8ca1e8f0991046b0a28d4408a62e3240
Regulatory disclosures
Disclosures required by United States laws and regulations
See company-specific regulatory disclosures above for any of the following disclosures required as to companies referred to in this report: manager or
co-manager in a pending transaction; 1% or other ownership; compensation for certain services; types of client relationships; managed/co-managed
public offerings in prior periods; directorships; for equity securities, market making and/or specialist role. Goldman Sachs trades or may trade as a
principal in debt securities (or in related derivatives) of issuers discussed in this report.
The following are additional required disclosures: Ownership and material conflicts of interest: Goldman Sachs policy prohibits its analysts,
professionals reporting to analysts and members of their households from owning securities of any company in the analyst’s area of coverage.
Analyst compensation: Analysts are paid in part based on the profitability of Goldman Sachs, which includes investment banking revenues. Analyst
as officer or director: Goldman Sachs policy generally prohibits its analysts, persons reporting to analysts or members of their households from
serving as an officer, director or advisor of any company in the analyst’s area of coverage. Non-U.S. Analysts: Non-U.S. analysts may not be
associated persons of Goldman Sachs & Co. LLC and therefore may not be subject to FINRA Rule 2241 or FINRA Rule 2242 restrictions on
communications with subject company, public appearances and trading securities held by the analysts.
Distribution of ratings: See the distribution of ratings disclosure above. Price chart: See the price chart, with changes of ratings and price targets in
prior periods, above, or, if electronic format or if with respect to multiple companies which are the subject of this report, on the Goldman Sachs
website at https://www.gs.com/research/hedge.html.
Additional disclosures required under the laws and regulations of jurisdictions other than the United States
The following disclosures are those required by the jurisdiction indicated, except to the extent already made above pursuant to United States laws and
regulations. Australia: Goldman Sachs Australia Pty Ltd and its affiliates are not authorised deposit-taking institutions (as that term is defined in the
Banking Act 1959 (Cth)) in Australia and do not provide banking services, nor carry on a banking business, in Australia. This research, and any access to
it, is intended only for “wholesale clients” within the meaning of the Australian Corporations Act, unless otherwise agreed by Goldman Sachs. In
producing research reports, members of the Global Investment Research Division of Goldman Sachs Australia may attend site visits and other
meetings hosted by the companies and other entities which are the subject of its research reports. In some instances the costs of such site visits or
meetings may be met in part or in whole by the issuers concerned if Goldman Sachs Australia considers it is appropriate and reasonable in the specific
circumstances relating to the site visit or meeting. To the extent that the contents of this document contains any financial product advice, it is general
advice only and has been prepared by Goldman Sachs without taking into account a client’s objectives, financial situation or needs. A client should,
14 January 2021 12Goldman Sachs Italy Asset Managers
before acting on any such advice, consider the appropriateness of the advice having regard to the client’s own objectives, financial situation and needs.
A copy of certain Goldman Sachs Australia and New Zealand disclosure of interests and a copy of Goldman Sachs’ Australian Sell-Side Research
Independence Policy Statement are available at: https://www.goldmansachs.com/disclosures/australia-new-zealand/index.html. Brazil: Disclosure
information in relation to CVM Instruction 598 is available at https://www.gs.com/worldwide/brazil/area/gir/index.html. Where applicable, the
Brazil-registered analyst primarily responsible for the content of this research report, as defined in Article 20 of CVM Instruction 598, is the first author
named at the beginning of this report, unless indicated otherwise at the end of the text. Canada: Goldman Sachs Canada Inc. is an affiliate of The
Goldman Sachs Group Inc. and therefore is included in the company specific disclosures relating to Goldman Sachs (as defined above). Goldman Sachs
Canada Inc. has approved of, and agreed to take responsibility for, this research report in Canada if and to the extent that Goldman Sachs Canada Inc.
disseminates this research report to its clients. Hong Kong: Further information on the securities of covered companies referred to in this research
may be obtained on request from Goldman Sachs (Asia) L.L.C. India: Further information on the subject company or companies referred to in this
research may be obtained from Goldman Sachs (India) Securities Private Limited, Research Analyst - SEBI Registration Number INH000001493, 951-A,
Rational House, Appasaheb Marathe Marg, Prabhadevi, Mumbai 400 025, India, Corporate Identity Number U74140MH2006FTC160634, Phone +91 22
6616 9000, Fax +91 22 6616 9001. Goldman Sachs may beneficially own 1% or more of the securities (as such term is defined in clause 2 (h) the Indian
Securities Contracts (Regulation) Act, 1956) of the subject company or companies referred to in this research report. Japan: See below. Korea: This
research, and any access to it, is intended only for “professional investors” within the meaning of the Financial Services and Capital Markets Act,
unless otherwise agreed by Goldman Sachs. Further information on the subject company or companies referred to in this research may be obtained
from Goldman Sachs (Asia) L.L.C., Seoul Branch. New Zealand: Goldman Sachs New Zealand Limited and its affiliates are neither “registered banks”
nor “deposit takers” (as defined in the Reserve Bank of New Zealand Act 1989) in New Zealand. This research, and any access to it, is intended for
“wholesale clients” (as defined in the Financial Advisers Act 2008) unless otherwise agreed by Goldman Sachs. A copy of certain Goldman Sachs
Australia and New Zealand disclosure of interests is available at: https://www.goldmansachs.com/disclosures/australia-new-zealand/index.html. Russia:
Research reports distributed in the Russian Federation are not advertising as defined in the Russian legislation, but are information and analysis not
having product promotion as their main purpose and do not provide appraisal within the meaning of the Russian legislation on appraisal activity.
Research reports do not constitute a personalized investment recommendation as defined in Russian laws and regulations, are not addressed to a
specific client, and are prepared without analyzing the financial circumstances, investment profiles or risk profiles of clients. Goldman Sachs assumes
For the exclusive use of NICOLE.ZANCANELLA@COMMUNITYGROUP.IT
no responsibility for any investment decisions that may be taken by a client or any other person based on this research report. Singapore: Goldman
Sachs (Singapore) Pte. (Company Number: 198602165W), which is regulated by the Monetary Authority of Singapore, accepts legal responsibility for
this research, and should be contacted with respect to any matters arising from, or in connection with, this research. Taiwan: This material is for
reference only and must not be reprinted without permission. Investors should carefully consider their own investment risk. Investment results are the
responsibility of the individual investor. United Kingdom: Persons who would be categorized as retail clients in the United Kingdom, as such term is
defined in the rules of the Financial Conduct Authority, should read this research in conjunction with prior Goldman Sachs research on the covered
companies referred to herein and should refer to the risk warnings that have been sent to them by Goldman Sachs International. A copy of these risks
warnings, and a glossary of certain financial terms used in this report, are available from Goldman Sachs International on request.
European Union and United Kingdom: Disclosure information in relation to Article 6 (2) of the European Commission Delegated Regulation (EU)
(2016/958) supplementing Regulation (EU) No 596/2014 of the European Parliament and of the Council (including as that Delegated Regulation is
implemented into United Kingdom domestic law and regulation following the United Kingdom’s departure from the European Union and the European
Economic Area) with regard to regulatory technical standards for the technical arrangements for objective presentation of investment
recommendations or other information recommending or suggesting an investment strategy and for disclosure of particular interests or indications of
conflicts of interest is available at https://www.gs.com/disclosures/europeanpolicy.html which states the European Policy for Managing Conflicts of
Interest in Connection with Investment Research.
Japan: Goldman Sachs Japan Co., Ltd. is a Financial Instrument Dealer registered with the Kanto Financial Bureau under registration number Kinsho
69, and a member of Japan Securities Dealers Association, Financial Futures Association of Japan and Type II Financial Instruments Firms Association.
Sales and purchase of equities are subject to commission pre-determined with clients plus consumption tax. See company-specific disclosures as to
any applicable disclosures required by Japanese stock exchanges, the Japanese Securities Dealers Association or the Japanese Securities Finance
Company.
Ratings, coverage universe and related definitions
Buy (B), Neutral (N), Sell (S) -Analysts recommend stocks as Buys or Sells for inclusion on various regional Investment Lists. Being assigned a Buy or
Sell on an Investment List is determined by a stock’s total return potential relative to its coverage universe. Any stock not assigned as a Buy or a Sell on
8ca1e8f0991046b0a28d4408a62e3240
an Investment List with an active rating (i.e., a stock that is not Rating Suspended, Not Rated, Coverage Suspended or Not Covered), is deemed
Neutral. Each region’s Investment Review Committee manages Regional Conviction lists, which represent investment recommendations focused on
the size of the total return potential and/or the likelihood of the realization of the return across their respective areas of coverage. The addition or
removal of stocks from such Conviction lists do not represent a change in the analysts’ investment rating for such stocks.
Total return potential represents the upside or downside differential between the current share price and the price target, including all paid or
anticipated dividends, expected during the time horizon associated with the price target. Price targets are required for all covered stocks. The total
return potential, price target and associated time horizon are stated in each report adding or reiterating an Investment List membership.
Coverage Universe: A list of all stocks in each coverage universe is available by primary analyst, stock and coverage universe at
https://www.gs.com/research/hedge.html.
Not Rated (NR). The investment rating and target price have been removed pursuant to Goldman Sachs policy when Goldman Sachs is acting in an
advisory capacity in a merger or strategic transaction involving this company and in certain other circumstances. Rating Suspended (RS). Goldman
Sachs Research has suspended the investment rating and price target for this stock, because there is not a sufficient fundamental basis for
determining, or there are legal, regulatory or policy constraints around publishing, an investment rating or target. The previous investment rating and
price target, if any, are no longer in effect for this stock and should not be relied upon. Coverage Suspended (CS). Goldman Sachs has suspended
coverage of this company. Not Covered (NC). Goldman Sachs does not cover this company. Not Available or Not Applicable (NA). The information
is not available for display or is not applicable. Not Meaningful (NM). The information is not meaningful and is therefore excluded.
Global product; distributing entities
The Global Investment Research Division of Goldman Sachs produces and distributes research products for clients of Goldman Sachs on a global basis.
Analysts based in Goldman Sachs offices around the world produce research on industries and companies, and research on macroeconomics,
currencies, commodities and portfolio strategy. This research is disseminated in Australia by Goldman Sachs Australia Pty Ltd (ABN 21 006 797 897); in
Brazil by Goldman Sachs do Brasil Corretora de Títulos e Valores Mobiliários S.A.; Ombudsman Goldman Sachs Brazil: 0800 727 5764 and / or
ouvidoriagoldmansachs@gs.com. Available Weekdays (except holidays), from 9am to 6pm. Ouvidoria Goldman Sachs Brasil: 0800 727 5764 e/ou
ouvidoriagoldmansachs@gs.com. Horário de funcionamento: segunda-feira à sexta-feira (exceto feriados), das 9h às 18h; in Canada by either Goldman
Sachs Canada Inc. or Goldman Sachs & Co. LLC; in Hong Kong by Goldman Sachs (Asia) L.L.C.; in India by Goldman Sachs (India) Securities Private
Ltd.; in Japan by Goldman Sachs Japan Co., Ltd.; in the Republic of Korea by Goldman Sachs (Asia) L.L.C., Seoul Branch; in New Zealand by Goldman
Sachs New Zealand Limited; in Russia by OOO Goldman Sachs; in Singapore by Goldman Sachs (Singapore) Pte. (Company Number: 198602165W);
and in the United States of America by Goldman Sachs & Co. LLC. Goldman Sachs International has approved this research in connection with its
14 January 2021 13Goldman Sachs Italy Asset Managers
distribution in the United Kingdom and European Union.
European Union: Goldman Sachs International authorised by the Prudential Regulation Authority and regulated by the Financial Conduct Authority and
the Prudential Regulation Authority, has approved this research in connection with its distribution in the European Union and United Kingdom.
Effective from the date of the United Kingdom’s departure from the European Union and the European Economic Area (“Brexit Day”) the following
information with respect to distributing entities will apply:
Goldman Sachs International (“GSI”), authorised by the Prudential Regulation Authority (“PRA”) and regulated by the Financial Conduct Authority
(“FCA”) and the PRA, has approved this research in connection with its distribution in the United Kingdom.
European Economic Area: GSI, authorised by the PRA and regulated by the FCA and the PRA, disseminates research in the following jurisdictions
within the European Economic Area: the Grand Duchy of Luxembourg, Italy, the Kingdom of Belgium, the Kingdom of Denmark, the Kingdom of
Norway, the Republic of Finland and the Republic of Ireland; GS -Succursale de Paris (Paris branch) which, from Brexit Day, will be authorised by the
French Autorité de contrôle prudentiel et de resolution (“ACPR”) and regulated by the Autorité de contrôle prudentiel et de resolution and the Autorité
des marches financiers (“AMF”) disseminates research in France; GSI - Sucursal en España (Madrid branch) authorized in Spain by the Comisión
Nacional del Mercado de Valores disseminates research in the Kingdom of Spain; GSI - Sweden Bankfilial (Stockholm branch) is authorized by the SFSA
as a “third country branch” in accordance with Chapter 4, Section 4 of the Swedish Securities and Market Act (Sw. lag (2007:528) om
värdepappersmarknaden) disseminates research in the Kingdom of Sweden; Goldman Sachs Bank Europe SE (“GSBE”) is a credit institution
incorporated in Germany and, within the Single Supervisory Mechanism, subject to direct prudential supervision by the European Central Bank and in
other respects supervised by German Federal Financial Supervisory Authority (Bundesanstalt für Finanzdienstleistungsaufsicht, BaFin) and Deutsche
Bundesbank and disseminates research in the Federal Republic of Germany and those jurisdictions within the European Economic Area where GSI is
not authorised to disseminate research and additionally, GSBE, Copenhagen Branch filial af GSBE, Tyksland, supervised by the Danish Financial
Authority disseminates research in the Kingdom of Denmark; GSBE - Sucursal en España (Madrid branch) subject (to a limited extent) to local
supervision by the Bank of Spain disseminates research in the Kingdom of Spain; GSBE - Succursale Italia (Milan branch) to the relevant applicable
extent, subject to local supervision by the Bank of Italy (Banca d’Italia) and the Italian Companies and Exchange Commission (Commissione Nazionale
For the exclusive use of NICOLE.ZANCANELLA@COMMUNITYGROUP.IT
per le Società e la Borsa “Consob”) disseminates research in Italy; GSBE - Succursale de Paris (Paris branch), supervised by the AMF and by the ACPR
disseminates research in France; and GSBE - Sweden Bankfilial (Stockholm branch), to a limited extent, subject to local supervision by the Swedish
Financial Supervisory Authority (Finansinpektionen) disseminates research in the Kingdom of Sweden.
General disclosures
This research is for our clients only. Other than disclosures relating to Goldman Sachs, this research is based on current public information that we
consider reliable, but we do not represent it is accurate or complete, and it should not be relied on as such. The information, opinions, estimates and
forecasts contained herein are as of the date hereof and are subject to change without prior notification. We seek to update our research as
appropriate, but various regulations may prevent us from doing so. Other than certain industry reports published on a periodic basis, the large majority
of reports are published at irregular intervals as appropriate in the analyst’s judgment.
Goldman Sachs conducts a global full-service, integrated investment banking, investment management, and brokerage business. We have investment
banking and other business relationships with a substantial percentage of the companies covered by our Global Investment Research Division.
Goldman Sachs & Co. LLC, the United States broker dealer, is a member of SIPC (https://www.sipc.org).
Our salespeople, traders, and other professionals may provide oral or written market commentary or trading strategies to our clients and principal
trading desks that reflect opinions that are contrary to the opinions expressed in this research. Our asset management area, principal trading desks and
investing businesses may make investment decisions that are inconsistent with the recommendations or views expressed in this research.
The analysts named in this report may have from time to time discussed with our clients, including Goldman Sachs salespersons and traders, or may
discuss in this report, trading strategies that reference catalysts or events that may have a near-term impact on the market price of the equity securities
discussed in this report, which impact may be directionally counter to the analyst’s published price target expectations for such stocks. Any such
trading strategies are distinct from and do not affect the analyst’s fundamental equity rating for such stocks, which rating reflects a stock’s return
potential relative to its coverage universe as described herein.
We and our affiliates, officers, directors, and employees, excluding equity and credit analysts, will from time to time have long or short positions in, act
8ca1e8f0991046b0a28d4408a62e3240
as principal in, and buy or sell, the securities or derivatives, if any, referred to in this research.
The views attributed to third party presenters at Goldman Sachs arranged conferences, including individuals from other parts of Goldman Sachs, do not
necessarily reflect those of Global Investment Research and are not an official view of Goldman Sachs.
Any third party referenced herein, including any salespeople, traders and other professionals or members of their household, may have positions in the
products mentioned that are inconsistent with the views expressed by analysts named in this report.
This research is not an offer to sell or the solicitation of an offer to buy any security in any jurisdiction where such an offer or solicitation would be
illegal. It does not constitute a personal recommendation or take into account the particular investment objectives, financial situations, or needs of
individual clients. Clients should consider whether any advice or recommendation in this research is suitable for their particular circumstances and, if
appropriate, seek professional advice, including tax advice. The price and value of investments referred to in this research and the income from them
may fluctuate. Past performance is not a guide to future performance, future returns are not guaranteed, and a loss of original capital may occur.
Fluctuations in exchange rates could have adverse effects on the value or price of, or income derived from, certain investments.
Certain transactions, including those involving futures, options, and other derivatives, give rise to substantial risk and are not suitable for all investors.
Investors should review current options and futures disclosure documents which are available from Goldman Sachs sales representatives or at
https://www.theocc.com/about/publications/character-risks.jsp and
https://www.fiadocumentation.org/fia/regulatory-disclosures_1/fia-uniform-futures-and-options-on-futures-risk-disclosures-booklet-pdf-version-2018.
Transaction costs may be significant in option strategies calling for multiple purchase and sales of options such as spreads. Supporting documentation
will be supplied upon request.
Differing Levels of Service provided by Global Investment Research: The level and types of services provided to you by the Global Investment
Research division of GS may vary as compared to that provided to internal and other external clients of GS, depending on various factors including your
individual preferences as to the frequency and manner of receiving communication, your risk profile and investment focus and perspective (e.g.,
marketwide, sector specific, long term, short term), the size and scope of your overall client relationship with GS, and legal and regulatory constraints.
As an example, certain clients may request to receive notifications when research on specific securities is published, and certain clients may request
that specific data underlying analysts’ fundamental analysis available on our internal client websites be delivered to them electronically through data
feeds or otherwise. No change to an analyst’s fundamental research views (e.g., ratings, price targets, or material changes to earnings estimates for
equity securities), will be communicated to any client prior to inclusion of such information in a research report broadly disseminated through electronic
publication to our internal client websites or through other means, as necessary, to all clients who are entitled to receive such reports.
14 January 2021 14Goldman Sachs Italy Asset Managers
All research reports are disseminated and available to all clients simultaneously through electronic publication to our internal client websites. Not all
research content is redistributed to our clients or available to third-party aggregators, nor is Goldman Sachs responsible for the redistribution of our
research by third party aggregators. For research, models or other data related to one or more securities, markets or asset classes (including related
services) that may be available to you, please contact your GS representative or go to https://research.gs.com.
Disclosure information is also available at https://www.gs.com/research/hedge.html or from Research Compliance, 200 West Street, New York, NY
10282.
© 2021 Goldman Sachs.
No part of this material may be (i) copied, photocopied or duplicated in any form by any means or (ii) redistributed without the prior written
consent of The Goldman Sachs Group, Inc.
For the exclusive use of NICOLE.ZANCANELLA@COMMUNITYGROUP.IT
8ca1e8f0991046b0a28d4408a62e3240
14 January 2021 15You can also read