EV NETWORK INTEGRATION - GREEN PAPER
←
→
Page content transcription
If your browser does not render page correctly, please read the page content below

EV NETWORK
INTEGRATION
GREEN PAPER
OBJECTIVE                                                            TABLE OF CONTENTS
This Green Paper represents Vector’s contribution to the evolving    Executive Summary                                                 3
discussion around electric vehicle (EV) adoption in New Zealand.     Customer Choice                                                   5
As a large energy network business, Vector wishes to share its       EV integration in Low Voltage networks                            8
insights, informed by a detailed understanding of the electricity
network closest to customers, (i.e. the local low-voltage network,       Investment uncertainties
which is utilised for EV charging), robust engineering modelling,        EV network integration capacity
and research into emerging global trends and changing consumer           Investments for EV network integration
behaviour.                                                               Cost allocation and equity policy for network reinforcement
The objective of the Green Paper is to:                              International Approaches                                          19
•   examine the potential long-term network impact of widespread         Registration
    EV charging;                                                         Tariffs
                                                                         Managed charging and control
•   identify options that both Government and industry could             Vehicle to grid (V2G)
    consider to minimise significant infrastructure investment           Public charging
    implications; and                                                    Future of non-ownership
•   ensure all stakeholders can make informed decisions to enable    Charging ahead                                                    24
    customer choice in the uptake of EVs in New Zealand in the
    short and the longer term.

2
EXECUTIVE SUMMARY (1/2)
A key aspect of the discussion on EV uptake is future proofing, mean a single EV household has the potential to increase its electricity
informed by customer behaviour, technology advancements and capacity needs between 100% for very slow trickle charging, and
international trends.                                                    2000% for rapid charging. This is essentially adding between one and
Vector is seeing clear trends of longer range vehicles, requiring larger 20 additional ‘homes’ in terms of network capacity.
capacity batteries, and customer behaviour that suggests a trend            These potential street level impacts are magnified by emerging
towards faster charging times and clustering of chargers in some areas      research showing the extent to which EV take-up is commonly
on the network. These trends necessitate the need for a strategy on EV      ‘clustered’ in suburbs, bringing forward constraints on existing network
charging for New Zealand that is future-proof. The perception that          investments. Should households purchase more than one EV, the
networks can absorb the uptake of EV charging is only true for the short    problems magnify further.
term while batteries have a short-range capability, customers are           As a business, we are technology-agnostic and wish to continue to be a
satisfied with long charging times and chargers are evenly distributed      key enabler of customer choice and the adoption of all new distributed
across the network. In Vector’s view, this will change in the longer term   energy technologies in New Zealand, including EVs. As such, we have
as the uptake of EVs increases.                                             already invested in public charging stations, which has helped mitigate
The potential network impacts of changing customer behaviour or             the well-publicised “range anxiety” deterrent to early EV uptake.
battery technology are most pronounced at the street level. This is     However, as battery technology costs continue to fall, car battery sizes
where electricity networks have traditionally been sized according to the
                                                                        increase, and customer demand for longer-range EVs grow, the current
number of houses on a street, with little spare capacity. The local     model of public charging stations cannot be assumed to be the default
electricity network was not designed for, or envisaged, any significant charging infrastructure of choice beyond early adopters. Unlike five
uptake of EVs and the consequential demand for charging at home.        minute petrol refuelling stops consumers are historically used to,
The network issues are brought forward when understood in the context electric charging – even with rapid fast chargers – will test customers’
of emerging EV manufacturer roadmaps, which have much longer patience.
range and larger battery EVs entering the market in the next few years.
These larger batteries, combined with customer demand for shorter
charging times and increased affordability of high capacity chargers,

3
EXECUTIVE SUMMARY (2/2)
In parallel, as demand and consumer options grow for suitable at home      conversation that explores initiatives and potential interventions that can
charging technologies, the same larger size/range battery                  avoid either outcome.
developments will also challenge the assumed viability for at-home        While time-of-use tariffs may provide short-term cushioning for network
overnight “trickle charging”. For example, trickle charging Audi’s Q6 e-  impacts at today’s low levels of uptake, longer range/larger battery size
ton (due to market in 2018/2019) will take two full days.                 EVs, combined with the reducing costs of EV fast chargers, will
Vector has examined likely EV uptake scenarios from a customer undermine pricing alone as a credible means to avoid peak capacity
behaviour, engineering, and investment perspective. Even at low EV levels being breached. Pricing alone fails to recognise the value of
penetration (10-20% on a network feeder or neighbourhood), low- dynamic scheduling, which through greater coordination of individual
voltage capacity constraints can occur if charging during peak time chargers, fully utilises network capacity throughout the day. “Smarter”
and/or using faster charging options. If 7kW chargers are deployed, charging has an added customer benefit of enabling EV users to
low-voltage network expansion cost can range from $100 million for become market participants whereby, for example, the aggregated,
10% to $530 million for 40% penetration.                                  dynamic EV battery load can supplement the generation mix and add to
As with any rapidly changing technology, consumer behaviours can community resilience.
change quickly. As such, and to avoid any chance of network constraints Finally, potential energy inequity issues can arise where network
undermining EV uptake or customer choice for charging options, Vector investment is required to accommodate EVs, as the related costs would
wishes to ensure that all stakeholders carefully consider the be carried by all network-connected customers. With the advent of
infrastructure, regulatory, and software coordination solutions that will ‘internet of energy’ network technology and the use of advanced data
best serve New Zealand consumers well in the long term.                   analytics to dynamically manage EV charging, there are exciting
Left unaddressed, tipping points for significant network upgrade possibilities emerging to help deliver a fairer, more consumer-controlled
investment can be expected to have either large cost implications for energy future that serves to minimise such inequities.
consumers or eventuate in physical constraints preventing customers We look forward to continuing to participate in this discussion as it
from charging their EVs at home. Vector believes that neither scenario evolves, and we welcome feedback on this paper.
will be acceptable from a customer, government or industry perspective.
As such, we hope this paper prompts an early and forward-looking

4

CUSTOMER CHOICE

5
CUSTOMER CHOICE
EVs are perceived positively in New Zealand (NZ). A recent customer                                                                 Figure 1: Customer utility increase by improving different EV attributes2
survey found that 60% of New Zealanders would consider buying an
EV, as opposed to 54% in the United Kingdom (UK). This high interest
is distributed evenly throughout the country and across all demographic
groups. Customer research is showing that EV interest goes beyond
ecological concerns. Therefore, based on customer-interest, a high
uptake of EVs is probable in the near future as the current main market
barriers are lowered. Currently the three main barriers for customers are
the high upfront price, range anxiety, and the time to charge (Figure 1).
EVs are expected to reach cost parity with conventional cars between
20213 and 20254. However, the lower operational and maintenance
cost and superior driving performance of EVs (e.g. quick acceleration,
low noise) means that for most customers, the value proposition of an
EV could surpass conventional cars even earlier. This indicates that EVs
have reached a tipping point where they will fully disrupt new car sales
and lead to strong exponential market penetration. These rapid EV
developments are even more remarkable given that oil prices have
been low for the last three years. It indicates that car manufacturers
believe customer interest in EVs is high for reasons beyond cost-
competitiveness alone.
                                                                                                                                     The main EV adoption barriers for New Zealanders
                                                                                                                                     are high purchase price, range anxiety and charging time.
                                                                                                                                     These are all short term in nature. We are already seeing affordable,
                                                                                                                                     new technology reducing these barriers.

              1Ford, R., Stephenson, J., Scott, M., Williams, J., Rees, D. & Wooliscroft, B. (2015). Keen on EVs: Kiwi perspectives on electric vehicles, and opportunities to stimulate uptake, University of Otago
              2 See 1
              3 Arbib, J., and Seba, T. (2017), Rethinking Transportation 2020-2030
              4 Bloomberg New Energy Finance: https://about.bnef.com/blog/electric-cars-reach-price-parity-2025/
6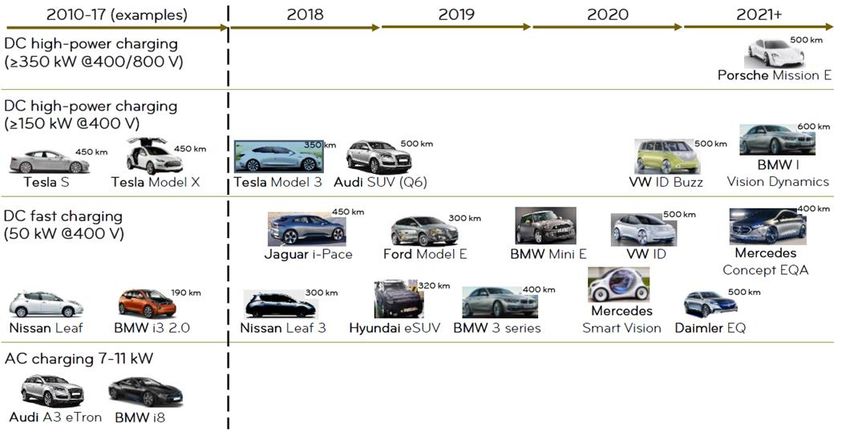
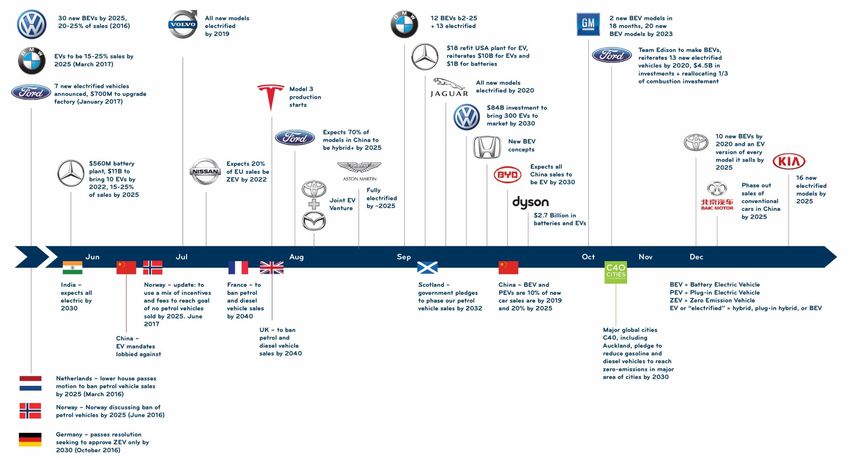
GLOBAL MOMENTUM FOR VEHICLE ELECTRIFICATION
                                                Figure 2: Announcements from major car manufacturers in 2017 5

                                                                                                       In 2017, many large car manufacturers and governments committed to an
                                                                                                       electric transport future, which will expand EV model availability.

7   5   Adapted and updated from https://www.teslarati.com/automakers-come-acceptance-ev-revolution-begun/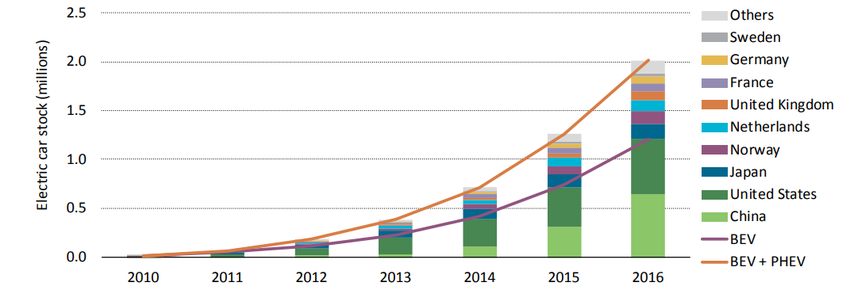
EV INTEGRATION IN LOW
    VOLTAGE NETWORKS

8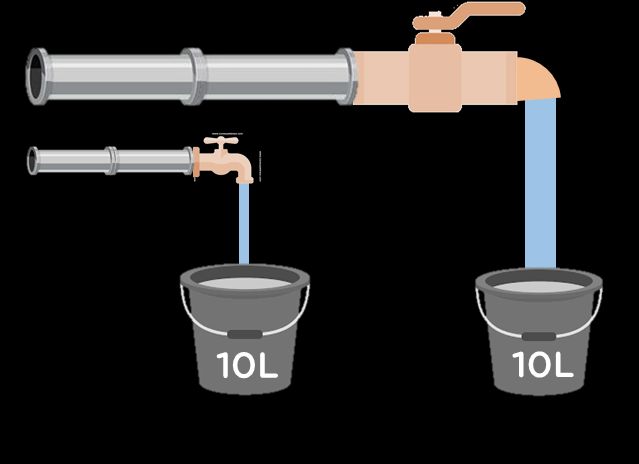
INVESTMENT UNCERTAINTIES
Customer-driven technology disruption is leading to a paradigm shift in      Figure 3: EV-driven uncertainties for network investment
electricity networks and markets. The part of the network that empowers
the customer, the low voltage network, is becoming increasingly
important. As a result, future network investment will increasingly shift
away from higher distribution and transmission voltage levels, as
consumers exercise choice and change behaviours. This will also create
a new, localised electricity market as opposed to the traditional
centralised generation and transmission dominated market.
The network impact of EV network integration will depend on four main
uncertainties (Figure 3) that will be discussed in more detail on the next
slides:
• Uncertainty 1: EV uptake and network clustering
• Uncertainty 2: EV range and battery size
• Uncertainty 3: Consumer charging behaviour (charge anxiety and
  charger capacity)
• Uncertainty 4: Customer choice around the time of charging

                                                                             The 4 main uncertainties for EV network integration are
                                                                             network clustering, EV range, customer charge anxiety and
                                                                             charging timing

9
UNCERTAINTY 1: EV UPTAKE AND NETWORK CLUSTERING (1/2)
Based on early NZ and international experience, EV growth is
characterised as being exponential, urban and clustered in individual
neighbourhoods.
The number of EVs on NZ roads is currently low (6160 EVs were
registered as at 31 December 2017), but uptake is expected to increase EV adoption is likely follow an exponential growth curve.
exponentially, achieving the government target of 64 000 EVs (2% of
current car fleet) by 2021, or even more if the current growth
rate continues. International experience on EV adoption also reflects
strong exponential growth (Figure 4).
Figure 4a: Number of EVs in national fleets internationally6 Figure 4b: Number of EVs in national fleet in New Zealand
6 International Energy Agency (IEA) (2017), Global EV Outlook
10UNCERTAINTY 1: EV UPTAKE AND NETWORK CLUSTERING (2/2)
Due to the shorter ranges of EVs as opposed to conventional cars, EV growth Figure 5: EV penetration in major cities and national averages8
in major cities is higher than national averages. Auckland is the hub of EVs in
NZ, with one out of two EVs registered in Auckland (while only one in three
New Zealanders live in Auckland). If this trend continues, we could see one in
15 households in Auckland with an EV by 2021. This is also in line with
international experience (Figure 5). For example, market share in Amsterdam
and San Francisco is twice and five times the Dutch and United States (US)
national average.
Within cities, EV penetration is not evenly spread and growth is higher in
certain neighbourhoods, where EVs cluster due to peer influencing, higher
income level, infrastructure availability, and other factors which encourage early
adoption. An analysis of Christchurch for example, has identified a
neighbourhood clustering of hybrid cars7.
Exponential EV adoption, exponential EV purchase price reductions, and
superior driving performance means that EV sales could disrupt the
conventional car market in the short term and exceed most adoption
forecasts post 2020. Preparing the network today to accommodate for a
high EV penetration is therefore a priority for Vector, especially given that
clustering requires active engagement with consumers to manage EV
integration into the network.
EV growth is stronger in cities than national averages.
7 Grenier, A., Page, S. (2012), The impact of electrified transport on local grid infrastructure: A comparison between electric cars and light rail, In Energy Policy, Volume 49, 2012
11 8 see 6UNCERTAINTY 2: EV RANGE AND BATTERY SIZE
The EV fleet in NZ comprises a variety of vehicle types, battery sizes, ranges Figure 6: EV models in New Zealand market and compatibility for different
and charging requirements, largely because the majority of vehicles charging technologies9
are second-hand. Based on data from Vector’s rapid charging stations, 92%
of EVs in Auckland currently have battery capacities with between 10kWh and
30kWh, which corresponds to an electric range of roughly 50 to 150 km. As a
comparison, a second generation Nissan Leaf has a 28kWh battery and
150km range. Today, only 4% of EVs have battery sizes over 50kWh.
However, in the next couple of years, the market share of EVs with longer
electric ranges (and battery sizes) is expected to grow. As shown in Figure 6,
new EV models will have an average range of 350-500km. The long-range
cars shown in Figure 6 will have batteries of up to 100kWh. As a point of
reference, a standard Tesla Model 3 has a range of 350km with a battery size
of 50kWh, and the third-generation Nissan Leaf 2018 has a range of 250-
400km with a battery size of 40-60kWh.
Larger batteries take longer to charge and might even make over-night
charging practically unfeasible unless faster charging technologies are
adopted.
New EV models have the potential to charge at increasingly higher
capacity levels.
9 Adapted from ABB presentation
12UNCERTAINTY 3: CONSUMER CHARGING BEHAVIOUR
Larger battery sizes will compound the need for faster charging Figure 7: Time duration to full charge for different charging technologies and
capabilities to reduce charging duration. Figure 7 shows the difference cost for EV charging unit
in the time required to charge a short-range battery (135 km) and a
long-range battery (500 km) based on different charger types.
EV chargers put a large electrical load on the network, with a capacity
that varies between 2.4 kW and 50 kW based on current technologies.
Upcoming super-fast charging technology that will be available in NZ
late 2018, will be capable of charging loads between 150-350 kW.
An average house has a load impact of 2.5 kW, which means that every
EV trickle charger (2.4 kW) effectively adds another home to the Notes:
i) A range of 135 and 500 km is equivalent to 28 kWh (e.g. Nissan Leaf) and 100 kWh battery (e.g. Audi Q6 e-tron) capacity;
network. Given the long charging times associated with trickle charging, ii) All charger costs are based on Vector market research and exclude any network or customer premise upgrade costs.
Vector expects customers to opt at least for the 7kW slow charger
whenever financially possible. Adding a 7kW charger equates to the Figure 8: Capacity of different charger types compared to average
equivalent of 2.8 homes being connected to the local network. A fast household connection capacity
(22kW) and rapid (50kW) charger equals to 8.8 and 20 new houses
being added to the local network (Figure 8).
Trickle - 2.4 kW
With longer EV ranges, the customer value for higher capacity chargers
and shorter charging duration increases. Faster chargers may therefore Slow - 7 kW
be necessary to avoid “charge anxiety,” that may limit the potential for
EV mass market adoption.
Fast - 22 kW
Depending on charging technology, connecting one EV is equivalent to
an additional one to 20 new homes on the electricity network. Rapid - 50 kW
13UNCERTAINTY 4: TIME OF CHARGING
In NZ, 90% of travel by light vehicle is less than 100km a day, and the Figure 9: Analogy between water and electricity infrastructure to illustrate the
average daily distance travelled is 29km. This means that the average difference between power and energy
residential customer would only need to charge every third day for two
hours at home. However, driven by range anxiety and probably a
preference for routine and convenience, EV drivers currently prefer to
charge where possible and top up to 100%.
Home-charging EVs, which represents 95% of residential customers,
are plugging in every night, even if a charge is not required to fulfil the
next day’s driving needs. International experience confirms this trend for
both full battery EVs and plug-in hybrid EVs10.
The network loading varies across the day and year. The electricity
network is dimensioned by power capacity (and peak demand), not by
energy consumption. As the analogy with water in Figure 9 illustrates,
filling up the same battery in a shorter time at a higher charging rate,
will require a ‘thicker’ power line (as well as related equipment such as
transformer and protection gear) to provide this capacity.
It is not the battery size, but the capacity of the charger, which defines
power line capacity and investment requirements.
10 see 6
14EV NETWORK INTEGRATION CAPACITY (1/2) Exponential growth, combined with local clustering in urban areas, Figure 10: Low-voltage network capacity limits for different EV penetration and especially Auckland, means that the impact of EVs on the electricity charger types system will be primarily on low-voltage distribution networks. Apart from the adoption/diffusion of EVs, which depends on the consumer’s decision to buy an EV, the network impact depends on the EV battery characteristics, charging technology, location of charging, and time of charging. Vector has assessed the capability of the existing network to accommodate EVs based on different penetration rates, battery sizes, charging capacities and across different part of the day. Figure 10 illustrates the impact of different charging scenarios for a typical low- voltage feeder of 100kW and 30 customer connections. The analysis highlights that the connection of fast and rapid chargers will stress or surpass the network capacity even at penetrations as low as 10%. The network headroom for trickle and fast chargers is larger, especially during parts of the day when demand is low. However, charging duration may be the limiting factor for customers for these chargers. Even at 10% EV penetration, low-voltage capacity constraints can occur if charging during peak time and/or using faster charging options. 15
EV NETWORK INTEGRATION CAPACITY (2/2)
There is a trade-off between higher capacity chargers and charging                   Figure 11 shows the share of homes with a single EV that can be
duration in terms of low-voltage network integration. The adoption of                connected in parallel to a typical low-voltage network for different
high capacity chargers with shorter charging duration will reach existing            charger types, while also indicating the duration that the EVs would
network limits even at very low penetration (
INVESTMENTS FOR EV NETWORK INTEGRATION
As discussed in a previous slide, the additional load from EV charging                                                    at different EV penetration levels. As a reminder, the trickle and slow
could result in the overloading of local networks, depending on the                                                       chargers represent the load of 1 new and 2.8 new houses, respectively.
extent to which these chargers are clustered on the same circuit. This in
turn will require network reinforcement to avoid overloading of assets.                                                   As the previous analysis (Figures 10-12) for typical feeders has indicated,
                                                                                                                          the very large capacity of fast and rapid chargers, which represent 8.8
A UK study11 estimates that 32% of the low-voltage feeders (i.e.                                                          households and 20 households, can only accommodate very small
312,000 circuits) will require reinforcement by 2050 to cope with                                                         penetrations (
COST ALLOCATION AND EQUITY POLICY FOR NETWORK REINFORCEMENT The integration of EVs into the electricity network and the potential impact on infrastructure investment needs to be carefully considered to avoid overloading and excessive peaks that could jeopardise physical reliability as well as customer equity. Network reinforcements could create an equity issue between EV and non-EV owners. Network investments due to EV penetration would most likely be subsidised by non-EV owners under today’s regulation. This could be perceived as adequate due to the wider societal benefits of EV adoption, such as CO2 reduction and energy security improvements. However, public perception may judge that differently. The desire of some EV owners to acquire fast chargers will considerably accentuate investment needs for all network customers, with largely private benefits by reducing charging durations for individual EV owners. An equity issue might also develop among EV owners. Network investments on a low-voltage feeder are triggered by the connection request that would breach the existing network capacity. However, the EV owner that causes the network reinforcement can not be expected to cover the full cost. All previously and future-connected EV owners would otherwise benefit from a free-rider bonus and share the cost for the benefit they incur from the network. A cost allocation policy will need to be prepared to manage equitable grid access. Network reinforcements could create an equity issue between EV Vector views EV integration as a priority to deliver an equitable, cost- and non-EV owners. effective and resilient network that provides customers with choice on how they power their transport needs and at the same time realises the social value proposition of EVs for NZ. 18
INTERNATIONAL
     APPROACHES
     An international review provides a set of different approaches
     to deal with efficient network integration of EVs.

19
EV REGISTRATION AND TARIFFS
Registration Southern California Edison (SCE)15 carried out a workplace charging
pilot to reduce afternoon peaks and learn more about driver behaviour
Registration of EV connections and charger types by EV owners would and responsiveness to pricing signals. The program included a high
facilitate coordination of electricity distribution planning and operation. price option, allowing users to have no charging disruption; a medium
EV registration data and/or consumption data from smart meters can price, allowing for peak demand curtailment from a fast charging to a
provide information on charging behaviour. This data can support the slow charging rate; and a low price, allowing drivers to be entirely
forecasting of loads and the planning of electricity networks, in curtailed during peak demand. This study, as well as another SCE study
particular at low-voltage level where little data is available. focussing on peak rebates, confirmed that EV owners want the option
In the UK, the parliament is currently considering a bill that would to opt out if they need to charge at certain times, which highlights the
require all EV chargers, for both domestic and public applications, to need to give customers flexibility.
have smart meter capabilities to interact with the grid13. At high EV penetrations, tariffs may not be sufficient to account for the
impact on local low-voltage networks as tariffs are based only on
Tariffs wholesale prices. A tariff is also a static price signal which does not
A special EV tariff with lower prices during off-peak times can reflect how EV owners respond to those price signals. These solutions
incentivise EV charging off-peak. are therefore only tenable at low EV adoption, but do not enable the
transition to high levels of EVs without possible unintended
The US behavioural trial “EV project“ 14 found that charging can be consequences. In particular, all drivers receiving a static price signal
impacted by different tariff structures. The project involved 4000 could schedule charging to start at the moment rates drop and this
privately-owned EVs (90% Nissan Leafs and 10% Chevrolet Volts) would result in a ‘timer peak’ in which load ramps too sharply for the
across different stated in the US. In Nashville, where no Time-of-Use power system to effectively respond.
(ToU) tariff is in place, the EV charging demand coincided with the
existing peak demand, while in California which has a ToU tariff with
three prices for off-peak, partial peak and peak, the EV peak shifted to
off-peak times around midnight. However, the project involved mostly
early adopters of EVs that are more responsive to support EV
integration.
13 Pratt, D. (2017), All electric vehicle chargers sold in the UK to be ‘smart’ under government plans, article on www.cleanenergynew.co.uk
14 US DOE (2014), Evaluating EV Charging Impacts and Customer Charging Behaviours – Experiences from Six Smart Grid Investment Grant Projects
20
15 SCE (2016), Southern California Edison Plug-in Electric Vehicle Workplace Charging PilotMANAGED CHARGING AND CONTROL
At high EV penetration levels, a dynamic or staggering charge Managed charging empowers the customer to actively participate in the
algorithm can co-ordinate charging of the entire EV fleet based on a market at an aggregate level as customers will have the possibility to
variety of variables, including but not limited to, charge status, EV react to higher market prices by dynamically adapting their charging
owner’s desired departure time, local network congestion and behaviour. This means that customer demand is becoming increasingly
wholesale market price. elastic through managed charging, which especially during peak times,
can lead to substantial market price and carbon reductions by displacing
In the UK project ‘Electric Avenue’ for example, the aggregate EV expensive and polluting thermal peaking plants (Figure 14)
demand can be shifted so that the peak occurs after midnight via
managed charging. Under such a scenario, electricity system asset Figure 14: Supply and demand curve with price elasticity from managed EV charging
utilisation is increasing, and should reduce network charges for (Adapted from 19 and 20)
consumers. A study in California found that managed charging could
reduce the costs of delivering electricity to an EV in California from
USD 1,400 to less than USD 600, for a benefit of USD 850 per
vehicle17.
The IEA’s “Digitalization and Energy” study18 quantified the benefits of
managed charging on a global level. The study finds that in a medium
growth EV scenario where 150 million EVs are deployed by 2040, 140
GW of capacity is needed to meet standard EV charging needs.
However, if managed charging is implemented, capacity requirements
are reduced by nearly half (65 GW). In terms of financial benefits from
capacity expansion alone, managed charging avoids USD 280 billion in
transmission and distribution investments and USD 100 billion in new
power generation capacity.
Increasingly elastic demand from managed charging and EV
discharging through V2G can reduce peak load prices, reduce carbon
emissions, and increase customer benefits.
17 ICT (2014), California Transportation Electrification Assessment Vol 2 – grid impacts
18 International Energy Agency (IEA) (2017), Digitalization and Energy
21 19 Regulatory Assistance Program(RAP) (2017), Unleashing Demand Response with Effective Supplier Compensation
20 PJM (2017), Demand Response StrategyVEHICLE TO GRID (V2G)
One of the most advanced and valuable forms of smart charging is vehicle- The UK government is currently also offering up to GBP 20 million to carry
to-grid (V2G), or two-way charging. V2G allows electric vehicle batteries to out feasibility studies on V2G23. The US Department of Defence has trialled
discharge power back into the grid when needed, making the batteries an the potential of 42 EVs to provide capacity-based services, including
energy storage resource in addition to a mobility device. With full V2G spinning and non-spinning reserves, frequency regulation and peak power
capabilities, electric vehicles could be charged when power is cheapest and shaving, to the system operator CAISO. The economic benefits were
most abundant and fed back to the grid when the power is most valuable estimated to range between USD 1 800 and 2 500 annually24. Table
(i.e. during peak demand, Figure 14), providing financial benefits to 1 summarises some other international V2G trials25.
customers. In most scenarios, a group of electric vehicles would be linked Table 1: International comparison of financial benefits for V2G
together to send power into the grid, forming a “virtual power plant”.
Service offered Region Est. annual value (NZD) Source
The benefits of V2G for EV owners also include backup power for homes DR California up to 1436 BMW USA, 2016
and businesses in the case of a fault or outage, which increases resilience. V2G regulation US Mid-Atlantic 2520 Market et al. 2015
Additionally, if solar PV is available, EV owners can increase their self- V2G regulation California 3528 Gorguinpour, 2013
consumption of solar PV given that solar supply is often exceeding demand DR, V2G regulation (3.3kW) Washington 1050 Markel et al., 2015
V2G regulation (1.3kW) New York 388 – 1172 White & Zhang, 2011
during the sunniest parts of the day. For the electricity system, V2G V2G regulation (10kW) New York 3080 – 3500 White & Zhang, 2011
provides an even stronger potential for demand response (DR) to further DR New York 109 MJ Bradley, 2015
reduce peak load and increase asset utilisation of the network as well as V2G regulation (SRL) Germany 1366 Schuller & Rieger, 2013
increasing reliability and resilience of the local community and providing a V2G regulation (3.7kW) Germany 770 Raths et al., 2013
variety of ancillary services including voltage control, frequency regulation V2G regulation (SRL) Germany 854 – 1099 Arnold et al., 2016
DR, load shifting Spain 228 Madina et al., 2016
and spinning reserve21. V1G regulation Spain 392 Madina et al., 2017
CA LCFS credit sales California 416 CARB, 2016
A Nissan-led V2G trial in Denmark revealed that EV owners could earn up Based on trial Based on model
to EUR 1300 per year by supporting grid balancing22. Nissan has Notes: DR = demand response (on/off control); V1G = fully-controlled one-way charging; V2G = vehicle-to-grid (two-way) smart charging;
conducted trials in other countries, but was only able to quantify the SRL = secondary reserves; LCFS = Low Carbon Fuel Standard LCFS credit sales calculated assuming a 2016 Nissan Leaf with average
balancing benefits for Denmark given that it is the only market where EVs U.S. driving habits, charged with electricity from the California power grid. The values shown in the third row reflect modeled values for a real
trial project at the Los Angeles Air Force Base in California—final values are not publicly available. Converted from USD at 1.4 NZD/USD
are able to earn money by feeding electricity back into the network.
V2G can provide financial benefits to EV customers.
21 Yilmaz, M., and Krein, P. (2012), Review of Benefits and Challenges of Vehicle-to-Grid Technology,IEEE Energy Conversion Congress and Exposition (ECCE)
22 Bloomberg (2017), Parked Electric Cars Earn $1,530 From Europe's Power Grids https://www.bloomberg.com/news/articles/2017-08-11/parked-electric-cars-earn-1-530-feeding-power-grids-in-europe
23 Innovate UK (2017), Innovation in vehicle-to-grid (V2G) systems: feasibility studies
22 24 EPRI (2016), Vehicle-to-Grid - State of the Technology, Markets, and Related Implementation
25 International Council on Clean Transportation (ICCT) (2017), Literature review on power utility best practices regarding electric vehiclesPUBLIC CHARGING AND FUTURE OF NON-OWNERSHIP
Public charging Future of non-ownership
The availability of public charging infrastructure supports the increased The emergence of car-riding schemes such as Uber and Lyft are part of a
uptake of Evs as it enables the possibility to complete journeys beyond the global trend towards a sharing or on-demand economy. In such an
battery range and reduces range anxiety. Offering public fast-chargers in economy, expensive assets with low utilisation, such as cars, are no longer
proximity to residential neighbourhoods could also discourage customers owned by individuals since service providers are able to offer the same
from installing the more expensive fast and rapid chargers at home and service at a lower cost by increasing utilisation of the assets, such as more
therefore reduce low-voltage network impacts. trips per car. In the mobility sector, this is also referred to as ‘Transport As A
Service’ (TAAS). Due to their lower operation and maintenance cost, EVs will
In order to harness the potential of analytics and digitalisation, strengthen the TAAS business model by lowering life-cycle cost compared
communication and data exchange should be facilitated primarily to to conventional cars. The penetration of autonomous drivers could further
understand EV owner behaviour and the need to provide adequate lower the cost of TAAS and mean society, at least in cities, could see a
charging infrastructure. Amsterdam, a city leader in EV uptake, has put in massive shift away from personal car ownership to fleet ownership in TAAS.
place a demand-led public charging expansion plan26. Under this plan, EV
owners put in an online request for a new public charging location. The Such a future is possible within the
request is evaluated based on the walking distance to the nearest existing next 10 years and would
station, the occupancy rate of the nearest stations and previous requests considerably change charging
for the location under consideration. requirements and low-voltage
network impacts. Fleets would be
The city of Amsterdam is also collaborating with local universities to learn charged at a depot or public
from data collected at the 2000 charging points and 48000 monthly charging points that connect to the
charging sessions. Apart from building national research capabilities, this network at high-voltage level and
data has provided a deeper understanding of consumer behaviour and is does not stress the grid at local
expected to provide insights on how to influence behaviour and optimise low-voltage level.
the future roll-out strategy for EV charging infrastructure.
26 Vertelman, B. and Bardok, D. (2016), Amsterdams demand-driven charging infrastructure
23CHARGING AHEAD 24
NEXT STEPS TO SUPPORT EV UPTAKE
Effective electricity network integration is a key pillar of successful EV
uptake. In order to ensure customer choice and support EV uptake in
NZ, future network investment and integration risks need to be
considered today while taking into account technical, regulatory,
affordability and societal implications.
Even at today’s low EV penetration – co-ordination and knowledge
development are essential to enable the transition to high EV
penetration and avoid duplication cost, ex-post interventions, as well as
developing a positive public image of EVs and EV charging
infrastructure.
Vector is looking to engage with leading stakeholders in NZ to
collaborate in research and demonstration programs, exchange
expertise and data, and develop a regulatory framework in which EVs
can thrive and NZ can reap the societal benefits of EV uptake identified
by the government.

25
CREATING A NEW
     ENERGY FUTURE
     ENGAGE WITH US TO SUPPORT EV UPTAKE
     Mark Toner, Head of Public Policy & Regulatory Counsel, mark.toner@vector.co.nz
     Steve Heinen, Policy Advisor Strategic Planning & Technology Integration, steve.heinen@vector.co.nz

26
You can also read