Assessment of methods practiced in the disposal of solid waste in Eastleigh Nairobi County, Kenya
←
→
Page content transcription
If your browser does not render page correctly, please read the page content below
AIMS Environmental Science, 7(5): 434–448.
                                                    DOI: 10.3934/environsci.2020028
                                                    Received: 16 June 2020
                                                    Accepted: 16 October 2020
                                                    Published: 29 October 2020
http://www.aimspress.com/journal/environmental

Research article

Assessment of methods practiced in the disposal of solid waste in
Eastleigh Nairobi County, Kenya

Joseph Muiruri1,*, Raphael Wahome2 and Kiemo Karatu3

1   Wangari Maathai Institute for Peace & Environmental Studies (WMI), College of Agriculture and
    Veterinary Sciences, University of Nairobi, P. O. Box 29053-00625 Nairobi, Kenya
2   Department of Animal Production, University of Nairobi, Kenya
3   Department of Sociology, University of Nairobi, Kenya

*Correspondence: Email: mumbiro@yahoo.com; Tel: +254722243653.

Abstract: Solid waste management is a documented threat to health and the environment to many
countries in sub-Saharan Africa. Rapid industrial development and urbanization have seen a rise in
urban population which translates to massive production of solid waste. Though most urban and city
planners have adopted new technologies such as landfills and incineration these alone cannot work
without training residents on best practices that will guide them on how to manage their waste. Both
health and environmental implications are associated with solid waste management and amounting in
urgency especially in developing countries. The study aimed to assess the methods used by residents
of Eastleigh South Ward in Nairobi County to dispose of their solid waste at the household level.
Various waste disposal methods were documented during field observation and interviews while
secondary data was obtained from records and reports on the management of waste in Nairobi
County. About 48% of the resident indicated they discard waste along the road in heap/drainage,
further 35% indicated putting waste in dust bins which eventually ends up in undesignated areas. The
study also documents challenges related to waste management including infrequent /irregular waste
collection, illegal dumping, low levels of information on poor waste disposal, and lack of concern
among residents. Other challenges included irresponsible waste management approaches by the
Nairobi County Government as well reluctance to pay private garbage collectors and high cost of
disposal services charged by private garbage collectors. Promoting awareness through public
education on the management of solid waste will enhance proper solid waste management practices.
The study further recommends allocation of more resources to allow for effective management of
solid waste.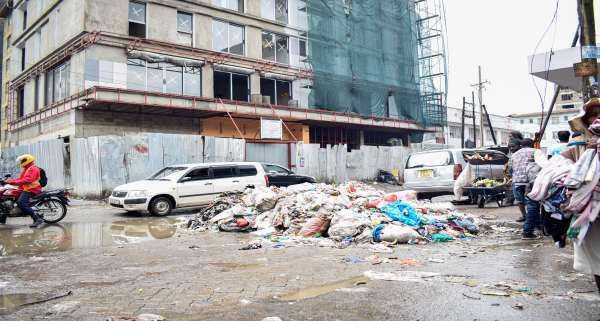
435

Keywords: solid waste; disposal; environment; public awareness; practices

1.   Introduction

     Mahar et al. [1] defines solid waste as biodegradable and non-biodegradable material along with
other refuse occasioned by human and animal activities which are of little value and mostly done
away with. Empirical evidence from the literature on urban development show that rapid population
growth has led to a massive generation of solid waste resulting from poor waste disposal systems in
cities and urban areas.
     According to Nabegu [2], urban waste management sector is facing numerous challenges
globally especially due to the large amounts of municipal and industrial wastes produced daily. A
report by UNEP [3] acknowledges that it is estimated that every year about 3.4 to 4 billion tons of
solid waste and up to 300 million tons of hazardous waste are produced globally. Thus, the huge
increase in the volume of solid waste will witness unprecedented scale of environmental risks such
as diseases, ecosystem degradation contamination of soil and water, global warming and climate
extremes. According to Ayodeji [4], the risks posed by poor management and disposal methods are
more obvious in the developing countries who are the greatest consumers of industrial materials as
well as outdated and obsolete technological products.
     In the last two decades environmental degradation has continued to attract the attention within the
global community a situation that has made more people to become increasingly conscious of
variety of environmental issues such as global warming, air, water and land pollution. Most
literature on environmental sustainability shows that almost all types of environmental pollution
result from human induced activities. Fernando [5] believes that it is important for residents to
understand the need for sustainable disposal mechanisms as a solution to the dangers posed by
environmental pollution.The main purposes of Solid Waste Management strategies are to address the
environmental, health, aesthetic, economic and land-use concerns attributed to improper waste
disposal for nations, municipalities, corporations, and individuals around the world [6,7]. Asmawati
et al. [8] argues that there is no material in this world that is not useful in one-way or the other or
which is created out of nothing but it is through ignorance that man considers certain things as waste
and others as useful.
     Wilson et al. and Munyaga, N [9,10] opined that management of solid waste systems have
resulted in major challenges for emerging cities more so in underdeveloped countries. Further,
Safiuddin et al. [11] observed waste management problem continue to deepen owing to heightened
human activities. Wilson et al. [12] pointed out that the main challenge with disposal of waste stems
from poorly grounded strategies that occasion littering, illegal waste disposal including burning.
According to Kassim S.M Ali [13] waste occasioned by human activities should be discarded to
reduce risk to the environment and health of humans and animals. Further, inadequate collection of
poorly disposed of solid waste results in an increase of pathogens that cause air and water-borne
diseases since they play hosts to other disease vectors such as mosquitoes, flies and rodents.
Kassenga et al., Omofonmwan er al. and Leah Oyake-Ombis [14–16] argued that dumpsites being
the initial waste collection sources, become reservoirs of most polluting agents making them
environmental polluting zones for soil, air, ground and surface water. In the last two decades, Kenya
has recorded tremendous industrial development in line with the vision 2030, a situation that has seen

AIMS Environmental Science                                                     Volume 7, Issue 5, 434–448.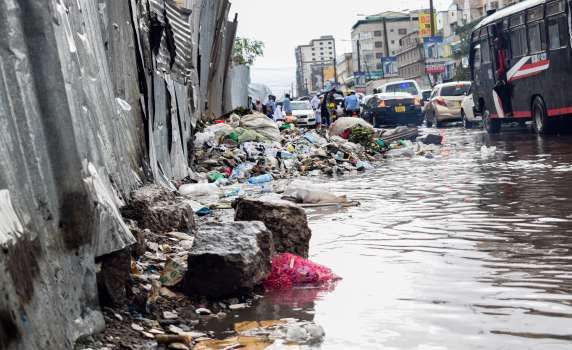
436

an influx of population to the urban centers which are likely to increase solid waste generation to
higher levels, hence the need for urgent waste disposal mechanisms. Management of solid waste
in urban areas of Kenya is a real challenge while the existing disposal systems are haphazard and
inefficient. Otieno and Gakungu [17,18] opined that a good proportion of all solid waste generated in
urban areas ranging between 30%–40% remain uncollected, while solid waste generation rate
exceeds one kilogram per capita per day, [19]. Moreover, urban management bodies have failed to
implement solid waste management systems that are sustainable resulting in enhanced illegal
dumping in open fields that pose unfavorable effects on the environment hence negatively impacting
public health systems.
     Data obtained from KNBS [20] estimates that of the 47.5 million people, 34.8% translating to 10
million of the total population in Kenya are inhabitants of urban centres with the five major urban
centres of Nairobi, Mombasa, Kisumu, Nakuru and Eldoret accounting for a third of the total urban
population. Nairobi County’s population is estimated to be about 4. 3 million people who generate
about 2400 tons of solid waste daily, a worrying trend and King’oo [21] observed that if proper
measures for the management of waste are not put into place, this scenario will continue to foster
further socio-economic, environmental and institutional challenges for Nairobi county.
     Nairobi city like some other cities in Africa lacks effective systems of solid waste management
resulting in negative short and long-term impacts on human health and the environment in
general [22]. According to Musyoka [23], if these challenges are not addressed by 2030 the county
could generate 35% more waste than it does today. Muniafu et al. [24], observed that various
legislations in Kenya mandates local authorities with the task of managing solid waste. However, the
implementation of these policies and legal provisions have not been systematic and lack
coordination. According to Nairobi Solid Waste Management Plan [25], of all waste generated in
Nairobi 68% is domestic, making it prudent to focus on types of solid wastes generated as well as the
methods used in disposing of waste by the residents.
     The research was carried out in Eastleigh suburb one of the most populated zones in Nairobi
County, mainly due to high influx of Somali population as well as the emergence of numerous
wholesale and retail businesses. The population is a mix of middle and low-income neighbourhoods.
1st Avenue the main street in Eastleigh has buildings with multiple uses such as business malls, with
the basements used as storage facilities, while the upper floors have been converted into residential
areas. Further, open spaces are used as open-air garages, parking lots while the alleys and pedestrian
walks are used by small scale traders and hawkers selling all sorts of goods such as clothes, shoes,
electronics as well as vegetables and fruits. The activities carried out have led to generation of high
volumes of solid waste which is poorly stored and disposed posing a serious public health and
environmental hazards. Residents’ behavioural practices towards generation, handling and disposal
of solid waste is wanting because they use unorthodox methods disposing of waste anywhere they
find convenient irrespective of whether it is a designated site or not. A big percentage of waste is
discarded along the road, in open spaces and drainage channels. The study sought to answer the
research question; What are the methods used by the residents in solid waste management in
Eastleigh Nairobi County? .The study was premised on the researcher’s hypothesis that methods of
solid waste adopted by residents of Eastleign in Nairobi County are poor.

AIMS Environmental Science                                                     Volume 7, Issue 5, 434–448.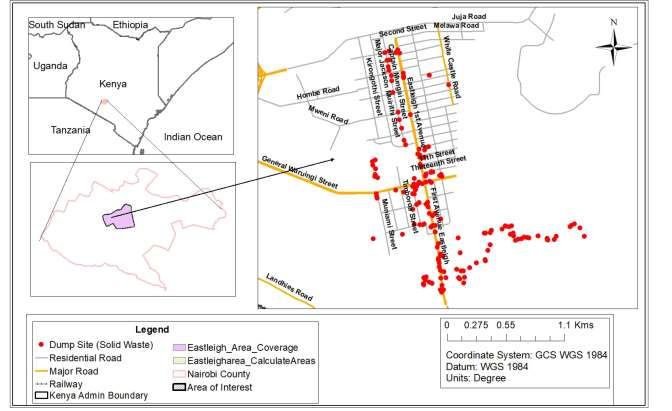
437

2.   Materials and method

2.1. Study site

    This research was carried out in Eastleigh South Ward within Kamukunji Sub-County in Nairobi
County, Kenya. The area of study is situated in the eastern part of Nairobi city at geographical
coordinates of; 1.2734°S, 36.8481°E. The study area is cosmopolitan and is one of the busy
commercial hubs of Nairobi County. Many of the businesses are owned by the Somali community.

                                 Figure 1. Map of area of study.

2.2. Sample size and sampling

     Eastleigh South Ward is within Kamukunji Sub-County, Nairobi County which covers an area of
12 square kilometres carrying a population of 263462 persons. Eastleigh South Ward the main focus
of the study covers approximately 4.02431 square kilometres carrying a population of 89968 persons
and an estimated 29022 households. The area has an average household size of 3.1 persons spread
over 10.552 square kilometres. For the study a sample size of 188 households was derived which was
rounded up to the nearest hundred to a sample size of 200 households using the formula below;
n =(z2 x p x q x N)
e2 (N – 1) + (z2 x p x q), where:
n = Sample size (being determined)
N = Population size (29022)
p = Sample proportion (assumed to be 0.02, if not given)

AIMS Environmental Science                                                 Volume 7, Issue 5, 434–448.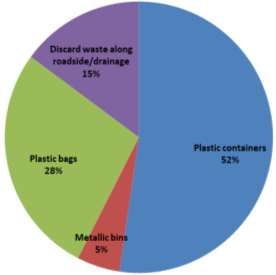
438

q=1–p
e = 0.02 (since the acceptable error should be 2%)
z = Standard deviation at a given CI (z = 1.96 at 95% CI)

2.3. Data collection

     Primary data was collected through random sampling targeting households within the area of
Study from April through to May 2019. Quantitative data was obtained through use of numeric data
(outline) that is measurable while the qualitative method involved both descriptive and conceptual
data (outline) to provide in-depth information. Data collection involved use of questionnaires,
interviews, field observation and document analysis. The study used a face to face interview with
respondents and key informants from randomly selected households, shop attendants, street vendors
and hawkers. The questionnaires employed involved both structured and semi-structured questions to
gather more data from the respondents on methods used to manage generated waste. Sampled
households were picked depending on accessibility, availability and willingness of the respondents to
participate in the survey while secondary data was obtained through a review of census and survey
reports as well as previous research studies on the management of solid waste. Further, field
observations documented important information on modes of waste disposal through the use of
Figure 2, 5 and 7 and physical observation. Mixed methods approach enabled the researcher to cross-
check the data to enable valid and credible results [26].

2.4. Data analysis

    Both quantitative and qualitative data obtained from questionnaires and interviews were coded
and analyzed using Statistical Package for Social Sciences (SPSS) version 21.0. Descriptive statistics
were obtained and presented in frequencies and percentages for the following variables; methods,
waste composition, level of solid waste, waste storage and demographic characteristics. The study
assessed the relationship between household demographic characteristics and management of solid
waste practices using cross-tabulation and chi-square analysis at a significance level of less than 5%.

3.   Results and discussion

3.1. Sample distribution

    According to population studies, demographic characteristics consist of age, family size,
material status, education level and income, which according to Castagna et al. and Chu et al [27,28]
are critical when dealing with the evaluation of the management of solid waste practices within
populations. The demographic characteristics of the respondents are presented in Table 1, where
57.6% male and 42.4% female with a mean age of 25–34 years were interviewed. Of these about
55.1%were married. On education, the majority had attained secondary level (55.9%) while (35.6%)
had middle-level college education. Slightly less than half of the individuals (43.2%) had a monthly
income of between Ksh. 10000–20000.

AIMS Environmental Science                                                     Volume 7, Issue 5, 434–448.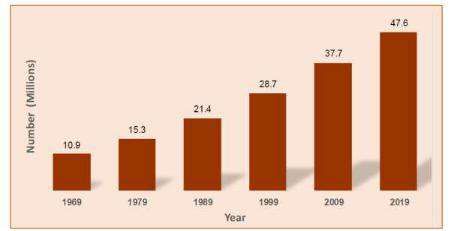
439

                             Table 1. Responses to demographic characteristics.
Demographic characteristics                                     Male         Female          Total
Age group                   18–24 Years                  N      17           15              32
                                                         %      14.40%       12.70%          27.10%
                                  25–34 Years            N      26           23              49
                                                         %      22.00%       19.50%          41.50%
                                  35–44 Years            N      15           5               20
                                                         %      12.70%       4.20%           16.90%
                                  45–54 Years            N      9            6               15
                                                         %      7.60%        5.10%           12.70%
                                  Over 55 Years          N      1            1               2
                                                         %      0.80%        0.80%           1.70%
                                  Total                  N      68           50              118
                                                         %      57.60%       42.40%          100.00%
Marital status                    Married                N      36           29              65
                                                         %      30.50%       24.60%          55.10%
                                  Single                 N      29           16              45
                                                         %      24.60%       13.60%          38.10%
                                  Separated              N      1            3               4
                                                         %      0.80%        2.50%           3.40%
                                  Widowed                N      2            2               4
                                                         %      1.70%        1.70%           3.40%
                                  Total                  N      68           50              118
                                                         %      57.60%       42.40%          100.00%
Education level                   None                   N      1            0               1
                                                         %      0.80%        0.00%           0.80%
                                  Primary                N      5            4               9
                                                         %      4.20%        3.40%           7.60%
                                  Secondary              N      38           28              66
                                                         %      32.20%       23.70%          55.90%
                                  College                N      24           18              42
                                                         %      20.30%       15.30%          35.60%
                                  Total                  N      68           50              118
                                                         %      57.60%       42.40%          100.00%
Monthly income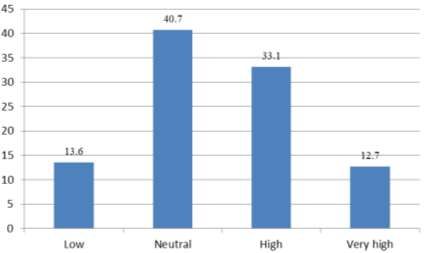
440

3.2. Responses to the composition of solid waste

     Much of the waste generated within the area is organic (51.5%) and the other half is inorganic
(48.5%) (Table 2).The study identified packaging materials are increasingly becoming a critical
component of solid waste as earlier observed by Firdaus et al. [29] who contends that as the gross
national product and urban population growth rises, paper and packaging waste will also increase.
Ampofo et al. [30] contends that food-stuffs waste is greatly produced at the stage of wrapping,
preparation and use. A variety of containers used for wrapping most items for sale is dumped in the
environment, this has led to the development of many illegal dumpsites which creates unhealthy
environment and blockage of sewerage systems resulting in flooding especially during the rainy
season.
     As a result, a substantial amount of the waste within the designated collection sites remained
uncollected which accumulate into filthy huge moulds that negatively impact on the quality of air in
the surrounding neighbourhoods.

                     Figure 2. A heap of solid waste along 1st Avenue, Eastleigh.

                         Table2. Responses on the composition of solid waste.
Type of waste                Number of persons in a household
441
3.3. Levels of solid waste generated
The study sought to rate the level of waste generated from respondents. Figure 3 indicates how
respondents rated the levels of waste in their residential area.40.70% reported that the levels were
neutral with 33.10% indicating levels were high while only 12.70% said the levels were very high.
Figure 3. Responses on the level of waste generated.
With the rapid increase of population from natural causes and rural-urban migration, waste
generation has increased tremendously much of which is poorly handled ending up in undesignated
dump sites. In a study by Dhamija [31], India in 2001, the population in the urban areas had
increased to 93.0% from 52.7% in 1901. This led to a significant increase in solid waste in urban
areas resulting in a hazardous dimension. The waste estimate generation increased from 4500 Metric
Tonnes/day (MT/day), 6,500 MT/day to 12000 MT/day in the year 1981, 1991, and 2001
respectively. This is expected to rise to 17000–25000 MT/day by 2021with assumption of 6–8%
growth rate. In Kenya, there is a similar situation of population increase where from 1969 to 2019
the population has grown from 10.9M to 47.6M (Figure 4) with about 26.3% population increase
from year 2009–2019 [20].
Figure 4. Population trend, 1969 to 2019 [20].
AIMS Environmental Science Volume 7, Issue 5, 434–448.442
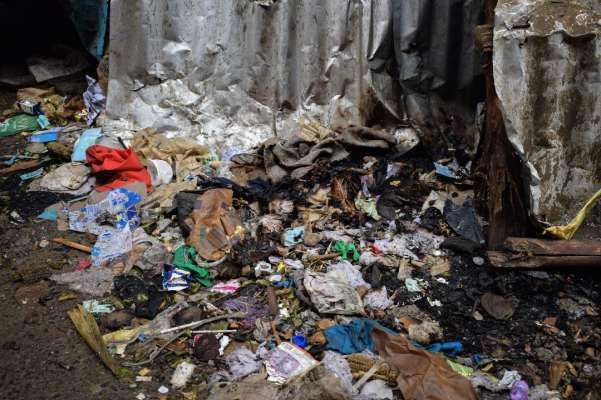
During the field visit (Figure 5) observations showed waste was usually disposed unsorted in
heaps in undesignated areas. According to Firdaus et al. [29], waste generated is drastically increased
when relevant agencies charged with collecting and disposing are unable to deal with the large
quantities produced on daily basis. This results in the accumulation and rotting of uncollected
garbage at collection sites.
Figure 5. Solid waste dumped on the road (Eastleigh 2nd Avenue).
3.4. Storage and collection
The study investigated types of containers used for storage and collection of waste in Eastleigh
suburb. Figure 6 highlights the responses to the study question. Responses revealed that containers
made of plastic (bags and buckets) were the most preferred at 52% and 28% respectively; evidently
these are the most commonly used. The study observed that 15% of the respondents discarded their
waste in undesignated areas such as roadsides and drainage tunnels with a paltry 5% storing their
waste in covered bins. However, the study observed that though some respondents stored their waste
in plastic buckets, plastic bags and metallic bins, most of this waste was disposed at the undesignated
dumping sites as shown in the Figure below. The haphazard dumping of solid waste in open spaces
are a great risk to the environment as it leads to air, water and land pollution.
3.5. Solid waste disposal management
Regarding solid waste disposal management, 31.8% indicated that residents within the area
managed collection and disposal by enlisting private garbage collectors. However, 68.2% indicated
they are not involved in any form of management of solid waste services, resulting in most of the
generated waste being poorly disposed. The respondents indicated that while some residents paid for
the services by private service providers, others opted to take their waste at designated garbage
collection points where it is collected at specific times by the County Government garbage trucks.
The study was able to identify other waste disposal options available to the residents. A good number
(48.0%) opts to discard waste along the road, in the drainage channels and other undesignated points
with 25.1% indicating they stored waste in dustbins which they eventually took to designated
AIMS Environmental Science Volume 7, Issue 5, 434–448.443
collection points. A small number of residents (4.7%) prefer storing waste in dustbins and later
empty it in the county skips usually found in designated sites within the area, with only (8.8%)
preferring burning, nature of waste notwithstanding. Out of the total number of respondents
interviewed only 3.5% indicated that they recycled some of the waste (Table 3). The study also
established waste collection intervals ranged between once a week at 61.0%, twice a week at 28.8%
while 3.4% indicated that waste was irregularly collected. However, 5.1% of the respondents
indicated waste is never collected at all (Table 3).
Figure 6. Responses on methods used in waste storage.
Table 3. Responses to methods of waste disposal and collection frequency.
Methods of disposal N % Frequency of collection N %
Discarding along the road in a heap/drainage 82 48.0 Once a week 72 61.0
Putting in a dust bin 60 35.1 Two times a week 34 28.8
Burning 15 8.8 Everyday 2 1.7
Disposing at designated collection points 8 4.7 Irregular 4 3.4
Recycling 6 3.5 Zero collection 6 5.1
Total 171 100.0 Total 118 100
Evidence from field observation reveals that most respondents at 61.0 % discard their wastes in
drainage channels and by the roadside. This is occasioned by a haphazard manner of waste collection
by private waste collectors and Nairobi County government. Waste stored in dustbins ends up being
discarded on the roadside or in drainage channels since some residents default on payment to service
providers while others cannot afford it. When the discarded waste piles up some residents result in
burning affecting the air quality within the vicinity an argument supported Giusti [32] who contends
that continuous burning of solid waste in the open causes health problems to those exposed to
inhalation of the ambient gases released into the air and in turn leads to respiratory and eye problems.
AIMS Environmental Science Volume 7, Issue 5, 434–448.444
Figure 7. Burnt solid waste off 2nd Avenue, Eastleigh.
According to Ampofo S et al. and Leah Ombis [16,30] several issues identified that rendered
solid waste unmanageable, include; resident’s reluctance to pay for private service providers,
inefficiency over waste collection and disposal services by the relevant county authority, inadequate
public awareness and unreliable means of transporting waste to Dandora landfill. For Giusti [32], to
overcome these challenges, Nairobi county government should adopt sustainable management of
solid waste including but not limited to waste minimization/prevention, waste re-use, recycling and
composting. Ampofo et al [30] further argues that waste that is not recyclable, reused or composited
other methods such as incineration and landfilling processes can be adopted. In Denmark, Sweden,
Netherlands and Austria for instance, organic waste is not subjected to incineration due to its high-
water content rather, separation of waste at the source allows removal of hazardous waste,
complementing composting and recycling options 4 [33]. It is instructive that more information on
alternative sustainable management methods of solid waste is key to achieving sustainable, clean and
safe environment.
3.6. Reasons for poor solid waste disposal
Un-Habitat [34] report on sustainable cities, has identified poor management of solid waste as a
major challenge towards the promotion of a sustainable environment and livelihoods. Table 4
highlights responses on the challenges affecting the management of solid waste in the studied area
with 37.2% indicating that they were not bothered by the state of poorly disposed waste, 16.8%
identified lateness of service providers in waste collection, 12.4% cited lack of information on
appropriate waste management methods while 5.8% indicated reluctance in paying service providers
fee with another 9.5% identifying inefficiency by the Nairobi county government as the main
AIMS Environmental Science Volume 7, Issue 5, 434–448.445
challenge. 5.1% indicated high charges of waste collection fee and poor cooperation among residents
and service providers as the reason for poor management in waste disposal.
Table 4. Responses on reasons for poor management of solid waste in Eastleigh.
Reasons for Poor Management of solid waste N Percent
Lack of concern 51 37.2%
Lateness in the collection of waste 23 16.8%
Reluctance to pay private waste collectors 8 5.80%
High charges of waste collection 7 5.10%
Poor cooperation among residents and private waste collectors 7 5.10%
Lack of appropriate information on the management of waste 17 12.40%
Failure by Nairobi County Government to take their responsibility seriously 13 9.50%
Poor transportation 1 0.70%
Poor storage 2 1.50%
Informal settlements 6 4.40%
Poorly managed collection points 1 0.70%
Increase in population 1 0.70%
Total 137 100.0%
Findings conclude that lack of concern by residents on good management practices of solid
waste has led to negative impacts on solid waste disposal damaging the environment. Ampofo et al.
opines that some residents shun appropriate management methods of waste to avoid meeting the
costs of service providers. Further Findings indicate that some residents decry the services rendered
by private collectors as unsatisfactory owing to delays and irregular collection hence the
unwillingness to pay, leaving them with no choice but to use unorthodox means of disposing
waste [30], citing UN-Habitat Report [34], argues that the generation of waste is inevitable due to the
rapid increase in urban population, hence the need for concerted efforts by national governments and
urban authorities in the development of sustainable cities. According to Tiwari [35], though most
urban authorities developed environmental policies and legislation, implementation remains a pipe
dream. To address these challenges Boadi et al., Parrot et al. and Henry et al. [36–38] highlights the
need to adopt sustainable management strategies to enable address negative consequences related to
the unregulated management of solid waste practices.
4. Conclusion
After careful analysis of the data gathered it is imperative to conclude that uncollected solid
waste has become the most visible environmental problem particularly among the low and middle-
income neighborhoods within Nairobi’s Eastleigh South Ward. This scenario is supported by Leah
O. Ombis [16], that Nairobi city county government waste management system is fraught with many
problems and has no clear systems and process to deal with an estimated 2400 tons of waste
generated daily. The study was able to identify the challenges that Eastleigh residents experienced in
regard to solid waste disposal and collection systems. Various challenges were identified which
include; failure by the county government authority to prioritize implementing various guidelines
and legislation on waste management, inefficiency in waste collection and poor infrastructure. In
addition, activities of multiple actors involved are poorly coordinated, while in some sections of the
AIMS Environmental Science Volume 7, Issue 5, 434–448.446
area of study, waste collection systems are non-existent and even where services are found, they are
riddled with many challenges that include residents' inability to pay.
5. Recommendations
Nairobi County Government should enforce existing management of solid waste policies and
legislations as spelled out in Environment Management and Coordination Act 2019, the Kenyan
Constitution (2010) [39] and in the Nairobi county solid waste management Act 2015. Nairobi
County government should engage other stakeholders in sensitizing residents on sustainable
management systems on the solid waste that include separation, reuse and recycling. Nairobi county
government should institutionalize management of waste processes by investing in efficiency and
infrastructural capacity by providing skips, trucks, bins, as well as guidelines on modalities to service
providers on proper waste Management. The findings of the study can be replicated in other urban
centres of developing Countries. This would help mitigate environmental issues associated with poor
waste management systems.
Acknowledgments
I’m grateful to my supervisors Prof. Wahome and Dr. Kiemo for their devotion and guidance,
Wangari Maathai Institute staff for their unwavering support. I would also like to thank all my
respondents in Eastleigh estate for their contributions. All the research was self-funded.
Conflict of interest
The authors declare no conflicts of interest regarding the publication of this paper.
References
1. Mahar A, Malik R, Qadir A (2007) Review and analysis of current management of solid waste
situation in urban areas of Pakistan. In Proceedings of International Conference. Sustainable
Solid Waste Management. 5–7 Sept. 2007. Chennai, India, 34–41, gongolwa PG (2007)
Evaluation.
2. Nabegu A (2010) An analysis of municipal solid waste in Kano Metropolis, Nigeria. J Human
Ecol 31: 11–119.
3. United Nations Environmental Programme (UNEP) (2011) Towards a green economy. Pathway
to Sustainable Development and Poverty Eradication. Nairobi: United Nations.
4. Ayodeji I (2010) Exploring secondary school students’ understanding and practices of waste
management in Ogun State, Nigeria. Intl J Env Sci Educ 5: 201–215.
5. Fernando R (2019) Solid waste management of local governments in the Western Province of
Sri Lanka: An implementation analysis. Waste Manage 84: 194–203.
6. Henry R, Yongsheng Z, Jun D (2006) Municipal management of solid waste challenges in
developing countries–Kenyan case study. Waste Manage 26: 92–100.
7. Nemerow N, Agardy F, Salvato J (2009) Environmental engineering: environmental health and
safety for municipal infrastructure, land use and planning, and industry. John Wiley & Sons.
AIMS Environmental Science Volume 7, Issue 5, 434–448.447
8. Asmawati D, Nor Ba’yah A, Fatimah Y (2010) A Study on the Knowledge, Attitudes,
Awareness Status and Behaviour Concerning Solid Waste Management School of Psychology
and Human Development, Universiti Kebangsaan Malaysia, 43600 UKM Bangi, Malaysia.
9. Wilson D, Velis C, Cheeseman C (2006) Role of informal sector recycling in waste
management in developing countries. Habitat Int 30: 797–808.
10. Munyaga N (2016) Challenges of solid waste disposal in Gachororo, Kiambu County.
University of Nairobi Press.
11. Safiuddin M, Jumaat M, Salam M, et al. (2010) Utilization of solid wastes in construction
materials. Int J Phy Sci 5: 1952–1963.
12. Wilson D, Rodic L, Scheinberg A, et al. (2012) Comparative analysis of solid waste
management in 20 cities. Waste manage res 30: 237–254.
13. Kassim S, Ali M (2006) Solid waste collection by the private sector: Households’ perspective in
Dar-es-Salaam city, Tanzania. Habitat Int 30: 769–780.
14. Kassenga G, Mbuligwe S (2009) Impacts of a Solid Waste Disposal Site on Soil, Surface Water
and Groundwater Quality in Dar es Salaam City, Tanzania. J Sust Dev Africa 10: 73–94.
15. Omofonmwan S, Eseigbe J (2009) Effects of solid waste on the quality of underground water in
Benin Metropolis, Nigeria. J Human Ecol 26: 99–105.
16. Leah O (2018) How Nairobi can fix its serious waste problem. Quartz Africa.
17. Otieno J (2010) Management of solid waste in Uganda: Issues Challenges and Opportunities.
POVIDE programme Workshop. The Netherlands.
18. Gakungu N, Gitau A, Njoroge B, et al. (2012) Management of solid waste in Kenya: A case
study of public technical training institutions. ICASTOR J Engineer 5: 127–138.
19. Tilahun E, Bayrakdar A, Sahinkaya E, et al. (2017) Performance of polydimethylsiloxane
membrane contactor process for selective hydrogen sulfide removal from biogas. Waste manage
61: 250–257.
20. KNBS (2019) Kenya Population and Housing Census Volume I: Population by County and Sub-
County.
21. Stephen N (2019) Assessment of Household Domestic Waste Management Practices, Kiambu
County- Kenya. South-Eastern Kenyan University (SEKU) Repository.
22. Njoroge B, Kimani M, Ndunge D (2014) Review of Municipal Management of solid waste: A
Case Study of Nairobi, Kenya. Int J Engineer Sci 4: 2319–6483.
23. Musyoka M (2019) Assessment of Community Perception, Policies and Land use factors in
relation to Climate Change Processes in Nairobi city (Doctoral dissertation, JKUAT-IEET).
24. Muniafu M, Otiato E (2010) Solid Waste Management in Nairobi, Kenya. A case for emerging
economies. J Lang Technol & Entre Africa 2: 342–350.
25. National Environment Management Authority (2014) National Management of solid waste
Strategy, Nairobi. Kenya.
26. Bryman A (2004) Social research methods (2 ed.). New York: Oxford University.
27. Castagna A, Casagranda M, Zeni A, et al. (2013) 3R’S from Citizens Point of View and Their
Proposal from a Case-Study. UPB Sci Bull 75: 253–264.
28. Chu Z, Wang W, Wang B, et al. (2016) Research on factors influencing municipal household
solid waste separate collection: Bayesian belief networks. Sustainability 8: 152.
29. Firdaus G, Ahmad A (2010) Management of urban solid waste pollution in developing
countries. Int J Env Res 4: 795–806.
AIMS Environmental Science Volume 7, Issue 5, 434–448.448
30. Ampofo S, Soyelle J, Abanyie S (2016) The Negative Impacts of Poor Municipal Management
of solid waste on Livelihoods in Walewale Township, West Mamprusi District, Ghana: A Social
Survey and Assessment. International Institute for Science, Technology and Education.
31. Dhamija U (2006) Sustainable solid waste management: Issues, policies, and structures.
Academic Foundation.
32. Giusti L (2009) A review of waste management practices and their impact on human health.
Waste manage 29: 2227–2239.
33. Saveyn H, Eder P, Ramsay M, et al. (2016) Towards a better exploitation of the technical
potential of waste-to-energy. Seville: European Commission.
34. Un-Habitat (2010) Management of solid waste in the world's cities. UN-HABITAT.
35. Tiwari A (2019) Integrated Management of solid waste Turns Garbage into Gold: A Case Study
of abalpur City. Waste Manage Res Effi 385–392.
36. Boadi K, Markku K (2005) Environment and health impacts of household solid waste handling
and disposal practices in the third world cities: the case of Accra metropolitan area, Ghana. J
Env Health. 68: 34–36.
37. Parrot L, Sotamenou J, Dia B (2009) Municipal management of solid waste in Africa: Strategies
and livelihoods in Yaoundé, Cameroon. Waste Manage 29: 986–995. Republic of Kenya
(2012a), County Government Act, Nairobi.
38. Henry R, Yongsheng Z, Jun D (2006) Municipal management of solid waste challenges in
developing countries–Kenyan case study. Waste manage 26: 92–100.
39. Constitution of Kenya (2010) Government Press.
© 2020 the Author(s), licensee AIMS Press. This is an open access
article distributed under the terms of the Creative Commons
Attribution License (http://creativecommons.org/licenses/by/4.0)
AIMS Environmental Science Volume 7, Issue 5, 434–448.You can also read