EVALUATION OF MANAGEMENT PROCEDURES FOR THE INSIDE POPULATION OF YELLOWEYE ROCKFISH REBUILDING PLAN IN BRITISH COLUMBIA
←
→
Page content transcription
If your browser does not render page correctly, please read the page content below
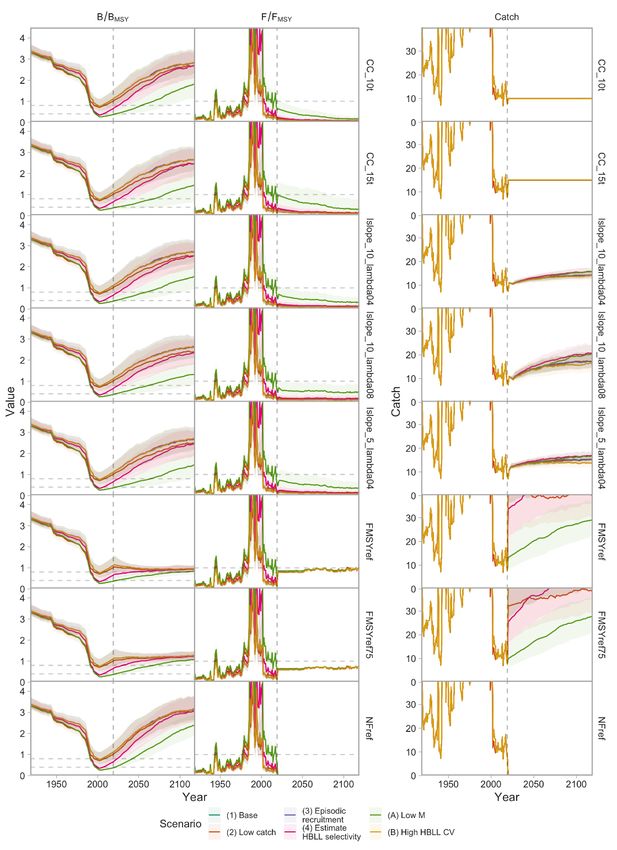
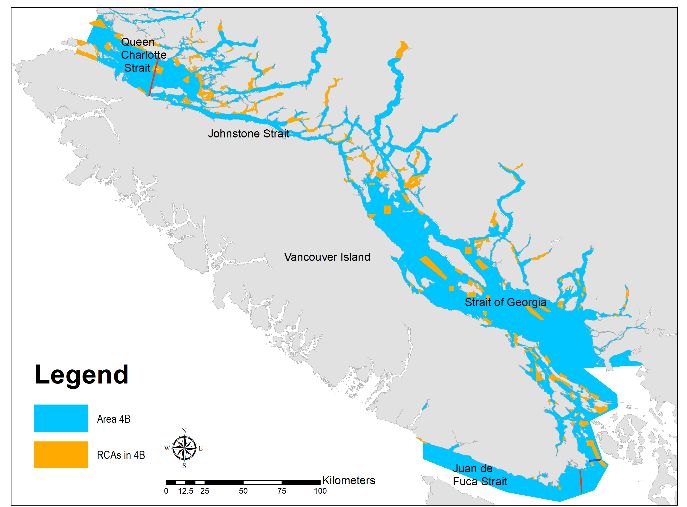
Canadian Science Advisory Secretariat
Pacific Region Science Advisory Report 2020/056

 EVALUATION OF MANAGEMENT PROCEDURES FOR THE
 INSIDE POPULATION OF YELLOWEYE ROCKFISH
 REBUILDING PLAN IN BRITISH COLUMBIA

 Yelloweye Rockfish, Sebastes ruberrimus (DFO Figure 1. Map of Groundfish Management Area 4B
 ROV team, 2011). showing Rockfish Conservation Areas (RCAs) and
 the presumed extent of the Inside Yelloweye
 Rockfish population (area bounded by red lines).

 Context:
 Under Canadian policy and legislation, fish stocks that have been assessed as being below the Limit
 Reference Point (LRP) require a rebuilding plan to grow the stock above the LRP. Rebuilding plans
 should be based upon objectives characterized by: (1) a target; (2) a desired time to reach the target;
 and (3) an acceptable probability of reaching the target. Rebuilding plans should also include planned
 management measures or management procedures (MPs), milestone objectives, and undergo regular
 evaluation. The inside stock of Yelloweye Rockfish (Sebastes ruberrimus, Inside Yelloweye Rockfish) is
 a data-limited stock, occurring in Groundfish Management Area 4B (Queen Charlotte Strait, Strait of
 Georgia, and Strait of Juan de Fuca) in British Columbia (BC) (Figure 1). The stock was assessed as
 being below the LRP in 2010, resulting in a published rebuilding plan. It is also listed under the Species
 at Risk Act (SARA) as a Species of Special Concern. The current MP for rebuilding is a fixed annual
 total allowable catch (TAC) of 15 metric tonnes, which has not been re-evaluated since the last
 assessment. Fisheries and Oceans Canada (DFO) Fisheries Management Branch has requested that
 Science Branch develop advice to inform a rebuilding plan consistent with the DFO (2013) guidance
 document. This project applies the Management Procedure Framework (peer reviewed June 8-9,
 2020), which emphasizes selecting MPs that have a high likelihood of meeting objectives across
 multiple plausible states of nature, to evaluate rebuilding of the Inside Yelloweye Rockfish stock.
 This Science Advisory Report is from the June 10-11, 2020 regional peer review on the Evaluation of
 Management Procedures for the Inside Population of Yelloweye Rockfish Rebuilding Plan. Additional
 publications from this meeting will be posted on the Fisheries and Oceans Canada (DFO) Science
 Advisory Schedule as they become available.

December 2020
Evaluation of Management Procedures for
 Pacific Region Rebuilding Plan - Inside Yelloweye

 SUMMARY
• The inside stock of Yelloweye Rockfish (Sebastes ruberrimus, Inside Yelloweye Rockfish) is
 a data-limited stock, occurring in Groundfish Management Area 4B (Queen Charlotte Strait,
 Strait of Georgia, and Strait of Juan de Fuca) in British Columbia (BC).
• The stock was assessed as being below the Limit Reference Point (LRP) in 2010, resulting
 in a published rebuilding plan.
• This assessment provides scientific advice through application of a new management
 strategy evaluation framework recently developed for BC groundfishes (the Management
 Procedure [MP] Framework) (Anderson et al. 2021). The MP Framework evaluates the
 performance of alternative data-limited MPs to support re-evaluation of the current
 rebuilding plan for Inside Yelloweye Rockfish.
• The MP Framework was used to evaluate the ability of 34 data-limited MPs to meet the
 proposed principal objective of rebuilding the stock above the LRP (0.4 BMSY) over 1.5
 generations (56 yrs) with at least a 95% (19 times out of 20) probability of success.
• Performance of MPs was also evaluated for two additional conservation metrics based on
 LRP=0.4BMSY and Upper Stock Reference (USR)=0.8BMSY, three average-catch objectives,
 and one catch-variability objective.
• Natural mortality, selectivity, and historical catch were identified as major sources of
 uncertainty. Uncertainty in these parameters was accounted for by evaluating performance
 of the MPs across six alternative Operating Models (OM) scenarios based on different
 model and data assumptions. Four OMs, representing the most important and plausible
 uncertainties, were allocated to a “reference set”; two OMs, representing a broader range of
 uncertainties, were allocated to a “robustness set”.
• None of the reference set OMs estimated the median stock biomass to be below the LRP in
 2019. Differences in estimates of Inside Yelloweye Rockfish stock status between the
 current OMs and previous assessment were attributable to model structure choices.
• Closed-loop simulation screened out MPs that did not meet basic performance criteria,
 resulting in five remaining candidate MPs: two annual constant-catch MPs (10 and 15
 tonnes), and three MPs that adjust the total allowable catch (TAC) based on a survey index
 of abundance. All five final MPs met the principle performance metric with greater than 0.98
 probability (49 times out of 50), across all four OM reference set scenarios.
• The constant catch policy MPs resulted in a greater short-term fishery yield and higher catch
 stability than the index-based MPs. Index-based MPs resulted in greater long-term yield.
• MP performance was most challenged under the lower productivity robustness scenario
 (Low M), where none of the five MPs were able to achieve the principle performance metric.
 The highest-ranking MP for this scenario (a constant catch of 10 tonnes) resulted in a 90%
 probability of rebuilding the stock to above the LRP over 1.5 generations.
• Based on performance relative to the objectives, the rank order of the five candidate MPs
 was consistent among reference set scenarios with the highest ranking MP consistently
 being the constant annual catch of 10 t. This was also the highest ranking MP for both
 robustness set scenarios.
• Major uncertainties associated with assessing stock status for Inside Yelloweye Rockfish
 highlight the importance of using an MP framework for decision-making.

 2
Evaluation of Management Procedures for
 Pacific Region Rebuilding Plan - Inside Yelloweye

• For the five final candidate MPs, the catch advice from the index-based MPs should be
 updated annually. Prospective performance of all MPs should be re-evaluated at least every
 three years.
• Establishing formal “exceptional circumstance” detection protocols to trigger earlier
 reevaluation of performance of the chosen MP is recommended.
• The flexibility of the MP Framework to inform different information needs was demonstrated
 using results structured to allow evaluation of two additional assessment criteria for the
 Committee on the Status of Endangered Wildlife in Canada (COSEWIC).
• This was the first implementation of the MP Framework for decision making. Future
 collaborative work is recommended to identify further management objectives for Inside
 Yelloweye Rockfish.

 INTRODUCTION
The purpose of this peer review is to provide scientific advice to support revision of the
rebuilding plan for the inside stock of Yelloweye Rockfish (Sebastes ruberrimus) (DFO 2018),
consistent with national policy guidance (DFO 2009, 2013). The project applies a closed-loop
simulation framework (Anderson et al. 2021) to evaluate the performance of alternative
management procedures (MPs) with respect to meeting rebuilding objectives for the inside
stock of Yelloweye Rockfish (hereafter Inside Yelloweye Rockfish). This project provides
scientific advice through application of a new management strategy evaluation (MSE)
framework recently developed for BC groundfishes, called the Management Procedure (MP)
Framework, (Anderson et al. 2021).
The MP Framework differs from conventional stock assessments in the way science advice is
delivered. In most BC groundfish stock assessments, catch advice is presented in the form of
decision tables, where probabilities of breaching reference points (e.g., probability of the stock
falling below the Limit reference Point [LRP]) are presented over a range of possible future total
allowable catch (TAC) levels. This approach places consideration of risk at the final step of the
decision-making process and may not always be transparent or related to pre-agreed
objectives. MP frameworks differ from conventional assessments in two key ways: (1) reference
points and stock status are not necessarily explicitly reported; and (2) objectives related to the
probability of breaching reference points must be agreed upon at the beginning of the process.
Reference points and stock status are therefore still an integral component of the framework,
but they are calculated in the Operating Models (OMs) and are built into the performance
metrics. Critically, agreement on acceptable risk (e.g., acceptable probabilities of breaching
reference points) must be reached at the beginning of the process so that performance metrics
and satisficing (screening) criteria can be established. Frameworks such as these are
particularly important for data-limited stocks.
Yelloweye Rockfish are a long-lived species (up to 121 years in B.C., Keppel and Olsen 2019),
occurring in rocky benthic habitats that have a patchy, discontinuous distribution along BC’s
inner coast (Yamanaka et al. 2011). These life history traits make the species vulnerable to
overexploitation by fisheries. The inside stock is considered to be data-limited, as there is
sparse availability of age-composition data; a lack of biological data from commercial,
recreational, and First Nations’ fisheries; and uncertainty in the magnitude of historical catches.
Inside Yelloweye Rockfish occur in Groundfish Management Area 4B in British Columbia (BC)
(Figure 1). Note that Management Area 4B is larger than the extent of the genetic population
and designatable unit used by COSEWIC (Figure 1). The stock is expected to be designated as

 3

Evaluation of Management Procedures for
 Pacific Region Rebuilding Plan - Inside Yelloweye

a major fish stock in the fall of 2020, at which time its management will be legislated under the
Fish Stocks provisions of the Fisheries Act. The stock was assessed as being below the LRP in
2010 (Yamanaka et al. 2011; DFO 2012). In response, a rebuilding plan was developed and
published in Appendix 9 of the Pacific Region Integrated Fishery Management Plan (IFMP) for
Groundfish (DFO 2018). Inside Yelloweye are also listed under the Species at Risk Act (SARA)
as a Species of Special Concern (COSEWIC 2008), and anticipated to be reassessed by the
Committee on the Status of Endangered Wildlife in Canada (COSEWIC) in 2020. Results from
this project may inform the COSEWIC reassessment and a revised SARA management plan,
should one be required.
The current rebuilding plan objective is to “rebuild the stock above the LRP over 80 years with
56% probability of success.” The milestone objective is to “achieve positive trends within each
10-year period.” The current MP for Inside Yelloweye Rockfish aims to keep the total annual
catch (commercial, recreational, First Nations food, social and ceremonial [FSC], and survey)
below 15 tonnes (see Appendix 9 of DFO [2018] for details). The guidance for rebuilding plans
in Canada states that there should be a high probability of rebuilding fish stocks out of the
critical zone within the stated time-frame (DFO 2013). Part of the motivation for this project was
concern, expressed by fisheries managers, that the 56% probability of success stated in the
current rebuilding plan (DFO 2018) is inconsistent with the definition of high probability. The
current rebuilding plan implements an annual fixed TAC of 15 metric tonnes (DFO 2018), which
has not been simulation-tested.
The guidance document also identifies some recommended management measures, which
include: keeping removals from all sources to the lowest possible level; development of a
harvest control rule (HCR); and application of management strategy evaluation (MSE) to
evaluate, via simulation, the performance of alternative management measures with respect to
meeting rebuilding objectives for the stock (DFO 2013).

Objectives and Milestones
We present a set of refined conservation and catch objectives and associated performance
metrics for the rebuilding plan for Inside Yelloweye Rockfish. Key provisional conservation
objectives are guided by the PA Framework (DFO 2006, 2009), the rebuilding plan guidance
document (DFO 2013), and regional precedents (DFO 2020).
The proposed core conservation objective is:
1. Rebuild the stock above the LRP over 56 years (1.5 generations) with at least 95% [19
 times out of 20] probability of success.
We also propose the following additional objectives:
2. Rebuild the stock above the USR over 56 years (1.5 generations).
3. Rebuild the stock above the LRP over 38 years (1 generation).
4. Given the above conservation objectives are achieved, maintain an average target catch in
 the short and long term.
5. Given the above conservation objectives are achieved, minimize variability in fisheries catch
 from year to year.
In addition to the above objectives, we propose refining the milestones identified in the original
rebuilding plan (DFO 2018) with the italicized text as follows:

 4
Evaluation of Management Procedures for
 Pacific Region Rebuilding Plan - Inside Yelloweye

6. Achieve positive biomass trends within each 10 year period for as long as the stock remains
 below the LRP.

 ANALYSIS
Closed Loop Simulation
The Management Procedure (MP) Framework evaluates the performance of alternative data-
limited MPs to support re-evaluation of the current rebuilding plan for Inside Yelloweye Rockfish.
The MP Framework follows six best-practice steps for MSE: (1) defining the decision context;
(2) setting objectives and performance metrics; (3) specifying operating models (OMs) to
represent the underlying system and calculate performance metrics; (4) selecting candidate
MPs; (5) conducting closed-loop simulations to evaluate performance of the MPs; and (6)
presenting results to facilitate evaluation of trade-offs (Figure 2).

Figure 2. The steps of the MSE process following Punt et al. (2016) as implemented in DLMtool. Copied
from Anderson et al. (2020) and adapted from Carruthers and Hordyk (2018a).

After selection and implementation of the MP for setting the catch limit (e.g., applying the
selected MP algorithm to the observed survey index), a final necessary step (Step 7) is to
periodically monitor and evaluate the performance of the MP (DFO 2013; Dowling et al. 2015;
Carruthers and Hordyk 2018a). This may be done through informal means, e.g., via feedback
from fishers and survey information (e.g., Cox and Kronlund 2008), or through more formal

 5
Evaluation of Management Procedures for
 Pacific Region Rebuilding Plan - Inside Yelloweye

statistical measures, where observed data are compared to predictions from the OMs to test
whether the system is performing as expected (Butterworth 2008; Carruthers and Hordyk
2018b; discussed in Anderson et al. 2020).

Performance Metrics
Performance metrics allow us to quantitatively assess the ability of different MPs to meet the
specified conservation and fishery objectives. In the closed-loop simulations, all reference points
and performance metrics are calculated in the OM. Raw performance metrics are calculated in
each of the 100 years of the projection period and summarized according to the time-frame of
interest. GT represents generation time, ST and LT refer to short- and long-term respectively,
and AADC stands for average absolute deviation in catch over some period of time:
• LRP 1.5GT: P(B > 0.4 BMSY) after 1.5 GT (in 2075, year 56 of the projection period)
• USR 1.5GT: P(B > 0.8 BMSY) after 1.5 GT (in 2075, year 56 of the projection period)
• LRP 1GT: P(B > 0.4 BMSY) after 1 GT (in 2057, year 38 of the projection period)
• ST C10: P(average catch > 10 t) during 2020–2029, years 1–10 of the projection period
• ST C15: P(average catch > 15 t) during 2020–2029, years 1–10 of the projection period
• LT C20: P(average catch > 20 t) after 1 GT (in 2057, year 38 of the projection period)
• ST AADC: P(AADC2020–2029 < AADC2012–2019)
Performance statistics were calculated across replicates and years for the entire defined time
window. For example, short-term catch metrics were averaged over replicates and the years
2020-2029.

Operating Models
Two open-source software packages for MSE were used for this analysis: the Data Limited
Methods toolkit (DLMtool) (Carruthers and Hordyk 2018a, 2018b) and the Management
Strategy Evaluation toolkit (MSEtool) (Huynh et al. 2019). DLMtool OMs have four main
components representing the real fished system: population dynamics, fishery dynamics,
observation processes, and management implementation. To isolate the effects of specific
sources of uncertainty on performance of MPs, we developed alternative OMs that change the
value (or distribution) of one or more parameters and/or data sources of interest. OMs are
calibrated or conditioned with observed data, so they can reproduce historical observations. The
OMs are developed using stock reduction analysis (SRA) (Kimura and Tagart 1982; Walters et
al. 2006), which is effectively a statistical catch-at-age model that estimates the combinations of
historical fishing mortality and recruitment that would be consistent with the observed data. MSE
best practice recommends dividing MSE trials into a “reference set” of core OMs that include the
most important uncertainties (e.g., depletion of the stock or range of natural mortality values),
and a “robustness set,” to capture a wider range of uncertainties that may be less plausible but
should nonetheless be explored (Rademeyer et al. 2007).
For Inside Yelloweye Rockfish, we established four reference set OMs: (1) a baseline OM; (2)
an OM reflecting an alternative assumption about the magnitude of historical catch during the
period 1986-2005; (3) an OM allowing for episodic (rare but large) future recruitment events;
and (4) an OM estimating selectivity in the Inside Hard Bottom Longline Survey (HBLL) survey
(Table 1). We further established two robustness set OMs: (A) an OM that assumes lower

 6
Evaluation of Management Procedures for
 Pacific Region Rebuilding Plan - Inside Yelloweye

natural mortality than the other OMs; and (B) an OM that assumes a higher coefficient of
variation (CV) in the future HBLL survey (Table 1).

Table 1: Inside Yelloweye Rockfish OM scenarios.
 OM Scenario name Set type
 (1) Base Reference
 (2) Low catch Reference
 (3) Episodic recruitment Reference
 (4) Estimate HBLL selectivity Reference
 (A) Low M Robustness
 (B) High HBLL CV Robustness
For all OM scenarios, except scenario (A), the median spawning biomass in 2019 was
estimated to be above the LRP (Figure 3). OM Scenario (A) estimated median spawning
biomass to have been below the LRP for most years after 2000 and less than 50% probability of
being above the LRP in 2019. OM Scenario (2) and OM Scenario (4) also had a small
probability of being below the LRP in the current year. Therefore, according to all the reference
set OM scenarios and one robustness set OM scenario, the stock can already be considered to
have rebuilt above the LRP. The median spawning biomass is estimated to be above the USR
in OM Scenarios (1), (2), (3), and (B); and estimated to be below the USR in OM Scenarios (4)
and (A). OM fits to the surveys and three commercial CPUE series are shown in Figure A.1.

Figure 3. Probability that the 2019 spawning biomass is above the LRP and USR for the six operating
models. The colour shading reflects the underlying numbers and is included to make the differences in
the values more readily apparent, yellow (high probability) to purple (low probability).

Management Procedures
Anderson et al. (2021) evaluated all MPs that were available in DLMtool as of November 2019.
DLMtool includes a comprehensive set of data-limited MPs that make different types of
management recommendations, including adjustments to TAC, effort, or spatial allocation of
catch or effort. The MP Framework only considers MPs that make TAC recommendations,

 7
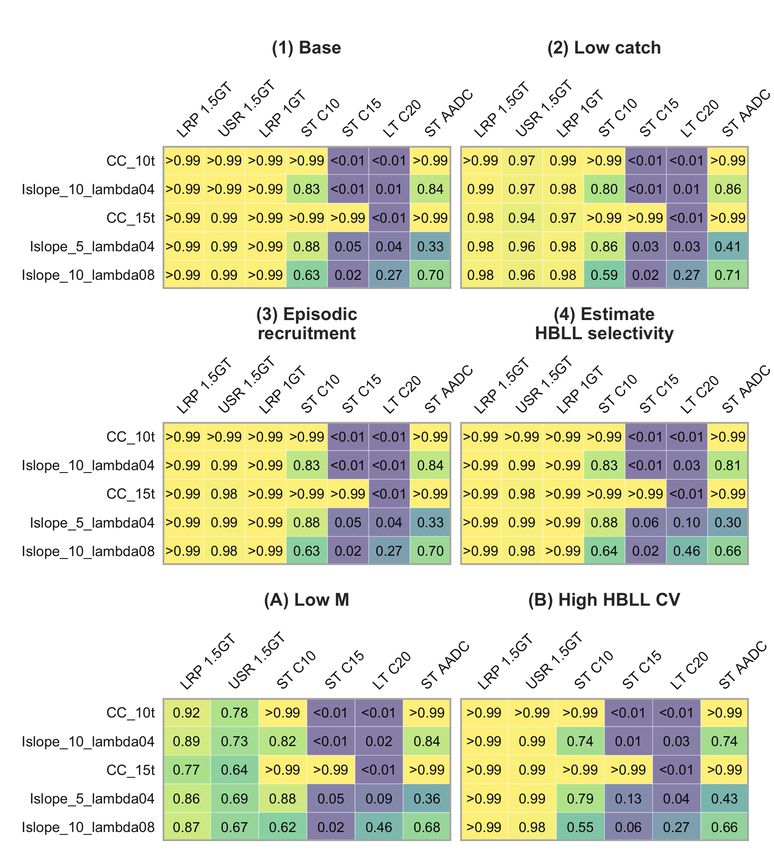
Evaluation of Management Procedures for
 Pacific Region Rebuilding Plan - Inside Yelloweye

because most groundfish stocks are managed by quotas and TACs. Thirty-four data-limited
MPs were evaluated to see if they would meet the Inside Yelloweye Rockfish objectives.
Two main types of MPs were evaluated: empirical (data-based) and model-based MPs. Three
reference MPs were also evaluated. The empirical MPs included constant catch and index-
based MPs. Constant-catch MPs set the recommended catch to a fixed level, of 5t, 10t, and 15t
(the current MP used for Inside Yelloweye Rockfish). Index-based MPs adjust the TAC based
on changes in a population index over time, increasing or decreasing the TAC in accordance
with some variable associated with an index (e.g., with the estimated slope in the index over a
recent period of time). The time intervals for updates used were annual or five-year. The model-
based MPs used a surplus production model, paired with two alternative harvest control rules
(HCRs): 80% BMSY and 40% BMSY as the USR and LRP, respectively; and 40% B0 and 10% B0
as the USR and LRP, respectively.
Closed-loop simulations were run for 250 stochastic replicates with a projection period of 100
years. Anderson et al. (2021) recommended filtering MPs with a “satisficing” step, where trial
simulations are run to screen out MPs that do not meet a basic set of performance criteria
(Miller and Shelton 2010; see Anderson et al. 2021). We set the initial satisficing criteria of LRP
1.5GT > 0.9 and assessed average and minimum performance across all candidate MPs for the
reference set of OMs. All MPs met the satisficing criterion, both in individual OM reference set
scenarios and averaged across all four reference OMs. Since many MPs also generated low
catches, we applied an additional satisficing filter, retaining only MPs where average ST C10 >
0.50 (where the probability of average catch greater than 10 t during 2020-2029 was greater
than 0.50). Applying the two criteria resulted in only five satisficed MPs. Two constant catch
MPs of 10 and 15 t (CC_10t and CC-15t) and three index-slope MPs (Islope_10_lambda04,
Islope_10_lambda08, and Islope_5_lambda04). These index-slope MPs vary in how the TAC
advice changes relative to the magnitude of the slope in the index. Performance with the
reference set of OMs differed across satisficed MPs and performance metrics (Figures 4 and 5).
The index-slope MPs achieved between 0.59 and 0.88 for ST C10. Within the reference set
there was virtually no trade-off between LRP 1.5GT and ST C10, since all MPs were able to
achieve LRP 1.5 GT > 0.99. There is also a trade-off between short-term and long-term
catches. Notably, ST C10 is lowest and LT C20 is highest for the Islope_10_lambda08 MP in all
OMs. All other MPs generate higher ST C10 but lower LT C20. All MPs achieved continuous
growth throughout the projection period, albeit at different rates.
OM Scenario (A), low natural mortality, reduced the probability of achieving the LRP 1.5GT
performance metric to a range of 0.75-0.90, compared to > 0.99 across the reference set
(Figure 4). OM Scenario (A) demonstrated a trade-off between ST C10 and LRP 2GT (Figure
6). Across MPs, catches would have to be lower in OM Scenario (A) than in the reference set
OMs to achieve similar conservation outcomes. By comparing the projections across OM
scenarios on the same figure, it is clear that F/FMSY, B/BMSY, and catch were most sensitive to
the OM Scenario (A) assumptions (Figure 7). Note that the rank order of MPs, which is likely
more important in a decision context, differed under OM Scenario (A) compared to the OM
reference set scenarios.

 8
Evaluation of Management Procedures for
 Pacific Region Rebuilding Plan - Inside Yelloweye

Figure 4. Performance of satisficed MPs for the OM reference (1-4) and robustness (A, B) set scenarios.
MPs are ordered by decreasing performance metric values from the averaged reference set. The colour
shading reflects the underlying numbers and is included to make the differences in the values more
readily apparent, yellow (high probability) to purple (low probability).

 9
Evaluation of Management Procedures for
 Pacific Region Rebuilding Plan - Inside Yelloweye

Figure 5. Dot-and-line plot of performance metrics across OM scenarios. Dots represent average
performance metric values and thin lines represent the range of values across OM scenarios. Thick lines
represent the range of values across OM scenarios after dropping the high and low values. Reference
MPs are indicated by open circles. Non-reference MPs are indicated by closed circles.

Figure 6. Trade-off plot between LRP 1.5GT and ST C10 performance metric values for satisficed MPs for
the reference set OM 1 (Base) and robustness set OM A (Low M). The trade-off plots for OMs not shown
are similar to OM 1. Reference MPs are indicated by open circles. Non-reference MPs are indicated by
closed circles.

 10
Evaluation of Management Procedures for
 Pacific Region Rebuilding Plan - Inside Yelloweye

Figure 7. B/BMSY, F/FMSY, and catch from the historical and projected time periods (B=Biomass, F=Fishing
Pressure, MSY=at Maximum Sustainable Yield). The LRP and USR are shown with dashed lines.

 11
Evaluation of Management Procedures for
 Pacific Region Rebuilding Plan - Inside Yelloweye

COSEWIC Considerations
COSEWIC and DFO have different criteria for assessing the status of marine fish stocks. DFO
focuses on current status relative to some reference state or threshold, while COSEWIC criteria
are focused on the decline over past generations and the probability of continued declines in the
future (COSEWIC 2015). COSEWIC applies a set of quantitative assessment criteria and
guidelines to develop and assign a status to the stock in question. To inform the reassessment
of Inside Yelloweye Rockfish, we report results for two of COSEWIC’s quantitative assessment
criteria that may be applicable to this stock, Metric A and Metric E.
COSEWIC Metric A
COSEWIC’s Metric A measures the probability that the stock has declined by 70%, 50%, or
30% after three generations, where one generation for Inside Yelloweye Rockfish is defined as
38 years. Note that three generations under this definition is 114 years but since our historical
period (1918-2019) is 102 years, we use this as an approximation of three generations. These
decline thresholds are used to assign status designations of endangered, threatened, and
species of special concern, respectively, although other factors, such as cause of decline, are
also considered (COSEWIC 2015). To inform the COSEWIC re-assessment of Inside Yelloweye
Rockfish, we report the following for each OM (Figure 8):
• P70 - Probability that, on average, the stock declined more than 70% of B1918 over three
 generations, where generation time is 38 years and probability is calculated as [1 −
 2019 / 1918 > 0.7].
• P50 - Probability that, on average, the stock declined more than 50% of B1918 over three
 generations.
• P30 - Probability that, on average, the stock declined more than 30% of B1918 over three
 generations.

Figure 8. Results for COSEWIC metric A, the probability that the stock on average declined more than
70%, 50%, and 30% of B1918 over the past three generations, for each OM scenario, where one
generation is defined as 38 years. The colour shading reflects the underlying numbers and is included to
make the differences in the values more readily apparent, purple (high probability) to yellow (low
probability).

 12
Evaluation of Management Procedures for
 Pacific Region Rebuilding Plan - Inside Yelloweye

 Extinction Risk - COSEWIC Metric E
COSEWIC Metric E measures the probability of future extinction of the stock. A stock is
designated as endangered if the probability of extinction is 20% within 20 years (or five
generations, whichever is longer) and threatened if there is a 10% probability of extinction within
10 years. Criteria E is seldom applied to marine fishes, due to heavy reliance on data and
assumptions about parameters required as inputs to population viability analyses (Ross Claytor,
COSEWIC, pers. com., January 29, 2020).
In order to evaluate the probability of future extinction under candidate MPs, stock-specific
extinction thresholds must be assigned. Two candidate extinction thresholds of 2%B0 and 5%B0
were examined. These arbitrary thresholds were informed by precedents in the literature (e.g.,
Forrest et al. 2015 used 5%B0) and historical depletion estimates for other species in the Strait
of Georgia, e.g., Lingcod in the Strait of Georgia have been estimated to be depleted to as low
as 2%B0 but are recovering (Logan et al. 2005). In the future, simulation-testing of alternative
thresholds could be used to identify stock-specific extinction thresholds.
Using a projection period of 100 years, the probability was calculated that, on average
throughout the whole 100-year projection period, the stock remains above 2% and 5% B0 under
the five satisficed MPs and the no fishing reference MP for each OM scenario individually. The
average probability that the stock remains above each threshold under these MPs across all
OM reference set scenarios was also calculated. The two additional performance metrics are:
• 2%B0 = [ > 0.02 0 ] on average during the whole projection period, where B0 is the initial
 biomass and By refers to the biomass in a given year.
• 5%B0 = [ > 0.05 0 ] on average during the whole projection period
The probability that the Inside Yelloweye Rockfish stock remains above 2% and 5% of B0,
averaged across reference set OMs, was greater than 0.99, and all OM-MP combinations had
at least 0.90 probability of remaining above these thresholds, indicating a low risk of extinction.

Sources of Uncertainty
The MP Framework is specifically designed to identify management procedures that are robust
in closed-loop simulations despite uncertainties associated with data, our understanding of the
species and its environment, as well as observation, estimation, and implementation error
(Anderson et al. 2021). Furthermore, the robustness set OMs explore formulations that
represent alternative hypotheses to those in the reference set (Rademeyer et al. 2007; Punt et
al. 2016). Candidate MPs should perform well across both OM reference and robustness
scenarios. Despite this, major sources of uncertainty associated with Inside Yelloweye Rockfish
have been identified.
Two OM robustness set scenarios performed differently from the OM reference set scenarios,
especially OM Scenario (A). This low mortality/low productivity scenario ( ∼
Lognormal(0.025,0.2)), based on a lower estimate of M used for Yelloweye Rockfish in Alaska
(Wood 2019), was the only one where the median biomass was estimated to be in the critical
zone at the start of the projection period. For all other OM scenarios, we sampled from a
probability distribution for M with mean 0.045 y-1, which matched that used in the previous stock
assessment (Yamanaka et al. 2011).The rate of natural mortality of fish populations is one of
the most important, yet most difficult, parameters to estimate.
A major source of uncertainty in our analyses is the magnitude of historical catch. We followed
the same approach to reconstructing historical recreational catch data and estimating current

 13
Evaluation of Management Procedures for
 Pacific Region Rebuilding Plan - Inside Yelloweye

recreational catch data as Yamanaka et al. (2011). We evaluated the effect of doubling the
nominal commercial catch for the period 1986–2005 in OM Scenario (2) but performance of the
MPs was not appreciably different from other OM reference set scenarios. FSC catches were
not explicitly included in this model except for reported FSC catch landed on “Dual Fishing”
trips, which were included in the commercial catch. FSC catch from small boats are partially
included in the recreational effort estimates from the creel overflights because an FSC fisher
cannot be distinguished from a recreational fisher in that case. Future applications of the MP
Framework for this stock would benefit from more detailed collaborative work with First Nations
to quantify contemporary and historical FSC catch in Area 4B.
Selectivity was another major source of uncertainty in our OMs. There are no available age-
composition data for commercial or recreational fisheries, and none from the Dogfish survey, so
the selectivity for all these gears was fixed. Selectivity for the commercial and recreational
fisheries were set to match those reported for the outside Yelloweye Rockfish stock (Cox et al.
2020). However, it was noted during the Outside Yelloweye Rebuilding process that additional
biological sampling is needed to better estimate the selectivity of commercial, recreational, and
FSC fisheries (DFO 2020). This recommendation is also made for the inside population.
Selectivity for the Dogfish survey was set to mirror the value used for the HBLL survey, despite
differences in gear and design between the two surveys. DFO has begun to collect rockfish
biological data on the Dogfish survey and to compare it to the HBLL survey in order to reduce
this uncertainty in future analyses for Inside Yelloweye.
The 2010 assessment used a surplus production (SP) model, with fundamentally different
structural assumptions to the SRA used for conditioning OMs in our analysis. As a check, an SP
model was fit, similar to that used by Yamanaka et al. (2011) and obtained much lower biomass
and stock status estimates than from the reference set SRA OMs. Furthermore, the estimate of
BMSY was higher for the SP model than for OM Scenario (1), while the FMSY estimate from the
SP model was lower than those from the reference set SRA models, indicating lower
productivity in the SP model. The fact that the SP model had lower estimated productivity and
biomass, and higher BMSY lead to a more pessimistic assessment of stock status. The SP-fitting
exercise suggests that model structure, rather than the addition of ten years of new data since
the last assessment, was a major factor contributing to different perceptions of stock status
between the current OMs and the previous assessment. During the regional peer review
process, it was noted that the SP model is expected to be a poor choice of model for a long-
lived stock that has long lags between recruitment and fishable biomass. In the previous
assessment, an SP model was deemed necessary, given the lack of composition data and
uncertainty over selectivity. Although selectivity is still very uncertain, some composition data
are now available and were incorporated into this analysis.
In a recent evaluation of the outside stock of Yelloweye Rockfish, Cox et al. (2020) found similar
differences between their age-structured OMs, which estimated stock status to be above the
LRP, and the 2014 SP model-based assessment (Yamanaka et al. 2018), which found the stock
to be below the LRP, triggering a rebuilding plan. Cox et al. (2020) noted that structural
differences between SP and age-structured models would be expected to produce different
results, particularly due to differences in the formulation of productivity. OM Scenario (A), the
scenario with lower productivity, mimicked the stock status estimates of Yamanaka et al. (2011),
albeit with a lower mean value of M than was used in Yamanaka et al.’s (2011) SP model. Cox
et al. (2020) noted that age-structured models allow for lags in recruitment to fisheries, surveys,
and the spawning stock, characteristics that can promote resilience and are more realistic for a
long-lived species like Yelloweye Rockfish. These differences are controlled by fishery
selectivity-at-age, survey selectivity-at-age, and maturity-at-age, respectively, in age-structured

 14
Evaluation of Management Procedures for
 Pacific Region Rebuilding Plan - Inside Yelloweye

models and can be over-simplified in aggregate SP models. Cox et al. (2020) also noted that
their SP-based MPs tended to underestimate biomass, which we also found in the current study
(i.e., the SP MPs generated no catch in the first decade of the projections).
During the peer review meeting, additional analysis was requested of the authors to elucidate
what was driving the positive stock trajectory in most of the OMs. The authors tried up-
weighting, down-weighting, and excluding the 2019 data from the Dogfish survey but the
biomass still trended upwards. The conclusion drawn was that the positive biomass trajectory
was a result of increased recruitment and decreased catches over the last two decades, and the
fact that fish select to the fishery after they are mature, so some spawning can take place before
they are caught. OM Scenario (4), where survey selectivity-at-age was estimated, resulted in
lower estimates of stock status, implying that assumptions about selectivity were a contributing
factor to perceptions of stock status. This most likely results from impacts on other parameter
estimates, such as R0, and autocorrelation in recruitment.
Despite differences in perception of stock status among some of our OMs, and between this
and the previous stock assessment, the MP Framework provides a method for integrating
across the major uncertainties in stock status and reference points that are prevalent for this
stock. In particular, the inclusion of OM Scenario (A) in the robustness set provides decision-
makers with an alternative view of stock status and performance of MPs.

 CONCLUSIONS AND ADVICE
We applied a new MP Framework for Pacific groundfishes (Anderson et al. 2021) to evaluate
the ability of alternative MPs to meet rebuilding objectives for Inside Yelloweye Rockfish. This is
the first application of the MP Framework for decision-making purposes.
For many stocks, especially data-limited stocks like Inside Yelloweye Rockfish, it is not possible
to reliably estimate biological reference points or estimate stock status. MP frameworks differ
from traditional stock assessments in that reference points and stock status are not necessarily
explicitly reported and objectives related to the probability of breaching reference points must be
agreed upon at the beginning of the process. Reference points and stock status are still an
integral component of the framework, but they are calculated in the OMs and are built into the
performance metrics. Evaluation of the OMs used suggests that the differences in estimates of
Inside Yelloweye Rockfish stock status between the current and previous assessments may be
attributable to model structure choices. However, despite uncertainties in the stock status, MPs
that were able to achieve the objectives were still identified.
We evaluated the performance of 31 data-limited MPs (and three reference MPs) with respect
to meeting the rebuilding objectives. We screened out MPs that did not did not meet both the
LRP 1.5GT > 0.9 and ST C10 > 0.50 criteria across the OM reference set scenarios, resulting in
five remaining MPs. Satisficed MPs in the current analyses included constant catch MPs and
annual Islope MPs. These MPs achieved the conservation metrics LRP 1.5 GT, USR 1.5GT and
LRP 1GT with greater than 0.98 probability (49 times out of 50) across all four OM reference set
scenarios. This was largely because none of the reference set OMs estimated the stock to be in
the critical zone in 2020—the start of the projection period. All the index-based MPs were also
evaluated at five-year intervals. While all of these MPs met the LRP 1.5GT criteria, none of
them met the ST C10 criteria. Therefore, if an index-based MP is selected, we recommend
annual updates.
Within the two OM robustness set scenarios, OM Scenario (B), which simulated higher
variability in the future HBLL survey, performed similarly to the OM reference set scenarios.
However, under OM Scenario (A), the Low M scenario, the probabilities of meeting the

 15
Evaluation of Management Procedures for
 Pacific Region Rebuilding Plan - Inside Yelloweye

performance metric LRP 1.5GT ranged from 0.75 (75 times out of 100) to 0.9 (nine times out of
10), with the current MP (CC_15t) having the lowest probability in this range.
Whereas the rebuilding plan guidance (DFO 2013) only describes objectives related to
rebuilding, we also evaluated performance of MPs with respect to three average-catch
objectives and one catch-variability objective. The CC_10t and CC_15t MPs, by definition, met
their respective ST C10 and ST C15 performance metrics. The Islope MPs showed some
contrast across MPs within the reference set for ST C10 and ST C15, depending on the MP
configuration and the OM scenario. The OM robustness set scenarios generally produced lower
probabilities of meeting the ST C10 metric.
Generally, there were no significant trade-offs apparent between conservation and catch
objectives for the different Management Procedures applied to the reference set OMs. However,
there was a trade-off between short-term and long-term catch in all OMs; one MP
(Islope_10_lambda08) notably generated lower short-term catch for larger long-term catch. In
the Low M scenario of the robustness set, none of the MPs could achieve the core conservation
objective. In this scenario the closest result was achieved by a 10 tonne constant catch MP but
with an unacceptably low likelihood of 90% probability. Evidence for exceptional circumstances,
occurring within the recommended assessment interval, would trigger a review of the OM(s) and
MP, possibly resulting in a new OM, or an adjustment to the selected MP (Carruthers and
Hordyk 2018b). In line with guidance for rebuilding plans in Canada (DFO 2013), we
recommend re-evaluation of the performance of the selected MP at least every three years.

 OTHER CONSIDERATIONS
Ecosystem considerations and climate change were not explicitly included in this analysis;
however, differences in productivity amongst areas may be driven by ecosystem and or
environmental effects. The impact or benefit of Rockfish Conservation Areas (RCAs) on stock
growth could also not be evaluated or included in this work as a result of a lack of monitoring
data available within RCAs; however, recent data have been collected and will be incorporated
in future projects. It is expected that as RCAs mature and size-age structures stabilize within
RCAs, that they will begin to have a positive effect on Inside Yelloweye Rockfish biomass.
Although the scope of this project was to see if we could meet the objectives related to biomass,
future work could include analyses about spatial, age-structured distributions and other aspects
of a healthy rebuilt stock. Future management and rebuilding objectives could be strengthened
by explicitly addressing the restoration of large size and old age structures. Moving towards a
management strategy evaluation offers a way to consider or operationalize an Ecosystem
Approach to Fisheries Management by incorporating ecosystem considerations, climate
uncertainty, and other conservation measures into MP selection.

 16
Evaluation of Management Procedures for
Pacific Region Rebuilding Plan - Inside Yelloweye

 LIST OF MEETING PARTICIPANTS
Last Name First Name Affiliation
Ahern Pat Sport Fishing Advisory Board
Anderson Sean DFO Science, Groundfish
Ashcroft Chuck Sport Fishing Advisory Board
Bates George Sport Fishing Advisory Board
Benson Ashleen Landmark Fisheries
Bocking Bob Tla'amin First Nation
Bresch Midoli DFO Science, Groundfish
Campbell Jill DFO Science, Groundfish
Carruthers Tom University of British Columbia
Christensen Lisa DFO Science, Centre for Science Advice Pacific
Claytor Ross COSEWIC
Cope Jason National Oceanic & Atmospheric Administration
Edwards Andrew DFO Science, Quantitative Assessment
English Philina DFO Science, Groundfish
Forrest Robyn DFO Science, Quantitative Assessment
Freshwater Cameron DFO Science, Quantitative Assessment
Frid Alejandro Central Coast Indigenous Resource Alliance
Gardner Lindsay DFO Fisheries Management, SARA
George Layla Tla'amin First Nation
George Larry Cowichan Tribes
Grandin Chris DFO Science, Groundfish
Grant Paul DFO, Science, SARA
Guo Chuanbo DFO, Post-Doctoral
Haggarty Dana DFO Science, Groundfish
Haigh Rowan DFO Science, Groundfish
Holt Kendra DFO Science, Quantitative Assessment
Holt Carrie DFO Science, Quantitative Assessment
Huynh Quang University of British Columbia
Kanno Roger DFO Fisheries Management, Sustainable Fisheries Framework
Keizer Adam DFO Fisheries Management, Groundfish
Kronlund Rob DFO Science, National Headquarters
Ladell Neil DFO Fisheries Management, Sustainable Fisheries Framework
Laliberte Bernette Cowichan Tribes
Lowry Dayv Washington Department of Fish and Wildlife
Magnan Al DFO Science, Centre for Science Advice Pacific
Marentette Julie DFO Science, National Headquarters
Mason Gwyn DFO Fisheries Management, Groundfish

 17
Evaluation of Management Procedures for
 Pacific Region Rebuilding Plan - Inside Yelloweye

 Last Name First Name Affiliation
 McIver Reba Oceana Canada
 Olmstead Melissa DFO Science, NHQ advisor
 Rusel Christa A'Tlegay Fisheries Society
 Schut Steve DFO Science, Spatial Data Unit
 Sporer Chris Pacific Halibut Management Association (PHMA)
 Surry Maria DFO Science, Groundfish
 Weckworth Erin Quatsino First Nations Fisheries Coordinator
 Workman Greg DFO Science, Groundfish

 SOURCES OF INFORMATION
This Science Advisory Report is from the June 10-11, 2020 regional peer review on the
Evaluation of Management Procedures for the Inside Population of Yelloweye Rockfish
Rebuilding Plan. Additional publications from this meeting will be posted on the Fisheries and
Oceans Canada (DFO) Science Advisory Schedule as they become available.
Publications from the Canadian Science Advisory Secretariat (CSAS) regional peer review
(RPR) held on June 8-9, 2020, titled ‘A Management Procedure Framework for British Columbia
Groundfish’, should be viewed as companion documents.
Anderson, S.C., English, P.A., and Ward, E.J. 2020. sdmTMB: Spatiotemporal species
 distribution GLMMss with TMB. R package version 0.0.3.9000.
Anderson, S., Forrest, R., Huynh, Q., and Keppel, E. 2021. A management procedure
 framework for groundfish in British Columbia. DFO Can. Sci. Advis. Sec. Res. Doc. In press.
Butterworth, D.S. 2008. Some lessons from implementing management procedures. Edited by
 K. Tsukamoto, T. Kawamura, T. Takeuchi, T.D. Beard, Jr., and M.J. Kaiser. In Fisheries for
 Global Welfare and Environment, 5th World Fisheries Congress 2008. TERRAPUB, Toyko.
 pp. 381–397.
Carruthers, T., and Hordyk, A. 2018a. The data-limited methods toolkit (DLMtool): An R
 package for informing management of data-limited populations. Methods Ecol. Evol. 9:
 2388–2395.
Carruthers, T., and Hordyk, A. 2018b. Using management strategy evaluation to establish
 indicators of changing fisheries. Can. J. Fish. Aquat. Sci.: 1–16.
COSEWIC. 2008. COSEWIC assessment and status report on the Yelloweye Rockfish
 (Sebastes ruberrimus), Pacific Ocean inside waters population and Pacific Ocean outside
 waters population, in Canada. Committee on the Status of Endangered Wildlife in Canada.
 Ottawa. vii + 75 pp.
COSEWIC. 2015. COSEWIC assessment process, categories and guidelines. Committee on
 the Status of Endangered Wildlife in Canada.
Cox, S.P., and Kronlund, A.R. 2008. Practical stakeholder-driven harvest policies for groundfish
 fisheries in British Columbia, Canada. Fish. Res. 94(3): 224–237.
Cox, S.P., Doherty, B., Benson, A.J., Johnson, S.D.N., and Haggarty, D.R. 2020. Evaluation of
 potential rebuilding strategies for Outside Yelloweye Rockfish in British Columbia. DFO Can.
 Sci. Advis. Sec. Res. Doc. 2020/069. viii + 135 p.

 18
Evaluation of Management Procedures for
 Pacific Region Rebuilding Plan - Inside Yelloweye

DFO. 2006. A harvest strategy compliant with the Precautionary Approach. DFO Can. Sci.
 Advis. Sec. Sci. Advis. Rep. 2006/023.
DFO. 2009. A fishery decision-making framework incorporating the Precautionary Approach.
DFO. 2012. Survey of recreational fishing in Canada 2010. DFO Res. Manage. Eco. Fish.
 Manage. 2012-1804.
DFO. 2013. Guidance for the development of rebuilding plans under the Precautionary
 Approach framework : Growing stocks out of the critical zone.
DFO. 2018. Pacific Region integrated fisheries management plan, groundfish, effective
 February 21, 2018.
DFO. 2020. Evaluation of potential rebuilding strategies for outside yelloweye rockfish in British
 Columbia. DFO Can. Sci. Advis. Sec. Advis. Rep. 2020/024.
Dowling, N., Dichmont, C., Haddon, M., Smith, D., Smith, A., and Sainsbury, K. 2015.
 Guidelines for developing formal harvest strategies for data-poor species and fisheries. Fish.
 Res. 171: 130–140.
Forrest, R.E., Savina, M., Fulton, E.A., and Pitcher, T.J. 2015. Do marine ecosystem models
 give consistent policy evaluations? A comparison of Atlantis and Ecosim. Fish. Res. 167:
 293–312.
Huynh, Q.C., Hordyk, A.R., and Carruthers, T. 2019. MSEtool: Management strategy evaluation
 toolkit. r package version 1.4.3.
Keppel, E., and Olsen, N. 2019. Pre-COSEWIC review of Yelloweye Rockfish (Sebastes
 ruberrimus) along the Pacific coast of Canada: Biology, distribution and abundance trends.
 DFO Can. Sci. Advis. Sec. Res. Doc 2019/014. ix + 109 p.
Kimura, D.K., and Tagart, J.V. 1982. Stock Reduction Analysis, another solution to the catch
 equations. Can. J. Fish. Aquat. Sci. 39(11): 1467–1472.
Logan, G., Mare, W. de la, King, J., and Haggarty, D. 2005. Management framework for Strait of
 Georgia Lingcod. DFO Can. Sci. Advis. Sec. Res. Doc. 2005/048. xiii + 102.
Miller, D.C.M., and Shelton, P.A. 2010. “Satisficing” and trade-offs: Evaluating rebuilding
 strategies for Greenland halibut off the east coast of Canada. ICES J. Mar. Sci. 67(9): 1896–
 1902.
Punt, A.E., Butterworth, D.S., de Moor, C.L., De Oliveira, J.A.A., and Haddon, M. 2016.
 Management strategy evaluation: Best practices. Fish Fish. 17(2): 303–334.
Rademeyer, R.A., Plagányi, É.E., and Butterworth, D.S. 2007. Tips and tricks in designing
 management procedures. ICES J. Mar. Sci. 64(4): 618–625.
Walters, C.J., Martell, S.J., and Korman, J. 2006. A stochastic approach to stock reduction
 analysis. Can. J. Fish. Aquat. Sci. 63(1): 212–223.
Wood, K., Olson, A., Williams, B., and Jaenicke, M. 2019. 14: Assessment of the demersal shelf
 rockfish stock complex in the southeast outside subdistrict of the gulf of Alaska. NPFMC.
Yamanaka, K., McAllister, M., Olesiuk, P., Etienne, M.-P., Obradovich, S., and Haigh, R. 2011.
 Stock assessment for the inside population of Yelloweye Rockfish (Sebastes ruberrimus) for
 British Columbia, Canada for 2010. DFO Can. Sci. Advis. Sec. Res. Doc. 2011/129. xiv +
 131 p.

 19
Evaluation of Management Procedures for
 Pacific Region Rebuilding Plan - Inside Yelloweye

Yamanaka, K.L., McAllister, M.M., Etienne, M.-P., Edwards, A.M., and Rowan Haigh. 2018.
 Stock assessment for the outside population of Yelloweye Rockfish (Sebastes ruberrimus)
 for British Columbia, Canada in 2014. DFO Can. Sci. Advis. Sec. Res. Doc. 2018/001. ix +
 150 p.

 20
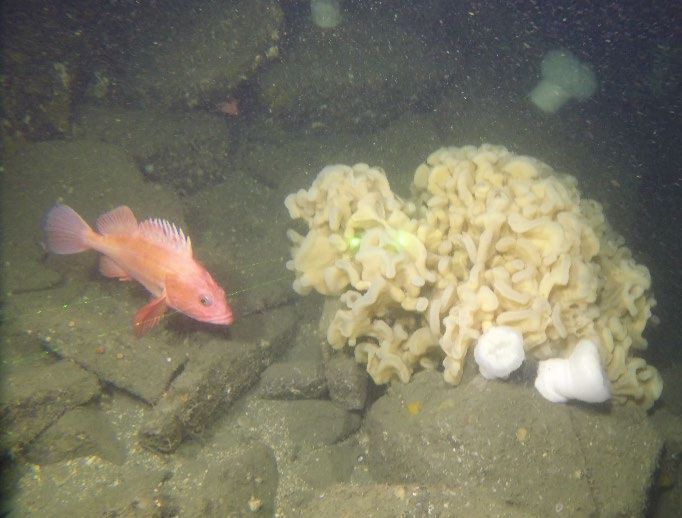
Evaluation of Management Procedures for
 Pacific Region Rebuilding Plan - Inside Yelloweye

 APPENDIX

Figure A.1. SRA model fits to the HBLL, Dogfish, and three commercial CPUE relative indices. Panels
from left to right represent OM scenarios. Thin lines represent individual SRA model fits across stochastic
draws from the various OM parameters. Dots represent index mean and line segments represent 2 times
the standard errors as entered into the SRA models.

 21
Evaluation of Management Procedures for
 Pacific Region Rebuilding Plan - Inside Yelloweye

 THIS REPORT IS AVAILABLE FROM THE :
 Centre for Science Advice (CSA)
 Pacific Region
 Fisheries and Oceans Canada
 3190 Hammond Bay Road
 Nanaimo, BC V9T 6N7
 Telephone: (250) 756-7208
 E-Mail: csap@dfo-mpo.gc.ca
 Internet address: www.dfo-mpo.gc.ca/csas-sccs/
 ISSN 1919-5087
 © Her Majesty the Queen in Right of Canada, 2020

Correct Citation for this Publication:
DFO. 2020. Evaluation of Management Procedures for the Inside Population of Yelloweye
 Rockfish Rebuilding Plan in British Columbia. DFO Can. Sci. Advis. Sec. Sci. Advis. Rep.
 2020/056.
Aussi disponible en français :
MPO. 2020. Évaluation des procédures de gestion pour le plan de rétablissement de la
 population de sébaste aux yeux jaunes des eaux intérieures en Colombie-Britannique. Secr.
 can. de consult. sci. du MPO, Avis sci. 2020/056.

 22
You can also read