Provincial Government Housing Rental Stock - PERFORMANCE AND EXPENDITURE REVIEW HUMAN SETTLEMENTS
←
→
Page content transcription
If your browser does not render page correctly, please read the page content below
PERFORMANCE AND EXPENDITURE REVIEW

Provincial Government Housing Rental Stock
HUMAN SETTLEMENTS

MAY 2018
Disclaimer
All care has been taken in the preparation of this document and the information contained herein has
been derived from sources believed to be accurate and reliable. Alcari Consulting does not assume
responsibility for any error, omission or opinion expressed, nor for any decisions based on this
information.

Project team
Gafee Vengadajellum
Odette Crofton
Santhurie Naidoo
Adrian Di Lollo
Ilse Martin
Saloshna Shunmugam
Serena Shunmugam
Larry Hobson
Tinashe Guramatunhu
Kate Shand

Contact details
Alcari Consulting
63 Himalaya Road, Braelyn, East London, 5209
Tel:    +27 72 800 2983
Fax:    086 583 4352
Email: gvenga@lantic.net
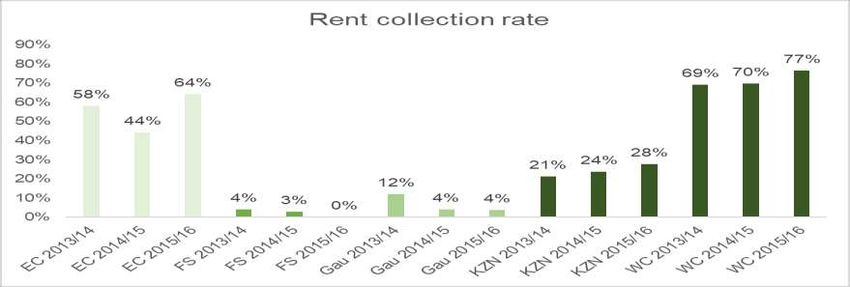
Table of Contents
1      Introduction .......................................................................................................................................... 1
2      Purpose of the study ............................................................................................................................. 1
3      Overview of rental market and government’s interventions ............................................................... 1
4      Background to the provincially owned and managed PPRHS ............................................................... 2
    4.1         Pre-1994 ........................................................................................................................................ 2
    4.2         Post-1994 ...................................................................................................................................... 3
    4.3         The remaining PPRHS units ........................................................................................................... 4
5         Profile of the PPRHS stock.................................................................................................................... 5
6      Current institutional framework........................................................................................................... 7
    6.1         Spheres of government................................................................................................................. 7
    6.2         Funding flows ................................................................................................................................ 8
    6.3         Public rental housing stock and the affordable rental housing programmes .............................. 9
7      Programme analysis .............................................................................................................................. 9
8     Expenditure analysis ............................................................................................................................ 13
    8.1         Programme funding sources and flows ...................................................................................... 13
    8.2         Revenue and expenses ............................................................................................................... 14
       8.2.1           Income ................................................................................................................................ 14
       8.2.2           Rent collection and rental debt .......................................................................................... 14
       8.2.3           Expenditure ......................................................................................................................... 16
       8.2.4           Net operating result ............................................................................................................ 17
       8.2.5           Performance comparison to other rental markets ............................................................. 18
    8.3         Key findings ................................................................................................................................. 18
9     Cost modelling ...................................................................................................................................... 19
    9.1         Scenarios ..................................................................................................................................... 19
    9.2         Projected fiscal implications ....................................................................................................... 20
    9.3         Evaluation of the scenarios ......................................................................................................... 21
10 Conclusions and recommendations .................................................................................................... 22
11 Appendices .......................................................................................................................................... 24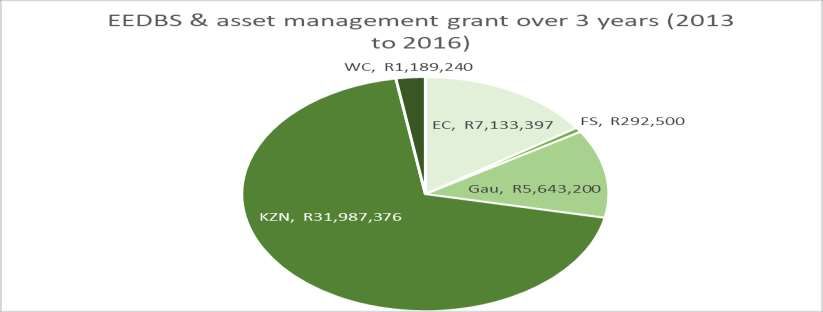
Acronym      Definition
 CBO          Community-based organisation
 CRU          Community Residential Units
 DBS          Discount Benefit Scheme
 EDBS         Extended Discount Benefit Scheme
 EEDBS        Enhanced Extended Discount Benefit Scheme
 GTAC         Government Technical Advisory Centre
 HSDG         Human Settlements Development Grant
 NDHS         National Department of Human Settlements
 NGO          Non-governmental organisation
 PDHS         Provincial Department of Human Settlements
 POP          Phase Out Programme
 PPRHS        Provincial public rental housing stock
 PT           Period totals
 RDP          Reconstruction and Development Programme
 RETRO        Regularisation and transfer of residential properties
 RSA          Republic of South Africa

List of figures
Figure 1a: History and policy overview (pre-1994)
Figure 1b: History and policy overview (post-1994)
Figure 2: Institutional framework
Figure 3: Funding framework
Figure 4: Chain of delivery
Figure 5: HSDG funding required per scenario to cover losses

List of tables
Table 1: Affordable rental housing programmes
Table 2: National property portfolio at 31 March 2016
Table 3: Universal elements
Table 4: Programme challenges
Table 5: Summary of income, expenditure and source of funds
Table 6: Performance comparison to other rental products, as at 2016
Table 7: Description of base case and scenarios
Table 8: Summary of financial implications of various scenarios
Table 9: Detailed results of cost to government, with comparison to other subsidy instruments
Table 10: Evaluation of scenarios
Table 11: Summary of conclusions and recommendations

List of maps
Map 1: Locality map of the national property portfolio

List of graphs
Graph 1: Sources of income
Graph 2: Rent raised vs rent collected
Graph 3: Rent collection rates
Graph 4: Debtors age analysis of the portfolio
Graph 5: Expenditure analysis
Graph 6: Average expenditure per unit per month
Graph 7: Operating loss
Graph 8: Provincial allocation of government grants, 2013 to 2016
1 Introduction
The Government Technical Advisory Centre (GTAC), an agency of the National Treasury, was established
to support public financial management through the provision of professional advisory services,
programme and project management, and transaction support. GTAC promotes public-sector capacity
building through partnerships with academic and research institutions, civil society and business
organisations. Since mid-2013, GTAC has conducted a number of performance and expenditure reviews
to address gaps and misalignment between planning, budgeting and monitoring of government
programmes and functions. These have helped the National Treasury and affected departments to better
understand the factors that raise the cost and constrain the delivery of various government functions and
services. These reviews have led to policies and programmes being refined, aligned and changed. This
performance and expenditure review focuses on provincial residential rental housing stock within the
provincial departments of human settlements.
2 Purpose of the study
The purpose of this study was to obtain relevant data and analyse the costs and revenues associated with
provincial government renting state-owned residential properties to private tenants in the period
2013/14 to 2015/16.
The key objectives of the project were to:
Identify and quantify all costs and revenues associated with the management of state-owned
residential rental properties by provincial governments.
Assess the quality and comprehensiveness of available data on leases and rentals.
Estimate the discrepancy between rentals charged and market-related rates that could be
obtained for similar properties.
Identify weaknesses in rent-collection systems and processes and make recommendations to
address them.
Make recommendations to improve the effectiveness and efficiency of property rental
processes.
At the outset, the study focused on all provincially owned and managed residential rental stock within the
provincial departments of human settlements and public works. After the policy and institutional analysis
and the logical framework had been completed, it became clear that while many of the programme
elements are the same, the focus and policy intention of the rental stock falling under the two national
departments was quite different. As such, the analysis and reporting had to be done separately. This
report sets out the findings of the performance and expenditure review of the public rental housing stock
owned by provincial departments of human settlements.
3 Overview of rental market and government’s interventions
The private sector dominates the South African rental housing market. It is the biggest supplier of rental
housing, outstripping social housing and public rental stock provision. If shacks in backyards and
settlements, rooms in houses and traditional dwellings are included, this dominance becomes more
pronounced. A recent Rental Housing Market desktop study (see Appendix 5) shows that there is an
undersupply of moderately priced rental accommodation for low- to middle-income households. Census
statistics indicate that the rental housing market had increased to 25% by 2011. Other research indicates
1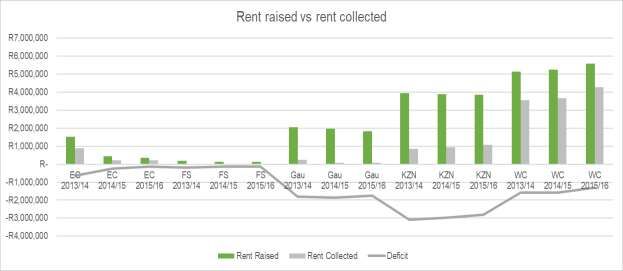
a steady shift from ownership to rental as the preferred housing tenure, especially in inner cities and inner
suburbs. Rental is set to become the main type of housing for the majority of residents within these areas.

To address the demand for well-located and -managed affordable rental housing for low- to middle-
income earners, government has developed and mainstreamed (as part of its subsidised housing
offerings) affordable rental housing programmes. These consist of the Community Residential Units (CRU)
and the Social Housing (SH) programmes. The table below summarises government’s current affordable
rental housing programmes.
Table 1: Affordable rental housing programmes

 Rental programme          Product                       Target market       Rentals            Grant
                                                         (monthly income)
 CRU                       Medium density, self-         R800 to R3 500      Economic cost      Full cost of
                           contained units, sized 25m²                       recovery rate      unit
                           to 45m²                                           ±R350 to R650
 SH                        Medium density, self-         R1 500 to R15 000   To cover costs +   R265 000
                           contained units, sized 30m²                       R750 to R4 450
                           to 50m²
 PPRHS                     Mix of freestanding and       R800 to R3 500      ±R259              Full cost of
                           blocks of flats                                                      unit

4        Background to the provincially owned and managed PPRHS
Provincial public rental housing stock (PPRHS), the subject of this study, is historical public rental stock
that was transferred to the provincial departments of human settlements and/or municipalities in order
to sell on to sitting beneficiaries. This was done under the Discount Benefit Scheme (DBS) and its
successive programmes, as described below. The Department of Human Settlements intends to regularise
remaining PPRHS stock within the CRU programme (i.e. stock that cannot be transferred for individual
ownership and will need to remain as public rental stock). Perhaps contradicting this intention, the PPRHS
has also been included in the department’s title deeds programme, where the priority is to ensure transfer
of title and ownership to beneficiaries of the Reconstruction and Development Programme (RDP).

4.1      Pre-1994
From 1950 to 1970, the purpose of the public rental housing programme was to fill the gap between
supply and demand for formal housing. The typical products of these programmes were tenement blocks
of minimal-sized flats or individual single-storey dwellings of a relatively high standard. As shown in Figure
1a, they formed part of the Department of Public Works, Housing and Local Government. The units were
later separated, with residential properties registered as “housing board stock” to human
settlement/housing departments and business and related properties registered as “RSA stock” to the
public works department. The pre-1994 processes are set out in Figure 1a.

Figure 1a: History and policy overview (pre-1994)

                                                                                                               2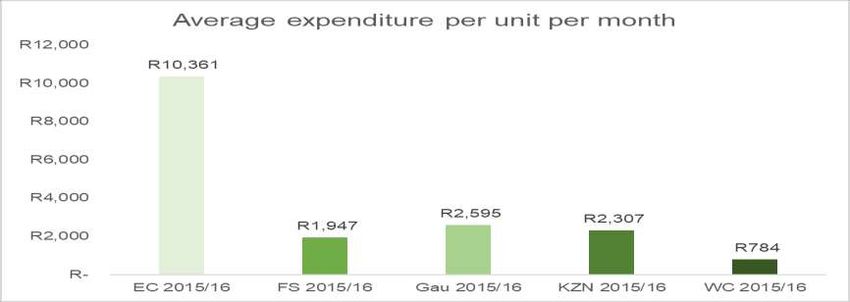
Background / Context to the Provincial rental stock
                                            PRE - 1994

                                Dept Public Works, Housing & Local Govt

      Stock managed ito             2nd directive                   1st & 3rd directive

                          Rental Housing       Employee hsg,
                              Stock                                       To Municipalities
                                               business, other
                                                                          99-year lease
                                              public properties

                        Human                                      Public
                      Settlements          POST - 1994             works
                        Housing                                   RSA Stock
                      Board Stock

4.2       Post-1994
The Housing Arrangements Act (1993) devolved responsibility for public rental housing stock to provinces.
These units should have been devolved further to municipalities in terms of the Housing Act (1997) as a
step towards disposing of them to their occupants, allowing them to become property owners.

The Housing Act provided for the Housing Code, which included all of the national housing programmes.
The PPRHS rental stock transfer to beneficiaries was enabled by the Discount Benefit Scheme (DBS) to
promote home ownership by beneficiaries. The DBS was also used in conjunction with a programme to
rectify pre-1994 housing stock assisting occupants to take
transfer of the housing stock in good condition. The stock The Human Settlement’s national housing subsidy
                                                                database shows some 113 000 PPRHS units
transfer process was primarily funded by the DBS and the transferred across the provinces since 1994 through
Extended Discount Benefit Scheme (EDBS) and budgeted in the     the DBS/EEDBS scheme. This captures stock
annual provincial housing business plans (approved by the transferred from provinces and municipalities to
                                                                beneficiaries.
national Department of Human Settlements (NDHS)). The DBS
and subsequent programmes such as the Phase Out
Programme (POP), the EDBS, and the Enhanced Extended Discount Benefit Scheme (EEDBS) addressed
issues that inhibited the transfer of stock to beneficiaries.

All the stock is captured and managed in a national “debtors’ system”. The system was created to track
funding provided for the stock that needs to be recovered via rentals or repayment of loans to dedicated
provincial housing funds. The system is managed nationally but data capture and information are provided
by the provinces. The system tracks funding, lease and property management, and any sales and transfers
that take place in terms of successive subsidy schemes, the most recent being the EEDBS subsidy.

                                                                                                          3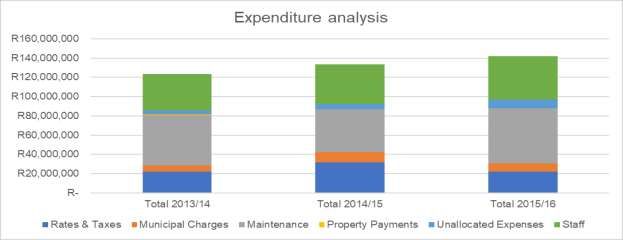
Since the enactment of the Housing Act, nearly 12 000 of the properties (approximately 80% of the original
number) have been devolved or transferred to their beneficiaries. Figure 1b summarises the post-1994
processes.
Figure 1b: History and policy overview (post-1994)

                                                   POST 1994

                                    Constitution of RSA – in relation to housing

                      Housing Act                                                               PFMA

                                           Discount Benefit Scheme
                                           Phase Out Programme
                                           Extended Discount Benefit Scheme
      Housing Code                         Enhanced Extended Discount Benefit
                                           Scheme
                                           Pre-1994 Rectification Programme
                                                                                                DORA

                                           Community residential unit
                                           programme
                                           Social Housing Programme

                                          Sectional Titles Scheme Management Act (as amended)

      Cross cutting                                   Rental Housing Act (as amended)
       legislation
                                     Prevention of Illegal Eviction from & Unlawful Occupation of Land
                                                                      Act
                                               Municipal Property Rates Act (as amended)

                                                    Provincial Finance Management Act

      Provincial                                                                            Provincial budget
                                           Gauteng: Retro & Tops
      legislation                                                                                 votes
                                           KZN: EEDBS

4.3       The remaining PPRHS units
The remaining PPRHS consists of 5 160 units, mostly comprising medium- to high-rise flats and about 900
single freestanding houses. The remaining stock was not devolved to the municipalities to manage and
complete the sales and transfers. This was mainly as a result of resistance from municipalities due to the
expected loss of income from rates and taxes currently received from provinces, lack of capacity to
administer the stock, and the reluctance to take on non-performing assets with complex beneficiary
problems, such as disputes of ownership and illegal occupation.

                                                                                                                4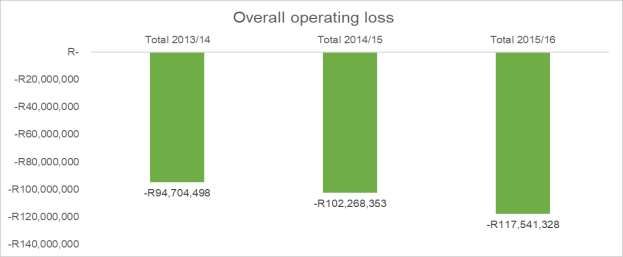
Initially, provinces were set annual targets in their budgets for the transfer of this remaining stock.
Provinces such as Gauteng and KwaZulu-Natal have introduced provincial programmes and legislation to
assist with devolving or transferring the remaining stock. This was relatively successful but has failed to
address the remaining units. In the last few years, these processes have not been a priority. Various
historical sociopolitical dynamics surround the projects and properties, complicating the process of
transferring the housing stock or managing the properties as normal rental stock.
It must be noted that more than 100 000 units of pre-1994 public rental housing stock are owned and
managed by municipalities. This stock does not form part of this study due to a lack of available data,
which is largely a result of the lack of a centralised accounting system. Some provincial departments of
human settlements and municipalities’ CRU rental housing stock (approximately 30 000 units as at 2015)
face similar challenges relating to lack of data.
5 Profile of the PPRHS stock
The total provincial human settlements portfolio is small, comprising only 5 160 units, as shown in Table
2. More than 80% of the original stock has been transferred to beneficiaries. The remaining properties are
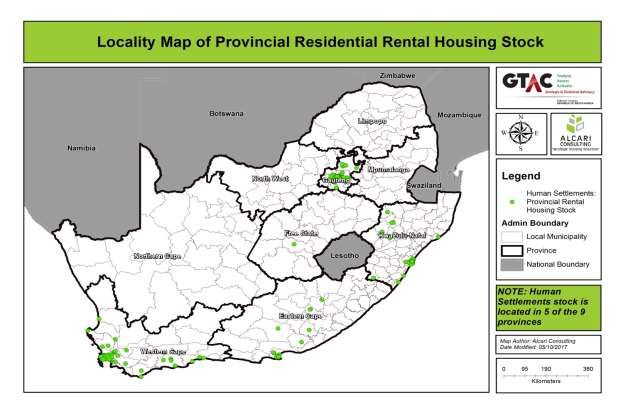
now only located in five provinces, the overwhelming majority of which are in KwaZulu-Natal and
Gauteng. The other provinces have devolved or closed off their portfolios. The Western Cape must be
singled out as having stock in well-located areas such as on De Waal Drive (now Philip Kgosana Drive) and
in Sea Point, where property values are high. The asset registers are not complete so there is no clarity on
the typology of the 337 units. There is no reconciliation between the asset and leasing registers.
Table 2: National property portfolio at 31 March 2016
Province Dwellings Flats Rooms Other Total %
E Cape 38 22 0 30 90 2%*
Free State 45 3 0 - 48 1%
Gauteng 298 1 184 95 117 1 694 33%
KwaZulu- 218 2 216 12 117 2 563 50%
Natal
W Cape 302 384 6 73 765 15%
Total 901 3 809 113 337 5 160 100%
* Percentages are rounded up.
Average monthly rentals are below R600 per month. The disposal of the properties is hampered by the
high level of service arrears (which the EEDBS subsidy does not cover), a lack of funds to undertake audits
of building condition and beneficiaries, and a lack of alternative subsidised accommodation for non-
qualifying beneficiaries. PPRHS properties tend to be dispersed across municipalities rather than clustered
together, as shown in Map 1.
Map 1: Locality map of the national property portfolio
5Rentals have been very affordable and have included the cost of electricity – some rentals initially were
as low as R150 per month. The intention was for rentals to increase over time (based on a predetermined
sliding scale). Deposits equivalent to one month’s rental were also required. In most cases, no changes
have been made to the rentals or the payment arrangements and this has affected the overall revenue
received from the rental stock.
Since 1994, with the devolution process and various changes in provinces and municipalities, the rental
properties and their leasing have mostly not been well managed as this was not properly anticipated and
provided for in the programmes. The staff attached to this stock have retired or been transferred or
moved, and the institutional memory and information available on this housing stock is either limited or
entirely absent. Given that the properties are more than 20 years old, archives and documentation have
been difficult to locate.
Revenue received from the properties is minimal. The operating costs and overheads are covered by the
Human Settlements Development Grant (HSDG), the EEDBS subsidy in the case of sales, and some funds
from provincial equitable share funding. The rental stock is not managed by property, project, unit or
tenant due to various changes that have occurred over the last few years, among other reasons. Some
provinces record all information in the debtors’ system while others only capture some information in this
system and reconcile other information manually.
There have been proposals to physically audit the remaining stock to determine the transfer of the
housing stock either to individual home-owners or other affordable rental housing programmes. These
processes have not been fully implemented mainly due to a lack of funding and skilled resources to do the
6required work. There have also been other priorities, such as providing new housing opportunities rather
than resolving historical stock.
Regularisation of tenants would downsize or right-size
Based on leasing information received from some of tenants into the appropriate housing programme on the
basis of affordability. For example, a tenant could be right-
the provinces, tenants and purchasers consist of low- sized by converting the unit from a PPRHS to an RDP unit or
income beneficiaries, non-qualifying occupants the tenant could be right-sized to another RDP unit and the
existing unit let to a qualifying beneficiary.
(whose income is above the threshold) and illegal
Regularisation of the unit would mean allocating the unit to
occupants. There is also a category of tenants or a housing programme that is suitable for the area in which
purchasers who have no claim to the property as the the unit is located and demand in the area. For example, the
unit could be switched from one human settlements
original tenant or purchaser is deceased. programme to another.
Given this context, an audit of tenant income,
occupancy and affordability must be done to regularise the tenants and purchasers into the appropriate
housing typology. The resolution that is crafted must take into account government’s other housing
programmes.
6 Current institutional framework
6.1 Spheres of government
Figure 2 outlines the institutional arrangements and role-players involved in PPRHS. The programme is
structured with national government responsible for policy, programme funding and oversight, and
provincial government responsible for property management and sales. The beneficiaries were meant to
initially pay rent (lease agreement), then purchase and pay instalments (sale agreement) with the
intention that they would ultimately take transfer of the property. Rentals are paid at the provincial offices
or via the post office. Provinces are responsible for all rates and taxes and municipal charges on the
properties.
National government has made several amendments to its grant funding tools, addressing programmatic
challenges to enable the transfer of the stock. However, these have failed to address the shortcomings of
the subsidy funding model, where equity across subsidy instruments has been the main argument for
limiting the adjustment of the amount of available funding. Provinces, on the other hand, have failed to
implement the programme due to poor budgeting; lack of will; lack of appropriately skilled capacity to
sectionalise the properties; and other property transfer priorities such as auditing properties and
tenancies and dealing with the resultant regularisation of the properties and beneficiaries.
Auditing is necessary to inform a sustainable solution for the properties and sitting tenants, purchasers
and illegal occupants. For example, auditing will determine whether a property must be retained as
affordable rental stock, sold or transferred, and how tenants, purchasers and illegal occupants should be
regularised into government-subsidised units with the appropriate tenure option.
Figure 2: Institutional framework
7Parliament
Cabinet
Ministry of Human
Ministry of Finance
Settlements
Policy, funding, Dept of Human
oversight Settlements National Treasury
Provincial Treasury
Planning, property Provincial Human
Tribunals
management Settlements
Low income tenants
Pay rent, comply
with lease
Municipalities
CBO’S & NGO’S Post Office Service providers:
Property & facilities
6.2 Funding flows
Over the three-year Medium-Term Expenditure Writing off debt owed to the state – The Public Finance
Framework, the National Treasury allocates funds to Management Act and Treasury regulations make provision
the NDHS via the national budget vote and the HSDG for writing off debt if:
All reasonable steps have been taken to recover the
that forms part of the vote. These funds are then debt.
allocated to provinces for the various housing Recovering the debt would be uneconomical, cause
undue hardship to the debtor or be to the advantage
programmes, as shown in Figure 3. The provincial of the state to effect a settlement of its claim or to
strategic and annual performance plans and provincial waive the claim.
In the case of this stock, given that for many years occupants
HSDG business plans should provide funding and have not been paying back their debt, debt write-offs would
details per programme, specifically for the PPRHS. In be possible. Some, but not many, provinces have written off
most cases, the plans indicate inaccurate and occupants’ debt.
inconsistent budgeting. This is largely due to poor
planning and lack of performance targets for the disposal and management of the portfolio.
Provincial revenue in the form of rentals and instalments is recorded and captured in the debtors’ system.
Sales are supported and funded from EEDBS and the rectification subsidy (where applicable), while
property management costs and any shortfalls on operating the stock are covered by the state asset
management programme, top sliced from the provincial HSDG allocation. Some provincial equitable share
is used to cover staffing costs for managing the properties.
Poor property management systems and political interference hamper evictions, rent increases and rent
collection. Collection of instalments for sold properties is also low and the process to ensure that transfers
take place is ineffective. Debt write-off, while possible for this stock, has not been occurring.
8Figure 3: Funding framework
6.3 Public rental housing stock and the affordable rental housing programmes
Recently, GTAC and the NDHS undertook an evaluation of the social housing and CRU programmes
respectively. The results related to sustainability and management of the stock indicate that the social
housing rentals are set on the basis of long-term viability and that management arrangements are good.
The CRU evaluation concludes that value for money is not achieved, rentals are not set at an economic
cost recovery rate, collection rates are low and maintenance is poor.
7 Programme analysis
The focus of these properties has been on sales and transfer rather than asset planning and proper
property management. The universal elements outlined for the programme in Table 3 are largely not in
place or inadequately performed by the provinces.
9Table 3: Universal elements
Programme elements Sub-elements Function of
Asset planning Research, policy/legislation and programme National Department of Human Settlements
development
Capital and operating grants
Monitoring and evaluation
Asset management review Provincial Department of Human Settlements
Asset management plans and budgets
Asset management Leasing/letting management
Rental management
Lease/tenant management
Maintenance management
Facilities management
Utilities management
Asset disposal Disposal method
Property preparation
Funding the transaction
Contracting
Property transfer/conveyancing
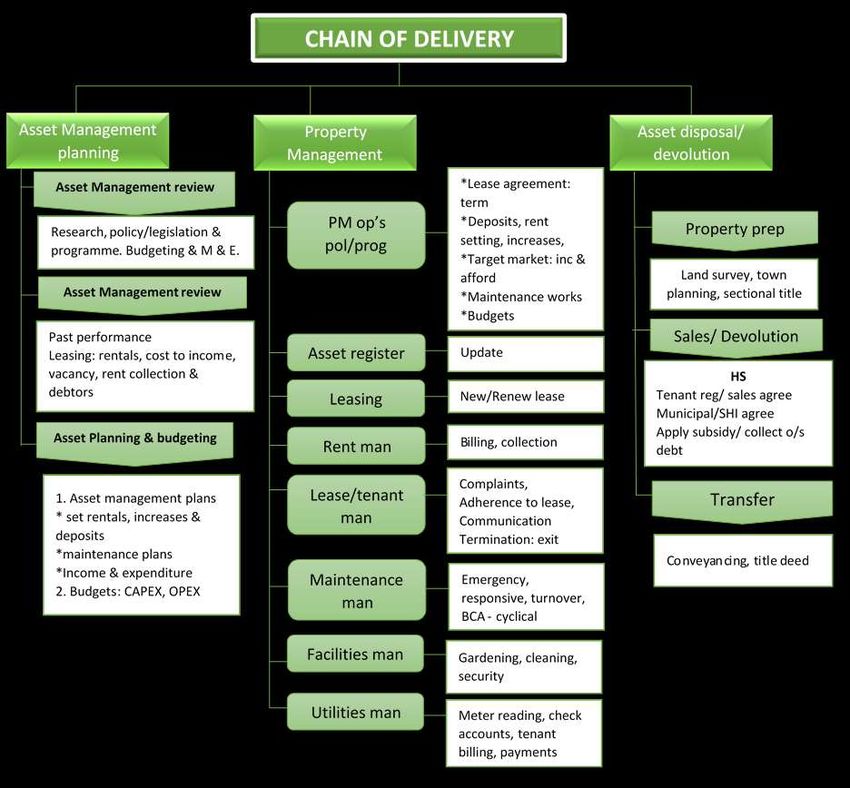
The chain of delivery set out in Figure 4 indicates the ideal property management arrangements and
services required by the provinces.
10Figure 4: Chain of delivery
At most, the provincial departments should attend to basic maintenance, service municipal rates, collect
minimal rentals and attend to the leasing of units as they become vacant. Poor planning results in a
number of critical weaknesses: a financially non-viable portfolio, which depends on extensive government
funding; sitting beneficiaries who enjoy subsidies that over time amount to much more than an RDP
subsidy; assets in a poor state of repair; and poor lease and sales management. Asset and property
management is not anticipated and properly provided for in the programmes.
Table 4 summarises the key programme challenges that have been detailed in the introductory sections
of this report.
11Table 4: Programme challenges
Key area Detail Result
NDHS policy Policy/programme environment not Lack of an overarching and coherent affordable rental housing
& political responsive to challenges policy that is based on sustainability.
environment Inadequate funding model resulting in not all stock transferred
to beneficiaries.
High cost to government to hold and manage stock.
Sitting beneficiaries receiving excessively more state grants than
other low-income beneficiaries, which reduces the housing
opportunities for new qualifying beneficiaries.
Inadequate programme funding Poor assessment of budget requests from provinces.
Properties underfunded to maintain value of the property and
to achieve programme objectives and sustainability.
Lack of programme oversight and Inadequate reporting framework leading to poor assessment of
monitoring reports from provinces and no directives issued to ensure
programme objectives are met.
PHDS: Costs and capacity to administer the High cost of staffing with low levels of capability to implement
stock the policy/programme.
PHDS: Availability of alternative housing for Tenants who cannot afford rental product to be downsized into
non-qualifying beneficiaries RDP products and overqualifying illegal occupants evicted.
Political will to allow provinces to increase Low rentals and rent collection rates.
and collect rentals and to regularise non- No rent increases.
qualifying tenants No eviction consequences for non-payment of rentals.
Eviction of beneficiaries whose incomes are above the threshold
as well as illegal tenants.
PDHS asset Poor asset maintenance planning Premature ageing of the buildings, resulting in:
planning A poor state of repair of the stock
Health and safety risks
Non-compliance with building and safety legislation.
Leasing register not complete and updated Inaccurate lease register, leading to expired leases and illegal
tenants/occupants.
Low and unsustainable rental/instalment Very low rentals – unsustainable portfolio.
revenue: unviable rent setting and No rent increases – unsustainable portfolio.
increases
Inadequate measures to ensure that the Continuous cost to government.
capacity and funding is in place to All stock not transferred.
implement the transfer programme
Poorly informed sales targets due to poor All stock not transferred.
property preparation and tenant
engagement for sale and transfer
Poor budgeting for operating costs Insufficient budgets to service maintenance, and other property
costs, resulting in creditors.
PDHS asset Low rent collection rates Very low collection rate, high arrears, no consequence for non-
management payment – unsustainable portfolio.
Inadequate maintenance and facilities Poor state of repair of the portfolio.
management Quality of the maintenance undertaken is poor.
Poor lease management Illegal tenants, irregular and non-compliant leases,
ownership/tenancy disputes.
No or low levels of tenant management Non-compliant tenants, unable to address social ills, etc.
PDHS asset Properties not prepared for transfer Sales to close out the programme are not realised.
disposal Objective of asset creation not met.
Beneficiary audits, social facilitation and No action against non-qualifying tenants: either over income
regularisation; audit of occupancy, income thresholds (evictions or right-sizing to gap or social housing) or
and affordability of sitting beneficiaries unaffordability to settle (downsizing to RDP/Breaking New
Ground).
12The housing policy intervention post-1994 was based on acknowledging that tenants had been paying
rent for many years and should be given some form of historical rights. The poor condition of the housing,
mainly as a result of government being a poor property owner, was also recognised in relation to issues
of rights. As a result, the DBS, POP, EDBS, EEDBS and rectification programmes deal with these legacy
issues as follows:
Adequate maintenance of properties will be undertaken before transfer to the tenants,
reducing the initial maintenance liabilities.
The process of transfer should recognise that the tenant may have paid for the property over
many years and therefore transfer is a means of asset creation for low-income communities.
Despite these good intentions, provinces have not been able to implement the programme to realise
transfer of all the units.
The logical model in Appendix 1 is structured in terms of the programme elements and its sub-
components in the chain of delivery. The outputs relate to efficient and effective management of the
stock that is currently not well managed and the disposal of the stock to sitting tenants. Key indicators are
developed to enable departments to measure and monitor performance of the stock. The risks and
assumptions relate to inability to transfer the properties to the tenants, poor planning, unsustainable
rentals and low rent collection, inadequacy of the EEDBS subsidy quantum, and premature ageing of the
property as a result of poor maintenance resulting in an increasing cost to government over the long term.
The desired impact aligns with the programme’s original goal of creating assets for low-income earners
and so helping normalise the housing market.
8 Expenditure analysis
The expenditure analysis was drawn from the Human Settlements debtors’ system and period totals
reports, the provincial asset and leasing registers, and Basic Accounting Systems expenditure data. Data
was also sourced from the social housing and CRU programmes and the Tenant Profile Network for the
private rental housing market in order to develop benchmarks against which the portfolio under review
could be measured.
8.1 Programme funding sources and flows
The asset management costs for the period under review (2013 to 2016) amounted to R269 846 517. Of
this, the state had to fund about R224 288 673. The balance was funded by rental and instalment sale
income from tenants and purchasers, amounting to R45 557 844, or 16.88% of the said costs. This
amounts to an additional unintended subsidy of R43 467 per tenant over the three-year period (average
of R14 489 per unit per year and R1 207 per unit per month).
Records provided by the debtors’ system for the past six years (2011/12 to 2016/17) indicate an
unintended subsidy of R95 817 per tenant over the six-year period (average of R15 970 per unit per year
and R1 331 per unit per month). These figures indicate a growing unintended subsidy year on year.
Table 5: Summary of income, expenditure and sources of funds
2013 to 2016
13All 5 Provinces Combined
Income as Deficit between % sliced
Financial Year
Expenses Income % of Expenses and Grant from
Expenses Income Grant
13/14 R88 575 963 R13 859 202 15.65% R74 716 761 R13 274 959 000 0.56%
14/15 R94 345 863 R16 743 145 17.75% R77 602 717 R13 316 096 000 0.58%
15/16 R86 924 691 R14 955 497 17.21% R71 969 195 R13 110 097 000 0.55%
Total 3 years under review (2013/14 to 2015/16) R269 846 517 R45 557 844 16.88% R224 288 673 R39 701 152 000 0.56%
2011 to 2016
All 5 Provinces Combined
Deficit Deficit Deficit
Income as % sliced
Financial Year between p.u.p.a. p.u.p.m.
Expenses Income % of Grant from
Expenses and (unintended (unintended
Expenses Grant
Income subsidy) subsidy)
11/12 R97 069 145 R22 341 218 23.02% R74 727 927 R11 304 910 000 0.66% R14 482 R1 207
12/13 R104 887 063 R10 864 280 10.36% R94 022 783 R11 898 731 000 0.79% R18 221 R1 518
13/14 R88 575 963 R13 859 202 15.65% R74 716 761 R13 274 959 000 0.56% R14 480 R1 207
14/15 R94 345 863 R16 743 145 17.75% R77 602 717 R13 316 096 000 0.58% R15 039 R1 253
15/16 R86 924 691 R14 955 497 17.21% R71 969 195 R13 110 097 000 0.55% R13 948 R1 162
16/17 R112 494 281 R11 116 026 9.88% R101 378 256 R13 245 020 000 0.77% R19 647 R1 637
Total 6 years (2011/12 to 2016/17) R584 297 006 R89 879 367 15.38% R494 417 639 R76 149 813 000 0.65% R95 817 R1 331
8.2 Revenue and expenses
8.2.1 Income
The primary revenue sources are the government contribution, which consists of HSDG top slice (state
asset management grant)/EEDBS/equitable share, and rentals and sales. Low rental charges and low levels
of rental and instalment payments from beneficiaries show limited revenue or income received from
these properties. In addition to the low rentals, the rent collected is less than budgeted or raised in all
provinces.
Graph 1: Sources of income
Sources of income
R18 000 000
R16 000 000
R14 000 000
R12 000 000
R10 000 000
R8 000 000
R6 000 000
R4 000 000
R2 000 000
R0
HSDG Top Slice, EEDBS & Equitable Share Sales and Rental Income
8.2.2 Rent collection and rental debt
The extent of non-payment is shown as the difference between rent raised and rent collected. This deficit
is added to the outstanding debtors’ balance each year. Gauteng and KwaZulu-Natal have the highest
uncollected rental amounts. This is a result of these provinces having the most units and the lowest rent
collection rates.
Graph 2: Rent raised vs rent collected
14Rent collection rates vary per province, with an average collection of 43-48% over the three financial
years. Free State (with few units) and Gauteng have the lowest collection rates, while the Western Cape
and Eastern Cape have the highest. This skews the rental collection rate upwards when consolidated
nationally.
Graph 3: Rent collection rates
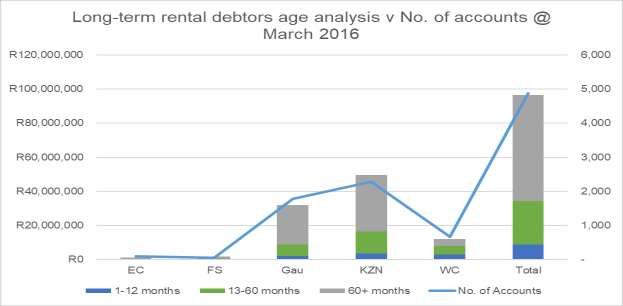
The debt has accumulated over many years and has not been written off. It is highly unlikely to ever be
recovered.
Graph 4: Debtors age analysis of the portfolio
15The accumulation of debt due to the non-payment of rent affects the ability of provinces to dispose of the
stock. The EEDBS does not make full provision for absorbing the historical debt, which, in most cases,
exceeds the cost of the unit and the quantum of the EEDBS. In most cases, tenants cannot afford to service
the debt or are unwilling to.
8.2.3 Expenditure
Apart from the cost of staff, the largest expenditure items on these properties are rates, taxes and
maintenance.
Graph 5: Expenditure analysis
The average expenditure per unit per month exceeds the rentals charged. There is a growing operating
shortfall on the portfolio of properties that is being covered by the HSDG top slice (state asset
management grant) and provincial equitable share. In the operating costs per unit obtained from the
debtors’ system, the Eastern Cape was an outlier at R10 361 per unit per month. However, the detailed
costs obtained from the provincial Port Elizabeth regional office were in line with the other provinces at
16R2 054 per unit per month in 2015/16. The difference of just under R8 307 per unit per month was not
explained, nor could it be further investigated.
Graph 6: Average expenditure per unit per month
8.2.4 Net operating result
The portfolio operates at an ever-increasing loss because expenditure exceeds income year on year.
Graph 7: Operating loss
KwaZulu-Natal, followed by the Eastern Cape and Gauteng, receives the majority of government grants.
This is appropriate, as these provinces have the highest number of units in their respective portfolios.
Graph 8: Provincial allocation of government grants, 2013 to 2016
178.2.5 Performance comparison to other rental markets
Average rentals are far below market, minimum social housing and community residential unit rentals.
Table 6: Performance comparison to other rental products, as at 2016
Rental products Average monthly rentals Average rent collection Management costs
per unit per month
2015/16
PPRHS R259 48% R3 904
CRU R390 18% R798
Social housing R750 90% R1 350
Market rentals R5 665 85% R950
Rent collections are better than CRU collection rates but much less than social housing, which performs
better than the private rental market. This portfolio has a significantly higher management cost than other
forms of rental product.
8.3 Key findings
Overall, it is unsustainable to continue to manage the stock as rental stock and for provincial departments
to continue to act as management agents. The exception is the performing portfolio of the Western Cape
stock. The operating subsidy or annual top slice from the HSDG, together with the EEDBS subsidy and the
growing rental debt, creates an individual subsidy to the beneficiary far greater than the subsidy provided
in any of the other housing programmes. The policy equity argument does not hold for this stock.
189 Cost modelling
Based on the expenditure analysis, a set of solutions has been formulated in the form of scenarios which
have been modelled using data from the expenditure analysis. The financial models provide a forecast for
each scenario. The base case or “as-is” scenario projects rental income and expenses if the current
operations continue without any changes. Three additional scenarios are tested and modelled using
defined assumptions.
9.1 Scenarios
Table 7: Description of base case and scenarios
Scenario Explanation
Base case: Slow disposal to existing occupants
operations continue Each province has a different rate of transfer of properties and collections of loans and rentals. For
as is the provinces where progress in transfers has been slow, this could extend to 20 years.
Rental operations continue with similar low collection rates
No rent increases
Property transfers continue at a similar % of the property portfolio until all have been sold
EEDBS stays at R7 500 per unit on transfer
Debt on properties transferred continues to accumulate until being written off
Operating costs reduce in proportion to the rental portfolio
Staffing costs reduce in proportion to the rental portfolio
Inflation on operating costs at 6% per year
No escalation of rentals
Transfers/sales use HSDG funding
Debt accumulation and write-off
Model will show cost to government and how long it will take to close this portfolio
1. Outsource Completion of the sales transfer process happens in a specified period. This will be set at three
property years from 2019/20 to 2021/22
management and Outsourced administration costs of R400 per unit per month for units rented and once-off transfer
sales administration costs of R1 250 per unit to replace salary costs
Improved rent collection, accelerated sales, reduced operating cost in province, direct cost remains
and needs to be covered
Existing human settlement staff administering the properties are redeployed, i.e. no severance
packages
Debt on rental and sales debtors is written off
EEDBS quantum is set at the amount to cover any shortfall owing on debts outstanding
Debt is written off at time of transfer/sale
All other assumptions remain the same
2. Accelerated sale to Directive issued from national government to accelerate transfers within a specified number of years
existing occupants EEDBS quantum is set at the amount to cover any shortfall owing on debts outstanding
Debt is written off at time of transfer/sale
Staff costs remain the same, but a different team replaces existing staff
3. Devolve to Rental operations remain as they are, but ownership and management are devolved to municipalities
municipalities to Staff administering the human settlement property portfolio are transferred to municipalities
manage and sell EEDBS quantum = amount required to cover all shortfalls
Debt is written off at time of transfer/sale
Scenario Explanation
4. Create own User can change variables and see impact per province – variables = years, EEDBS value, units
scenario transferred
199.2 Projected fiscal implications
Table 8: Summary of financial implications of various scenarios
Total over 20 years Average loss per unit (Sales and Debtors)
Summary of Fixed Scenarios and Scenario Description
Years to Close the Net Cash Flow
Ave Rent Calc: Settlement Net Cash Flow 2017-2037 Debtors Balance Debtors Balance Net Cash Flow +
Scenario HS Programme Rent Increase EEDBS Amount Net Cash Flow + Debt w/o 2017-2037 (=HSDG
Collection % of Debt per unit (=HSDG & EEDBS Spent) remaining remaining Debt w/o
(from 2018/19) & EEDBS Spent)
Total HSDG and EEDBS Spent
Base Case BC 17 Existing None Fixed -R372 498 -R2 756 114 523 R0 -R2 756 114 523 -R372 498 R0 -R372 498
Scenario 1 - Outsource Property Management Sc1 5 Target None Calc -R193 014 -R1 441 800 711 R0 -R1 441 800 711 -R194 864 R0 -R194 864
Scenario 2 - Accelerate Transfer Voetstoots to Existing Occupants Sc2 2 Existing None Calc -R165 617 -R1 243 776 432 R0 -R1 243 776 432 -R168 101 R0 -R168 101
Scenario 3 - Devolve to Local Municipality Sc3 1 Existing None Calc -R165 297 -R1 223 029 123 R0 -R1 223 029 123 -R165 297 R0 -R165 297
=Tenant Subsidy =Overall Tenant
=Tenant Subsidy =Overall Tenant Benefit
p.u. Benefit p.u.
Figure 5: HSDG funding required per scenario to cover losses
209.3 Evaluation of the scenarios
Table 9: Detailed results of cost to government, with comparison to other subsidy instruments
Results summary Base case Scenario 1 Scenario 2 Scenario 3
Income (= rent & sales income) R78 509 406 R62 486 353 R56 893 308 R56 893 308
Costs/expenses R2 000 795 573 R669 096 481 R448 464 102 R446 094 075
Net Surplus/deficit funded by HSDG top slice R1 922 286 168 R606 610 128 R391 570 795 R389 200 768
Total EEDBS used R833 828 355 R833 828 355 R833 828 355 R833 828 355
Total government contribution (HSDG + EEDBS) R2 756 114 523 R1 440 438 483 R1 225 399 150 R1 223 029 123
Increase/decrease in HSDG & EEDBS compared to R0 -R1 315 676 040 -R1 530 715 373 -R1 533 085 400
base case
EEDBS per existing rental unit (5 160 units) R161 595 R161 595 R161 595 R161 595
HSDG top slice per existing rental unit R372 536 R117 560 R75 886 R75 427
Total government contribution per unit R534 131 R279 155 R237 480 R237 021
Comparison per unit to base case R0 -R254 976 -R296 650 -R297 110
% saving compared to base case - 48% 56% 56%
Comparison of HSDG top slice to other subsidies
RDP capital subsidy per unit (R153 000 per unit) R219 536 -R35 440 -R77 114 -R77 573
% saving compared to base case 16% 35% 35%
CRU capital subsidy per unit (average R155 000 per
unit) R217 536 -R37 440 -R79 114 -R79 573
% saving compared to base case 17% 36% 37%
Social housing capital subsidy per unit (R265 000 per
unit) R107 536 -R147 440 -R189 114 -R189 573
% saving compared to base case 17% 36% 37%
It is concerning that the current situation (base case) is providing a subsidy much bigger than any other
housing subsidy instrument in an environment where the NDHS cannot keep up with the demand for
subsidised housing. As a result, the value of this additional and unintended subsidisation limits new
housing opportunities to waiting beneficiaries.
Table 9 shows that scenarios 2 and 3 would produce the best financial results in the form of the lowest
subsidies. Because scenario 3 involves merely shifting the burden from national and provincial
government to local government and scenario 2 allows for aligning earnings to the ability to pay, it is
recommended that scenario 2 be selected as the preferred option.
Table 10: Evaluation of scenarios
Scenario Financial and implementation implications Recommendation
Base case Highest cost to government with mostly non-qualifying beneficiaries Not recommended
receiving subsidies forever.
Scenario 1 High cost to government with major implementation challenges, such as Not recommended
it being highly unlikely that social housing or the private sector will take
on the management of the units, and potential resistance from
beneficiaries to the solution, which entails higher rentals and collection
rates and evictions for non-payment.
Scenario 2 Lowest cost to government and least resistance to implement. Requires Recommended
the recommended policy/programme directive to allow the subsidy to
cover total cost/debt, right-sizing and sales management.
Scenario 3 Cheapest option to provinces but higher costs to municipalities (equal to Not recommended
scenario 1). Major implementation challenges include high resistance by
municipalities to a reduction of their rates base and municipalities
lacking property management capacity.
2110 Conclusions and recommendations
The recommendations are based on the above expenditure analysis and the intention of asset creation
for low-income beneficiaries. The recommendations are a reflection of scenario 2 of the cost model –
accelerated transfer of the stock.
Table 11: Summary of conclusions and recommendations
Conclusion Recommendation
Policy and programme management
Affordable housing provision The stock (both Human Settlements and Public Works) must be assessed for use for the
affordable housing programme and target market. This implies that the NDHS must use
this report to compile the White Paper for Human Settlements
Policy/programme Directive issued from national government to accelerate transfers within a specified
environment not responsive to number of years (three years from 2019), with a clear programme of action to conduct
challenges building condition assessments/rectification maintenance, property preparation for
transfers, social facilitation to realise regularisation of the tenancies/purchasers
Inadequate programme EEDBS quantum is set at the amount to cover any shortfall owing on debts outstanding
funding and the purchase price or balance of the purchase price
Debt is written off at time of transfer/sale
Lack of programme oversight Appropriate reporting system developed and in place and action to be taken to intervene
and monitoring in non-performance
Asset planning
Poor asset maintenance Compile accurate asset register, audit the building condition and put in place a quantity
planning survey-costed maintenance plan
Leasing register not complete Lease agreements updated to inform lease register, which is reconciled with asset register
and updated
Low and unsustainable Emphasis on regularisation and sales campaign
rental/instalment revenue:
rent setting and increases
Poorly informed sales targets
and poor property preparation
for sales
High overhead costs with low Reduce staffing (redeploy to other units), outsource audits and property management,
levels of property regularisation and sales campaign
management services
Poor budgeting for operating Budgeting for direct property costs such as rates, maintenance, insurance and overheads
costs as well as regularisation, property preparation and conveyancing
Asset management
Low rent collection rates No changes to rentals, emphasis on sales campaign
Inadequate maintenance and Maintenance as per maintenance plan to enable property transfer
facilities management
Poor lease management Focus on sales campaign
No or low levels of tenant Social facilitation and tenant regularisation for sales or right-sizing
management
Asset disposal
Properties not prepared for Technical preparation, sectional titling of the properties and support to the beneficiaries
transfer in setting up the body corporate and management arrangements
Insufficient information on Beneficiary audits and regularisation: audit of occupancy, income and affordability of
tenants in order to establish sitting beneficiaries. Beneficiary signs transfer papers, conveyancer appointed and
regularisation of the tenancies conveyancing supported (i.e. prepare the documentation) and monitored
Low levels of asset disposal: Target set over a three-year period: year one is preparation, year two and three are sales
poor setting of sales targets and transfers to beneficiaries
22The tenancy and property condition audits are critical to establish the appropriate housing needs of the
sitting occupants, to which housing programme the stock should be converted and to what extent the
stock should remain for affordable rental housing under an improved management arrangement. From a
policy and programme point of view, the NDHS should use this study to inform the development of an
affordable rental housing programme.
As such, the NDHS should now provide a directive to allow the regularisation, sale and transfer and
covering of all the related costs and debt to enable the transfers as shown in the cost modelling.
The option of using social housing or the private sector to manage the public rental stock is a further
consideration for the remaining stock that cannot be transferred. The modelling confirms that the
outsourcing of management will be more cost-effective than the current situation.
Most of the analysis indicates that provincial government is not able to be a proper landlord for residential
rental housing properties and is not able to perform both the asset and property management function
required. Sociopolitical dynamics together with poor planning, management and oversight make this a
difficult role for provincial government. Information on municipal public residential housing stock (for
example, City of Cape Town and Tshwane) show the same expenditure and income trends as outlined for
the provincial portfolio. This will need to be considered in the increased roll-out of the affordable rental
housing programmes and especially CRU, where government is both owner and property manager.
An important variation to the recommended scenario relates to the Western Cape, where the stock is
more sustainable in respect of the rentals, rent collection rates, state of repair and, most importantly, the
location and high values of some of stock. In this regard, it is recommended that the stock be retained
and converted to social housing to contribute towards government’s provision of affordable rental
housing stock.
2311 Appendices
1. Logical model
2. Expenditure analysis
3. Cost model
4. Provincial and national maps
5. Rental Housing Market Report
6. Reference materials & information collected
7. Data reliability & validity
24You can also read


