Microplastics Contamination in the Aquatic Environment of Indonesia: A Comprehensive Review
←
→
Page content transcription
If your browser does not render page correctly, please read the page content below
Journal of Ecological Engineering
Journal of Ecological Engineering 2021, 22(10), 127–140                                        Received: 2021.08.15
https://doi.org/10.12911/22998993/142118                                                      Accepted: 2021.09.14
ISSN 2299-8993, License CC-BY 4.0                                                             Published: 2021.10.01

Microplastics Contamination in the Aquatic Environment
of Indonesia: A Comprehensive Review

Gina Lova Sari1*, Ahsanal Kasasiah2, Marsah Rahmawati Utami2,
Yulinah Trihadiningrum3
1
    Department of Environmental Engineering, Faculty of Engineering, Universitas Singaperbangsa Karawang,
    Teluk Jambe Timur, Karawang 41361, Indonesia
2
    Department of Pharmacy, Faculty of Health Science, Universitas Singaperbangsa Karawang, Teluk Jambe
    Timur, Karawang 41361, Indonesia
3
    Department of Environmental Engineering, Faculty of Civil Engineering, Environment, and Geoscience,
    Institut Teknologi Sepuluh Nopember, Surabaya 60111, Indonesia
*
    Corresponding author’s e-mail: ginalovasari@gmail.com

ABSTRACT
The abundance of microplastics (MP) in the aquatic environment is increasingly disturbing for maritime countries,
especially Indonesia, because it has the potential to threaten the health and sustainability of aquatic ecosystems.
This review summarized and discussed the distribution of MP abundance in Indonesian aquatic ecosystems which
concluded that rivers, bays and estuaries, beaches, seas, and even fish and shellfish have been contaminated. The
highest contamination of MP was found in the waters of Jakarta, West Java, and East Java, which are densely
populated areas. The potential threat of exposure and accumulation of MP to human health was also discussed.
However, differences in the methods and units of measurement for MP as well as limited information regarding the
interaction of MP with human organ functions are weaknesses in this review. The future research on the relation-
ship between food and feeding habits of the community around contaminated waters with the accumulation of MP
in the human body is needed to identify the prevention and treatment strategies.

Keywords: aquatic environment, contamination, human exposure, Indonesia, microplastics

INTRODUCTION                                               2020; Firdaus et al., 2020; Lestari et al., 2020;
                                                           Rios Mendoza & Balcer, 2019].
    Plastic is a synthetic organic polymer that is              MP have been found in the aquatic environ-
light, strong, and easy to shape [Firdaus et al.,          ment of several countries, including Iran [Aliabad
2020], then widely used for various needs of both          et al., 2019], Bangladesh [Hossain et al., 2019], In-
domestic and industrial [Aliabad et al., 2019; Rios        dia [Sarkar et al., 2019], China [Zhu et al., 2019],
Mendoza & Balcer, 2019]. The high intensity of             Mexico [Ramírez-Álvarez et al., 2020], Canada
plastic use has not been accompanied by proper             [Anderson et al., 2016], and Indonesia [Alam et
post-use management, which has increased its               al., 2019; Firdaus et al., 2020; Lestari et al., 2020].
abundance and pollutes the environment, espe-              Therefore, other aquatic environments in Indone-
cially aquatic ecosystems. Plastics have been able         sia are also highly contaminated by MP, consid-
to undergo physical, mechanical, and biological            ered by Indonesia as one of the largest contribu-
fragmentation into smaller particles which are             tors of plastic debris to the oceans in the world,
classified into microplastics, meso-plastics, and          reaching 1.29 tons/year [Jambeck et al., 2015].
MP with a size of < 5.00 mm; 2.50–5.00 mm; and             This condition has a negative impact because MP
> 2.50 mm, respectively [Alam & Rachmawati,                is hardly degraded and able to adsorb hydrophobic

                                                                                                              127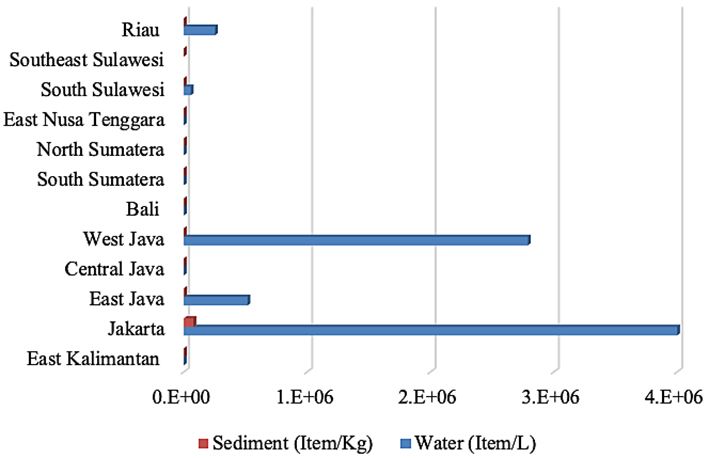
Journal of Ecological Engineering 2021, 22(10), 127–140

compounds which are persistent and toxic in aquat-        comes from the production of beauty/cosmetic ma-
ic environment [Rios Mendoza & Balcer, 2019].             terials, cleaners, plastic packaging, scrubbers, and
     MP also potentially becomes a vector of con-         pellets in each of their products [Alam et al., 2019;
taminants, because the particles may undergo bio-         Anderson et al., 2016]. Meanwhile, the second
magnification, i.e. pollutants transfer through the       source is the plastic debris fragmentation in the wa-
food chain [Aliabad et al., 2019; Caruso, 2019].          ters [Alam et al., 2019; Aliabad et al., 2019] which
Biomagnification has been confirmed by several            annually accumulates as much as 4.80–12.70 mil-
studies, which reported that MP was found in the          lion tons, to which Indonesia has contributed al-
fish and shellfish living in a contaminated aquatic       most 1.29 tons/year [Jambeck et al. 2015]. It in-
environment [Caruso, 2019; Hossain et al., 2019;          dicates that the abundance of MP may continue
Sarkar et al., 2019], human feces [Aliabad et al.,        to increase every year [Anderson et al., 2016].
2019; Liebmann et al., 2018], and human placen-                On the basis of the shape, MP is divided into
ta [Ragusa et al., 2021]. These conditions indicate       fragment, fiber, filament, film, foam, and pellet
that MP accumulates in human tissues, which               [Widianarko & Hantoro, 2018; Yona et al., 2020].
may cause various health problems, such as gut            MP is also classified according to the polymer
dysbiosis, impaired kidney function, and cancer           types of polyvinylchloride (PVC), polyethylene
[Carding et al., 2015].                                   (PE), polystyrene (PS), polypropylene (PP), and
     In addition, the permissible levels of MP in         polyester (PES) [Aliabad et al., 2019; Anderson
aquatic environment have not been found, pos-             et al., 2016]. Each type of polymer has a different
ing threat to the waters, biota, food security, and       density, which affects its fragmentation and posi-
public health. It has threatened Indonesia, one of        tion in the water column (Table 1). Table 1 shows
the largest maritime countries in the world, where        that PP and PE float in all types of water, but it
aquatic environment is one of the main sources            still tends to sink like PS, PVC, and PES when
of life, including base water for daily consump-          subjected to biofouling, which increase their den-
tion, aquaculture, and water recreation. The stud-        sity [Anderson et al., 2016; Andrady, 2011].
ies related to the identification of MP abundance              Plastic polymers may undergo various frag-
in the aquatic environment in Indonesia have also         mentation mechanisms, such as PE and PP can
begun, but are still partial.                             be fragmented into MP through photo-oxidation
     Comprehensive information on the abun-               and thermo-oxidation [Anderson et al., 2016;
dance of MP in the aquatic environment has not            Andrady, 2011]. Given the small size of MP, it
been found, which caused that its contamination           may be biodegraded by bacteria over a long time
characteristics in various areas could not be prop-       due to its complex structure [Barnes et al., 2009],
erly compared and identified. The information is          where the carbon is converted into carbon diox-
needed for mapping the condition of aquatic en-           ide and biomass [Andrady, 2011]. Therefore, MP
vironment in Indonesia and increasing the public          may become persistent in aquatic environment
knowledge to plan and develop mitigation of MP            and has a tendency to bioaccumulate in aquatic
contamination. Therefore, the provision of com-           biota when ingested [Anderson et al., 2016; Rios
prehensive information on the MP contamination,           Mendoza & Balcer, 2019].
including abundance, shape, and type of polymer
in aquatic environment of Indonesia is highly ur-
gent, which is also the aim of this review. In addi-      MICROPLASTIC IN INDONESIAN WATERS
tion, recommendations for units of measurement
to facilitate the compilation and comparison of               Identification of MP abundance has been car-
data were also suggested in current study.                ried out in various Indonesian aquatic environ-
                                                          ments, in terms of East Kalimantan, DKI Jakarta,
                                                          Central Java, West Java, Yogyakarta Special Re-
CHARACTERISTICS OF MICROPLASTICS                          gion, Bali, South Sumatra, North Sumatra, West
                                                          Sumatra, East Nusa Tenggara, South Sulawesi,
     MP is defined as a small plastic polymer with        Southeast Sulawesi, Riau, and Maluku which
size lesser than 5.00 mm that derives from indus-         dominated by East Java (see Table 2). Table 2
trial wastewater and plastic debris that ended up in      shows that the abundance of MP has been found
aquatic environment [Anderson et al., 2016]. The          in the water column, sediment, and aquatic biota,
industrial wastewater containing MP generally             as described by [Andrady, 2011].

128
Journal of Ecological Engineering 2021, 22(10), 127–140
Table 1. Types and Density of Microplastic Polymers
Polypropylene Polyethylene Polystyrene Nylon/Polyamide Polyvinylchloride
Polymer Types Polyester (PES)
(PP) (PE) (PS) (PA) (PVC)
Chemical
structure
Polymer
900 910-970 1050 1160 1330 1370
Density (kg/m3)
Water density
1000
(kg/m3)
Brackish water
1005–1024
density (kg/m3)
Sea water
1025
density (kg/m3)
Position Float Float Float Sink Sink Sink
Adapted from Anderson et al. (Anderson et al., 2016)
MICROPLASTICS IN RIVER ECOSYSTEMS Bengawan Solo, Ciwalengke, and Musi with a to-
tal of 0.09–0.36x10³; 0.04–0.19x10³; 1.95–2.70;
The MP abundance reaching as much as 0.30±0.16; and 1.78x10⁻³ particles/kg, respec-
0.55–0.90 particles/L to 0.13x10⁶ particles/L has tively. MP has also been found in the sediment
been found in the water column of 9 rivers in In- of the Tuban River amounting to 0.52–5.88 x10³
donesia (Table 2). The highest abundance of MP particles/m2, but it cannot be compared, because
in river water column was found in the Cimandiri it has different units of measurement. This dif-
watershed, followed by the Surabaya River and ference is one of the main obstacles to identify
Banyuurip Estuary with the number of 3.45– the abundance of MP in the waters, because the
63.38x10³ particles/L and 7.78x10³ particles/L, compilation and comparison cannot be carried
respectively. Meanwhile, the lowest MP abun- out [Rios Mendoza & Balcer, 2019].
dance was found at the Bengawan Solo River. The abundance of MP in the water column
Table 2 shows that the MP abundance in the and sediment of rivers in several areas shows dif-
Surabaya River in 2019 and 2020 was differ- ferent amounts due to the population and public
ent; there was an increase from 0.52–2.53x10³ activities around the area [Barnes et al., 2009;
particles/L to 0.76–43.11x10³ particles/L, respec- Joesidawati, 2018]. The higher the population
tively. The dominant shape of MP found there is and public activities around the river, the more
fragment and film that may be formed through unmanaged plastic waste and laundry wastewa-
photo-degradation and thermo-oxidation of plas- ter are generated [Manalu, 2017]. Piles of un-
tic waste in the waters [Barnes et al., 2009]. The managed plastic waste in rivers cause a decrease
condition is relevant to the continuity of plastic in flow velocity and water movement down to
waste that ends up in rivers every day, but this 0.00–0.10 m/s [Barnes et al., 2009], causing frag-
cannot be fully handled by the self-purification mentation and centralized accumulation as found
ability of the river which leads to MP accumu- in this review in the Ciwalengke River.
lation. Continuity and accumulation due to plas- In the Ciwalengke River, similar shape and
tic waste disposal is in line with the predictions polymer type of MP, namely fiber and PES, has
by World Bank as stated by Firdaus et al. [2020] been found in water column and sediment. The
that in 2025 there will be a 76.00% increase in accumulation of PES in the sediment of the Ci-
plastic waste, which simultaneously increases the walengke River was caused by higher MP den-
risk of MP abundance in the Indonesian rivers. sity than water, amounting to 1370 kg/m3 and
This condition is emphasized by Yudhantari et al. 1000 kg/m3, respectively [Anderson et al., 2016].
[2019] that 92.40% of plastic waste particles is This condition causes an increase in MP abun-
< 5.00 mm and categorized as MP. In addition, dance in waters, similarly to those found in Bei
laundry wastewater is another source of MP con- and Huanzi Lakes [Wang et al., 2017]. In addition,
tamination in rivers[Andrady, 2011]. the prolonged presence of MP in water column
MP abundance in several river sediments may trigger microorganisms to form a biofilm on
in Indonesia were found at Deli, Muara Badak, the surface of particle, known as biofouling, then
129Journal of Ecological Engineering 2021, 22(10), 127–140
Table 2. Abundance of Microplastics in Indonesian Waters
Microplastics Abundance
Province Area Years Reference
River Bay Sea
Badak Sediment = 0.04-
East River, Kutai 0.19 x10³ particles/ [Dewi et al.,
2015 – –
Kalimantan Kartanegara kg, dominated by 2015]
District fragment
Sediment = 0.19-
Pantai Indah [Hastuti et al.,
2014 – – 2.36x10³ particles/kg,
Kapuk Coast 2014]
dominated by film
Water = 2.88-7.47x10⁶
particles/L, dominated
by fragment
Jakarta Bay 2017 – Sediment = 18.41- – [Manalu, 2017]
38.79 x10³ particles/
DKI Jakarta kg, dominated by
fragment
DKI Jakarta
River-Estuaries
(Tiram, Water = 0.09-
Ciliwung, Sunda 0.11x10³ particles/L, [Rachmat et
2019 – –
Kelapa, Baru, dominated by al., 2019]
Karang, Angke, fragment
Cengkareng
Drain)
Tuban District Sediment = 0.52- [Joesidawati,
2018 – –
Estuary 5.88x10³ particles/m2 2018]
Tuban District Sediment = 73.00- [Joesidawati,
2018 – –
Coast 256.50 particles/m2 2018]
Water in the
Banyuurip Water = 7.78x10³ mangrove area = Water = 7.11x10³
[Ayuningtyas et
Waters, Gresik 2019 partiles/L, dominated 22.89 particles/L, particles/L, dominated
al., 2019]
District by fragment dominated by by fragmen
fragment
Air = 7.14-32.38x10³ [Wijaya &
Surabaya River, partikel/L
2019 – – Trihadiningrum,
Surabaya City
2019]
Water = 1.89
Gili Labak particles/L, dominated
Island, by fiber [Lolodo &
2019 – –
Sumenep Sediment = 65.00 Nugraha, 2019]
District particles/kg,
East Java
dominated by fiber
Sediment = 0.02-
0.34 x10³ particles/
kg, dominated by
Mandangin filament and PE
Island, [Rahmadhani,
2019 – – Water = 2.00-
Sampang 2019]
District 24.00x10³ particles/
m2, dominated by
fragment, filament,
and PVC
Bentar Island, Water = 0.42 particle/
[Germanov et
Probolinggo 2019 – – m2, dominated by film
al., 2019]
District dan fragment
Sediment = 0.09-
Jagir Estuary, 0.41x10³ particles/kg, [Firdaus et al.,
2020 – –
Surabaya City dominated by fiber 2020]
and PES
130Journal of Ecological Engineering 2021, 22(10), 127–140
Table 2. cont.
Microplastics Abundance
Province Area Years Reference
River Bay Sea
Sediment = 0.48-
Wonorejo
0.59x10³ particles/kg, [Firdaus et al.,
Beach, 2020 – –
dominated by fiber 2020]
Surabaya City
and PES
Water = 3.45-
Surabaya River, 63.38x10³ particle/L, [Lestari et al.,
2020 – –
Surabaya City dominated by film 2020]
and PP
Sediment = 0.36
particles/kg,
Brondong dominated by fiber
Waters, dan fragment [Labibah &
2020 – –
Lamongan Triajie, 2020]
District Water = 0.44
particles/L, dominated
by fiber dan fragment
Sediment = ±78.35
Lekok Beach,
particles/m2, [Yona et al.,
Pasuruan 2020 – –
dominated by fiber 2020]
District
dan film
Pasir Panjang Sediment = ±47.85
Beach, particles/m2, [Yona et al.,
2020 – –
Pasuruan dominated by fiber 2020]
District dan film
Watu Prapat Sediment = ±18.67
Beach, particles/m2, [Yona et al.,
– – –
Pasuruan dominated by film 2020]
District dan fiber
Sediment = ±18.29
Kapasan Beach,
particles/m2, [Yona et al.,
Pasuruan – – –
dominated by film 2020]
District
dan fiber
Sediment = 0.17-
0.35x10³ particles/m3,
dominated by fiber
Kepetingan dan fragment [Firmansyah,
Waters, Sidoarjo 2021 – –
Water = 57.00- 2021]
District
79.80x10³ particles/L,
dominated by
fragment dan film
Water = 5.86±3.70
particles/L, dominated
Semarang by fiber [Widianarko &
2018 – –
Beach Sediment = Hantoro, 2018]
3.90±5.45 particles/
kg, dominated by film
Sediment = 21.90-
Kartini Beach, 32.15 particles/ [Azizah et al.,
2019 – –
Jepara District kg, dominated by 2020]
Central fragment
Java - Water = 0.55-
0.90 particles/L,
dominated by fiber
Bengawan Solo
2019 - Sediment = 1.95- – – [A’yun, 2019]
River
2.70 particles/
kg, dominated by
fragment
Karimunjawa Sediment of coral reef
[Muchlissin et
Marine National 2021 – – ecosystem = 11.00-
al., 2020]
Park 96.00 particles/kg
131Journal of Ecological Engineering 2021, 22(10), 127–140
Table 2. cont.
Microplastics Abundance
Province Area Years Reference
River Bay Sea
Pangandaran
Sediment = 26.00-
Beach, [Septian et al.,
2018 – – 78.00 particles/kg,
Pangandaran 2018]
dominated by fiber
District
Water = 3.28±5.85
particles/L,
dominated by fiber
Ciwalengke and PES [Alam et al.,
River, Bandung 2019 – –
Sediment = 2019]
District
West Java 0.30±0.16 particles/
kg, dominated by
fiber and PES
Water = 0,13x10⁶
Cimandiri particles/L, [Lodo Pe et al.,
2020 – –
Watershed dominated by film 2020]
and fragmen
Water = 1.49x10⁶
Pelabuhan Ratu [Lodo Pe et al.,
2020 – partikel/L, dominated –
Estuary 2020]
by film dan fragment
Water = 0.43-0.58x10³
particles/L, dominated
by fragment
[Nugroho et al.,
Benoa Bay 2018 – Sediment = 0.07- –
2018]
0.11x10³ particles/
kg, dominated by
fragment
Sediment =
Doublesix 71.50±28.90
[Mauludy et al.,
Beach, Badung 2019 – – particles/kg
2019]
District dominated by fiber
and PS
Sediment =
148.90±103.80
Kuta Beach, particle/kg, dominated [Mauludy et al.,
2019 – –
Badung District by fiber and PS 2019]
Bali Sediment =
Pantai Melasti, 67.20±46.10
[Mauludy et al.,
Kabupaten 2019 – – particles/kg
2019]
Badung dominated by fiber,
PP, and PS
Sediment =
95.40±52.10
Mengiat Beach, [Mauludy et al.,
2019 – – particles/kg,
Badung District 2019]
dominated by fiber,
fragment, PP, and PS
Sediment =
Tanjung Benoa 70.50±29.60
[Mauludy et al.,
Beach, Badung 2019 – – particles/kg
2019]
District dominated by fiber,
fragmen, and PS
Water = 0.04-
Nusa Penida,
0.90 particles/m2, [Germanov et
Klungkung 2019 – –
dominated by film al., 2019]
District
and fragmen
Sediment =
South 1,78x10⁻³ particles/
Musi Estuary 2018 – – [Ahmad, 2018]
Sumatera kg, dominated by
fragment and PP
132Journal of Ecological Engineering 2021, 22(10), 127–140
Table 2. cont.
Microplastics Abundance
Province Area Years Reference
River Bay Sea
Water = 0.07-
Sei Babura
0.16x10³ particles/L, [Harahap,
River, Medan 2021 – –
dominated by film 2021]
City
and fragment
Water = 0.08-
Sei Sikambing
North 0.17x10³ particles/L, [Harahap,
River, Medan 2021 – –
Sumatera dominated by film 2021]
City
and fragmen
Sediment = 0.09-
0.36x10³ particles/ [Addauwiyah,
Deli River 2021 – –
kg, dominated by film 2021]
and fragment
Naras Hilir Sediment = 13.24
West
Beach, 2020 – – particles/m3, [Yolla, 2020]
Sumatera
Pariaman City dominated by film
Water = 18.00
East Nusa [Hiwari et al.,
Sawu Sea 2019 – – particles/L, dominated
Tenggara 2019]
by fragment
Komodo Water = 0.24-
National Park, 0.29 particles/m2, [Germanov et
2019 – –
Manggarai Barat dominated by film al., 2019]
District and fragment
Water = 0.10-
[Kapo et al.,
Kupang Bay 2020 – 90.20x10⁻³ particles/L, –
2020]
dominated by fiber
Burau Sea,
South Water = 56.20x10³ [Kama et al.,
Luwu Timur 2021 – –
Sulawesi particlesl/L 2021]
District
Sediment = 1.36-
Southeast 3.52x10⁻³ particles/ [Layn et al.,
Kendari Bay 2020 – –
Sulawesi kg, dominated by 2020]
fragment
Bengkalis
Water = 19.17-
Island Waters, [Febriani et al.,
Riau 2020 – – 80.83x10³ particles/L,
Bengkalis 2020]
dominated by fiber
District
increasing the density and accumulation of MP abundance of 0.10x10⁻³ – 7.47x10⁶ particle/L and
[Andrady, 2011; Barnes et al., 2009; Browne et 0.07x10⁻³ – 38.79x10³ particle/kg. The lowest MP
al., 2011]. It can be seen at the Bengawan Solo abundances for water column and sediment were
River, where the dominance of MP in water col- found in Kupang Bay and Kendari Bay, respec-
umn (fiber) and sediment (fragment) is different. tively. Meanwhile, the highest MP abundance for
If there is no accumulation of unmanaged water and sediment was found in Jakarta Bay,
plastic waste, rivers can act as distribution routes with the predominance of fragments, PP, and PE,
for MP and other pollutants to other waters and which indicated that deposition was caused by
seas, because they are interconnected [Manalu, biofouling.
2017; Stolte et al., 2015]. This is due to the cur- The dominance of MP in Jakarta Bay is similar
rents and water velocity on river of 0.10–0.20 m/s to the findings in DKI Jakarta River-Estuaries of
[Ayuningtyas et al., 2019; Barnes et al., 2009]. It Angke, Baru, and Ciliwung (see Table 2), which
may contributed to the low number of MP in the have proven that rivers are a transport route for
water column and sediments of the Bengawan pollutants. As reported by Manalu [2017] there
Solo River, as sampling was carried out in the was a lot of unmanaged plastic waste at the river-
watershed leading to estuary. estuaries of DKI Jakarta, which might be broken
down into fragments. It was also found in Jagir
Estuary, where 52.30–63.00% of the generated
MICROPLASTIC IN MARINE ECOSYSTEMS domestic waste was not properly managed by the
community and was disposed into rivers, thereby
Table 2 showed that water column and sedi- increasing the abundance of MP in the Suraba-
ment in several bays and estuaries in Indone- ya River [Lestari et al., 2020] and Jagir Estuary
sia have been contaminated by MP, with an [Firdaus et al., 2020] which is dominated by fiber,
133Journal of Ecological Engineering 2021, 22(10), 127–140
film, and PES. The dominance of MP which was and estuaries. These conditions have an impact on
found in several estuaries and bays has shown the deposition and accumulation of plastic waste
that the waste generated from waters utilization and MP in the sediment as an effect of its limited
for marine transportation and aquaculture activi- movement, as those found in Jakarta Bay, Pantai
ties is another source which exacerbates the MP Indah Kapuk and Wonorejo Coast. It also occurs
contamination. in the coral reef cultivation areas as shown in the
Given the existence of currents and tidal Karimun Jawa Marine National Park.
waves in estuary and bay [Bessa et al., 2018], Thus, it can be concluded that the main
both of them have become the entry point for source of MP contamination in water column and
plastic waste or MP from river into the sea [An- sediment of Indonesian Waters is disposal of un-
drady, 2011]. As reported by Andrady [2011], managed domestic waste, especially plastic waste
80.00% of the plastic waste found in the ocean into waters, which is indicated by fragments as
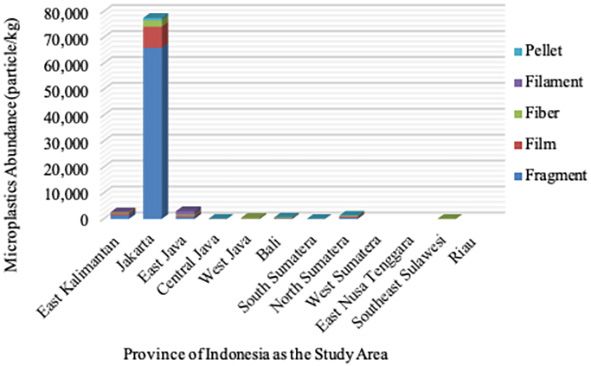
comes from rivers, which generally occur in the dominant MP found (Figure 1). The amount
large rivers [Kama et al., 2021]. Therefore, it is of plastic waste disposal is influenced by the pub-
well-earned that water column and sediment in lic activities around the waters area. As shown in
the beach and the sea are contaminated by MP. Figures 1 and 2, the aquatic environment in Indo-
On the basis of the data obtained, the abundance nesia that are highly contaminated by MP are DKI
of MP in water column and sediment from sev- Jakarta, West Java, and East Java, with an abun-
eral beaches and seas amounts to 1.89x10⁻³ – dance of water and sediment reaching as much
80.83x10³ particles/L and 8.76x10⁻³ – 2.36x10³ as 35.46x10⁶; 2.79x10⁶; 0.52x10⁶ particle/L and
particles/kg, respectively. 77.60x10³; 0.47 x10³; and 3.81x10³ particle/kg,
The highest abundance of MP in seawater col- respectively. These provinces are the areas with
umn was found in Bengkalis Island Waters which the highest population in Indonesia. The classi-
were dominated by fibers and films, followed by fication was carried out using the data with the
Kepetingan and Burau Waters of 57.00–79.80x10³ same unit of measurement for water (particles/L)
particles/L (fragments and films) and 56.20x10³ and sediment (particles/kg), according to Rios
particles/L (fragments), respectively. It is caused Mendoza & Balcer [2019] recommendation.
by high utilization of the waters for marine trans- Moreover, the abundance of MP in waters is
portation, coastal tourism, and aquaculture such influenced by polymer type, pattern and speed of
as seaweed. Especially for Bengkalis Island Wa- distribution. The type of polymer is closely re-
ters, there are also many offshore oil-rigs that may lated to the density and buoyancy of MP in the
cause oil spills during the drilling and distribution waters. The pattern and distribution of MP de-
activities. Meanwhile, the sediment in Pantai In- pends on the direction and flow velocity of cur-
dah Kapuk Coast contains the highest MP, which rents, tidal waves, density, and the geographical
is 0.19–2.36x10³ particles/kg, with film as the characteristics of the waters. In addition, the di-
dominant MP. Pantai Indah Kapuk is connected rection and speed of wind are also the factors that
to the Angke and Cengkareng Drain Estuaries affect the characteristics of currents and waves in
which hold a lot of plastic waste. Moreover, Pan- the waters [Anderson et al., 2016; Andrady, 2011;
tai Indah Kapuk is a densely populated area and Barnes et al., 2009; Bessa et al., 2018; Browne
mangrove cultivation areas [Hastuti et al., 2014]. et al., 2011; Ramírez-Álvarez et al., 2020; Rios
When compared, the abundance of MP based Mendoza & Balcer, 2019; Stolte et al., 2015].
on observation location has shown that bays and
estuaries have higher number of MP than rivers,
beaches, and seas in Indonesia. This is because MICROPLASTIC IN AQUATIC BIOTA
bays and estuaries are meeting points of riv-
ers and seas, so that there are differences in the The MP contamination was not only found in
water density and its location is protected from the water column and sediment, but also in aquat-
waves which inhibit the plastic waste and MP ic biota, especially pelagic and demersal fish of
distribution. The inhibition is also caused by the 2.00–95.65 particles/ind and 1.00–61.5 particles/
geographical characteristics of bays and estuaries ind, respectively (Table 3). The pelagic fish con-
which are the habitats of mangrove, where plastic taining the highest amount of MP was Frigate
waste and MP are trapped in the root areas. Man- tuna from Boron Beach, followed by Anodontos-
groves are also found on the coast close to bays toma chacunda (77.40 particles/ind) and Arius
134Journal of Ecological Engineering 2021, 22(10), 127–140
a)
b)
Figure 1. Microplastic shape in Indonesian waters
maculatus (72.22 particles/ind) that are found in (Jakarta Bay); and Neotrygon annotate (Jakarta
Jakarta Bay and Bengkalis Island Waters. Mean- Bay) with a total of 57.50; 56.00; and 56.00 par-
while, the demersal fish which contains the high- ticles/ind, respectively.
est MP were Nemipterus marginatus (Jakarta The number of MP in two types of fish is
Bay), followed by Japanese threadfin bream influenced by several factors, including habitat,
(Boron Beach); Eleutheronema tetradactylum abundance of MP in the habitat (number and
Figure 2. Distribution of microplastics abundance in aquatic environment of Indonesia
135Journal of Ecological Engineering 2021, 22(10), 127–140
shape), feeding and food habits. Pelagic fish have [Listiani & Nugraha, 2021; Wahdani et al., 2020].
a higher MP because their habitat is in the water The amount of accumulated MP in a shellfish
column, which is an area with a wider distribu- depends on their size, where the larger shellfish
tion of MP than the bottom area of waters that size, the more MP might be accumulated, as
is the habitat of demersal fish. The dominance found in Anadara granosa [Listiani & Nugraha,
of pelagic and demersal fish containing MP was 2021]. The A. granosa on Semarang Beach, with
found in Jakarta Bay, where the water column and a size of less than 3.00 cm, contained 6.00±3.70
sediment were contaminated by as much as 2.88– particles/ind of MP which were dominated by
7.47x10⁶ item/L and 18.41–38.79x10³ particles/ fiber that was similar to the findings in the wa-
kg, respectively. ter column. Meanwhile, the A. granosa from
Small pelagic fish such as A. chacunda, and Kwanyar and Tanjung Tiram Water, with a size of
A. maculatus are classified as filter feeders, that more than 3.00 cm, s contained 20.20–26.80 and
preys on zooplankton through water suction, 20.33–120.00 particles/ind of MP, respectively.
potentially ingesting very small MP at the same In addition, MP was also found in other marine
time [Manalu, 2017]. Zooplankton is also a filter organisms, namely Echinoidea of 22.30 particles/
feeder (Andrady, 2011; Germanov et al., 2019); ind, which was also dominated by fiber.
therefore, very small MP may be consumed and The MP contained by aquatic biota could po-
accumulated in its tissues because there is no en- tentially interfere with the absorption of nutrients,
zymatic reaction of digestion, which is commonly because it is hydrophobic, since hydrocarbons as
known as bio-inert [Andrady, 2011; Carbery et al., polymer plastic constituent are one of the POPs
2018; Fackelmann & Sommer, 2019]. Desforges [Andrady, 2011; Bellasi et al., 2020; Carbery et
et al. [2015] reported that the zooplankton in the al., 2018]. Due to its hydrophobic properties, MP
Northeast Pacific Ocean contains 0.03–0.06 parti- is able to absorb toxic compounds such as poly-
cles/ind with a size of 556.00–816.00 mm. There- chlorinated biphenyls and dioxins from water
fore, small pelagic fish may be affected by double column as well as act as a transporter in the food
consumption of MP. In addition, zooplankton is chain [Engler, 2012].
able to retain MP in its tissues for up to several
hours, then die and accumulate in sediment. This
threat also concerns other organisms at different LONG-TERM HAZARDS POTENTIAL
durations, for instance, crabs are capable of re-
taining MP for to 14 days. Indonesia is one of the largest marine mega
Meanwhile, large pelagic fish showed a high- biodiversity areas in the world, where aquatic bi-
er level of food and feeding habits than small pe- ota become one of the main foods for people, es-
lagic fish which are mostly omnivores preying on pecially those on the coast and islands. On the ba-
detritus, zooplankton, small pelagic fish, insects, sis of these food habits, biomagnification became
and shrimp. Given the shape of elongated fiber is the main process for MP transport to human. MP
similar to that of prey, the fish tend to approach will eventually accumulate in human body tis-
it [Foley et al., 2018] and it may be accidentally sues, especially macrophages that affect metabol-
ingested by large pelagic fish [Andrady, 2011; ic processes due to it is bio-inertness [Anderson et
Yudhantari et al., 2019]. A similar accident due al., 2016; Moore, 2008; Widianarko & Hantoro,
to MP misrecognizing also occurs in demersal 2018]. The MP in the human body may become
fish [Nie et al., 2019] because its feeding habits resistant when accumulation reaches a point of
are carried out by filtering sediment to catch the equilibrium [Fackelmann & Sommer, 2019].
prey [Manalu, 2017]. This is consistent with the The MP in macrophages is adsorbed and mi-
data shown in Table 3, that fiber has been demon- grated to lymph nodes, then translocated to other
strated as dominant MP in fish. The mechanism organs through the blood [Anderson et al., 2016].
suggests that the MP pathway in large pelagic and The MP in the blood is able to replenish proteins
demersal fish is through the trophic transfer and and glycoproteins, which may cause decreased im-
inadvertent ingestion of MP which is similar in munity and intestinal dysbiosis to diarrhea [Card-
appearance to prey. ing et al., 2015; Fackelmann & Sommer, 2019]. It
MP is also found in shellfish at contaminated has been proven by the findings of PP, PS, and PE
waters, because they are one of the filter feed- in human feces [Liebmann et al., 2018]. Further-
ers and also act as hyperaccumulator organisms more, MP may disrupt the reproductive system that
136Journal of Ecological Engineering 2021, 22(10), 127–140
Table 3. Microplastics in Aquatic Biota
Aquatic Organisms Sumber
Province Area
Pelagic Fish Demersal Fish Other Organisms
Eleutheronema
tetradactylum = 56.00
A. chacunda = 42.60– particles/ind
77.40 particles/ind
Neotrygon annotate =
Selar boops = 65.00 56.00 particles/ind,
DKI Jakarta Jakarta Bay – [Manalu, 2017]
particles/ind
Nemipterus marginatus
Shape dominated by = 61.50 particles/ind
fragment
Shape dominated by
fragment
Gili Labak
Echinoidea = 22.30
Island, [Lolodo &
– – particles/ind, yang
Sumenep Nugraha, 2019]
didominasi bentuk fiber
District
Epinephelus = 1.00–
Euthynus = 2.00–5.00
Mandangin 3.00 particles/ind
particles/ind
Island, Nemipterus = 1.00–6.00 [Rahmadhani,
Sardinella lemuru = 3.00– –
Sampang particles/ind 2019]
5.00 item particles/ind
District Shape dominated by
East Java Shape dominated by film
filament
Brondong Priacathus tayenus =
Coast, 13.00–15.33 particles/ind [Labibah &
– –
Lamongan Triajie, 2020]
District Shape dominated by fiber
Kwanyar A. granosa = 20.20–26.80
Waters, particles/ind [Listiani &
– –
Bangkalan Nugraha, 2021]
District Shape dominated by fiber
Chanos chanos = A. granosa = 6.00±3.70
Semarang 3.36±1.02 particles/ind particles/ind [Widianarko &
–
Beach Hantoro, 2018]
Central Shape dominated by fiber Shape dominated by fiber
Java Mugil cephalus = 3.40–
Bengawan 6.40 particles/ind – – [A’yun, 2019]
Solo River
Shape dominated by fiber
Japanese threadfin
Skipjack tuna = bream = 57.50±37.61
Boron Beach, 21.90±11.94 particles/ind particles/ind
[Suwartiningsih
Yogyakarta Gunung Kidul Frigate tuna = Large–scale croaker = –
et al., 2020]
District 95.65±38.80 particles/ind 7.35±4.48 particles/ind
Shape dominated by fiber Shape dominated by
film
S. lemuru = 7.03±0.62
particles/ind, shape
dominated by film
Trichiurus lepturus =
Decapterus russelli =
3.83±1.01 particles/ [Sarasita et al.,
Bali Bali Strait 4.23±1.23 particles/ind, –
ind, shape dominated 2020]
shape dominated fiber
by fiber
Rastrelliger kanagurta =
5.03±0.76 particles/ind,
shape dominated by fiber
Maccini Baji
Waters, V. philippinarum = 1.09–
South [Wahdani et al.,
Pangkajane – – 1.21 particles/ind, shape
Sulawesi 2020]
and Island dominated by fiber
Regency
Bengkalis Arius maculatus = 72.22
particles/ind Harpodon nehereus =
Islands 55.56 particles/ind [Febriani et al.,
Riau Waters, Setipinna breviceps rata– –
2020]
Bengkalis rata = 61.06 particles/ind Shape dominated by
District fiber
Shape dominated by fiber
Tanjung
A. granosa = 20.33–
Tiram [Tuhumury &
Maluku – – 120.00 particles/ind,
Waters, Ritonga, 2020]
dominated by fiber
Ambon Bay
137Journal of Ecological Engineering 2021, 22(10), 127–140
affect the development of sex cells, embryos, hor- compounds and cause various organ dysfunction
mone production, and organ dysfunction [Carding for aquatic biota and humans.
et al., 2015; Fackelmann & Sommer, 2019] which Therefore, further research about quantifica-
could potentially affect pregnant women and chil- tion of MP abundance (amount, size, and polymer
dren. As reported by Ragusa et al. [2021], 3 par- type) in public water sources and determination
ticles of MP-fragments were found in the placenta of the permissible MP abundance limit are ur-
with the size of 5.00–10.00 mm. gently needed to reduce the health risk potential.
Organ dysfunction is a dangerous health prob- Therefore, the role of government and society in
lem that causes systemic inflammation and growth managing waste is very important to reduce the
hormone resistance of IGF-1. Systemic inflamma- plastic waste disposal in the waters.
tion may also cause anemia, which has been a trigger
for stunting [Prendergast et al., 2015]. This condi- Acknowledgments
tion may be closely related to the high prevalence
The authors gratefully acknowledge to Insti-
of stunting in Indonesia, reaching 30.80% in 2018
tute of Research and Community Service Uni-
[Budiastutik & Rahfiludin, 2019; Rahmawati et al.,
versitas Singaperbangsa Karawang for the grant
2020], especially in coastal areas. Although the as-
which made this research work.
sociation between the MP exposure to interference
above has not been proven, but the potential of long-
term effects needs to be the focus of attention. There- REFERENCE
fore, a further study of translocation, retention time,
and accumulation of MP in humans is needed to de- 1. Addauwiyah R. 2021. A Study of Distribution and
termine the potential threat and prevention strategies. Mapping of Microplastics in Deli River Sediment,
Medan. Bachelor Thesis, Universitas Sumatera
Utara, Medan (in Bahasa).
2. Ahmad. 2018. Identification and Distribution of the
CONCLUSIONS Microplastics at Sediments in the Musi River Flow and
Estuary of South Sumatra Province. Bachelor Thesis,
Universitas Sriwijaya, Palembang (in Bahasa).
There is no doubt that MP was found in all
3. Alam F.C., Rachmawati M. 2020. Development of
elements of aquatic ecosystems in Indonesia of Microplastic Research in Indonesia. Jurnal Presipi-
water column, sediment, as well as aquatic biota tasi, 17(3), 344–352.
such as fish and shellfish. Great abundance of MP 4. Alam F.C., Sembiring E., Muntalif B.S., Suendo
was found in the areas with high population and V. 2019. Microplastic distribution in surface water
and sediment river around slum and industrial area
activity, thereby increasing the domestic waste dis- (case study: Ciwalengke River, Majalaya district,
posal to the river which is one of the sources of Indonesia). Chemosphere, 224, 637–645.
MP in aquatic ecosystem. The distribution of MP 5. Aliabad M.K., Nassiri M., Kor K. 2019. Microplas-
in the waters was influenced by the type of poly- tics in the surface seawaters of Chabahar Bay, Gulf
of Oman (Makran Coasts). Marine Pollution Bul-
mer (density), geographical conditions and the hy- letin, 143, 125–133.
drodynamic characteristics of waters. The results 6. Anderson J.C., Park B.J., Palace V.P. 2016. Micro-
showed that the highest abundance of MP in In- plastics in aquatic environments: Implications for
donesia was found in water column, followed by Canadian ecosystems. Environmental Pollution,
218, 269–280.
accumulation in sediment and aquatic biota. The
7. Andrady A.L. 2011. Microplastics in the marine
abundance of MP was dominated by fragments. environment. Marine Pollution Bulletin, 62(8),
MP is able to penetrate the food chain through 1596–1605.
the food-feeding habits of organisms. In fish, MP 8. A’yun N.Q. 2019. Microplastics Analysis using FT-
is transported through trophic transfer, which led IR for Water, Sediment, and Belanak Fish (Mugil
cephalus) on Bengawan Solo River Segment. Bach-
to biomagnification and ended up being accumu- elor Thesis, Universitas Islam Negeri Sunan Ampel
lated in human tissues. The MP in human tissues Surabaya, Surabaya (in Bahasa).
may be also caused by water consumption, con- 9. Ayuningtyas W.C., Yona D., Julinda S.S.H.,
sidering the MP contamination in many public Iranawati F. 2019. Microplastics Abundance on
Banyuurip Surface Water, Gresik, East Java. Jour-
water sources in Indonesia. Since MP is hydro- nal of Fisheries and Marine Research, 3(1), 41–45.
phobic and able to bind other toxic organic com- 10. Azizah P., Ridlo A., Suryono C.A. 2020. Microplas-
pounds, they have the potential to transmit such tics on Marine Sediment at Kartini Coastal Area,
138Journal of Ecological Engineering 2021, 22(10), 127–140
Jepara District, Central Java. Journal of Marine Re- 26. Foley C.J., Feiner Z.S., Malinich T.D., Höök T.O.
search, 9(3), 326–332. 2018. A meta-analysis of the effects of exposure to
11. Barnes D.K.A., Galgani F., Thompson R.C., Barlaz microplastics on fish and aquatic invertebrates. Sci-
M. 2009. Accumulation and fragmentation of plastic ence of the Total Environment, 631–632, 550–559
debris in global environments. Philosophical Trans- 27. Germanov E.S., Marshall A.D., Hendrawan I.G.,
actions of the Royal Society B: Biological Sciences, Admiraal R., Rohner C.A., Argeswara J., Wulandari
364(1526), 1985–1998. R., Himawan M.R., Loneragan N.R. 2019. Micro-
12. Bellasi A., Binda G., Pozzi A., Galafassi S., Volta plastics on the Menu: Plastics Pollute Indonesian
P., Bettinetti R. 2020. Microplastic contamination Manta Ray and Whale Shark Feeding Grounds.
in freshwater environments: A review, focusing on Frontiers in Marine Science, 6(679). 1–66.
interactions with sediments and benthic organisms. 28. Harahap A.R. 2021. A Study of Distribution and
Environments, 7(4), 1–27. Mapping of Microplastics in Sei Babura and Sei
13. Bessa F., Barría P., Neto J.M., Frias J.P.G.L., Otero Sikambing River, Medan. Bachelor Thesis, Univer-
V., Sobral P., Marques J.C. 2018. Occurrence of sitas Sumatera Utara, Medan (in Bahasa).
microplastics in commercial fish from a natural 29. Hastuti A.R., Yulianda F., Wardiatno Y. 2014. Spa-
estuarine environment. Marine Pollution Bulletin, tial distribution of marine debris in mangrove eco-
128, 575–584. system of Pantai Indah Kapuk, Jakarta. Bonorowo
14. Browne M.A., Crump P., Niven S.J., Teuten E., Wetlands, 4(2), 94–107 (in Bahasa).
Tonkin A., Galloway T., Thompson R. 2011. Accu- 30. Hiwari H., Purba N.P., Ihsan Y.N., Yuliadi L.P.S.,
mulation of microplastic on shorelines worldwide: Mulyani P.G. 2019. Condition of microplastic gar-
Sources and sinks. Environmental Science and bage in sea surface water at around Kupang and
Technology, 45(21), 9175–9179. Rote, East Nusa Tenggara Province. Prosiding Sem-
inar Nasional Masyarakat Biodiversitas Indonesia
15. Budiastutik I. & Rahfiludin M.Z. 2019. Risk Factors 5(2), 165–171.
of Child Stunting in Developing Countries. Amerta
Nutrition, 3(3),122–126 (in Bahasa). 31. Hossain M.S., Sobhan F., Uddin M.N., Sharifuz-
zaman S.M., Chowdhury S.R., Sarker S., Chow-
16. Carbery M., O’Connor W., Palanisami T. 2018. Tro- dhury M.S.N. 2019. Microplastics in fishes from
phic transfer of microplastics and mixed contaminants the Northern Bay of Bengal. Science of the Total
in the marine food web and implications for human Environment, 690, 821–830.
health. Environment International, 115, 400–409.
32. Jambeck J.R., Geyer R., Wilcox C., Siegler T.R.,
17. Carding S., Verbeke K., Vipond D.T., Corfe B.M., Perryman M., Andrady A., Narayan R., Law K.L.
Owen L.J. 2015. Dysbiosis of the gut microbiota in 2015. Plastic waste inputs from land into the ocean.
disease. Microbial Ecology in Health & Disease, Science, 347(6223), 768–771.
26(1), 1–9.
33. Joesidawati M.I. 2018. Microplastics Pollution
18. Caruso G. 2019. Microplastics as vectors of con- around the Beach of Tuban Regency. Prosiding
taminants. Marine Pollution Bulletin, 146, 921–924. Seminar Nasional Hasil Penelitian dan Pengabdian
19. Desforges J.P.W., Galbraith M., Ross P.S. 2015. Kepada Masyarakat III, 8–15.
Ingestion of Microplastics by Zooplankton in the 34. Kama N.A., Rahim S.W., Yaqin K. 2021. Microplas-
Northeast Pacific Ocean. Archives of Environmen- tic concentration in column seawater compartment
tal Contamination and Toxicology, 69(3), 320–330. in Burau, Luwu Regency, South Sulawesi, Indone-
20. Dewi I.S., Budiarsa A.A., Ritonga I.R. 2015. Dis- sia. IOP Conference Series: Earth and Environmen-
tribution of microplastic at sediment in the Muara tal Science, 763(1), 1–7.
Badak Subdistrict, Kutai Kartanegara Regency. DE- 35. Kapo F.A., Toruan L.N.L., Paulus C.A. 2020. The
PIK, 4(3), 121–131 (in Bahasa). Types and Abundance of Microplastics in Surface Wa-
21. Engler R.E. 2012. The complex interaction between ter at Kupang Bay. Jurnal Bahari Papadak, 1(1), 10–21.
marine debris and toxic chemicals in the ocean. 36. Labibah W., Triajie H. 2020. The Presence of Mi-
Environmental Science and Technology, 46(22), croplastics in Swanggi Fish (Priacanthus tayenus),
12302–12315. Sediments and Sea Water in the Coastal Waters of
22. Fackelmann G., Sommer S. 2019. Microplastics and Brondong, Lamongan Regency. Juvenil: Jurnal Il-
the gut microbiome: How chronically exposed spe- miah Kelautan Dan Perikanan, 1(3), 351–358.
cies may suffer from gut dysbiosis. Marine Pollution 37. Layn A.A. & Emiyarti Ira. 2020. Distribution Mi-
Bulletin, 143, 193–203. croplastic at Sediment in the Kendari Bay. Sapa
23. Febriani I.S., Amin B., Fauzi M. 2020. Distribution Laut, 5(2), 115–122.
of microplastic in water of Bengkalis Island of Riau 38. Lestari P., Trihadiningrum Y., Wijaya B.A., Yunus
Province. DEPIK, 9(3), 386–392 (in Bahasa). K.A., Firdaus M. 2020. Distribution of microplas-
24. Firdaus M., Trihadiningrum Y., Lestari P. 2020. tics in Surabaya River, Indonesia. Science of the
Microplastic pollution in the sediment of Jagir Es- Total Environment, 726, 1–9.
tuary, Surabaya City, Indonesia. Marine Pollution 39. Liebmann B., Köppel S., Königshofer P., Bucsics T.,
Bulletin, 150, 1–9. Reiberger T., Schwabl P. 2018. Assessment of Micro-
25. Firmansyah M.D. 2021. Microplastics Analysis of plastics Concentrations in Human Stool: Final Results
Sediment, Water, and White Kupang (Corbula faba of A Prospective Study. Conference on Nano and Mi-
Hinds) in Kepetingan, Sidoarjo, East Java. Bach- croplastics in Technical and Freshwater Systems.
elor Thesis, Universitas Islam Negeri Sunan Ampel 40. Listiani N.W. & Nugraha A. 2021. Microplastic
Surabaya, Surabaya (in Bahasa). in Different Size of Cockle (Anadara granosa) at
139Journal of Ecological Engineering 2021, 22(10), 127–140
Kwanyar Waters, Bangkalan District, Madura. Jur- 55. Rios Mendoza L.M., Balcer M. 2019. Microplastics
nal Sumberdaya Akuatik Indopasifik, 5(2), 169–180. in freshwater environments: A review of quantifi-
41. Lodo Pe E.O., Mashar A., Taryono, Wardiatno Y. cation assessment. Trends in Analytical Chemistry,
2020. Microplastic distribution and abundance in 113, 402–408.
Cimandiri Watershed flowing to Palabuhan Ratu 56. Sarasita D., Yunanto A., Yona D. 2020. Microplas-
Bay, Sukabumi, West Java, Indonesia. AACL Bio- tics Abundance in Four Different Species of Com-
flux, 13(2), 657–668. mercial Fishes in Bali Street. Jurnal Iktiologi Indo-
42. Lolodo D., Nugraha W.A. 2019. Microplastics on nesia, 20(1), 1–12.
Sea Urchine from Sumenep Labak Gilis Islands. 57. Sarkar D.J., das Sarkar S., Das B.K., Manna R.K.,
Jurnal Kelautan, 12(2), 112–122 (in Bahasa). Behera B.K., Samanta S. 2019. Spatial distribution
43. Manalu A.A. 2017. Microplastic Abundance in Ja- of meso and microplastics in the sediments of river
karta Bay. Master Thesis, IPB University, Bogor (in Ganga at eastern India. Science of the Total Envi-
Bahasa). ronment, 694, 1–7.
44. Mauludy M.S., Yunanto A., Yona D. 2019. Micro- 58. Septian F.M., Purba N.P., Agung M.U.K., Yulia-
plastic abundances in the sediment of coastal beach- di, Lintang P.S., Akuan L.F., Mulyani P.G. 2018.
es in Badung, Bali. Jurnal Perikanan Universitas Microplastics Spatial Distribution in Sediment at
Gadjah Mada, 21(2), 73–78 (in Bahasa). Pangandaran Beach, West Java. Jurnal Geomaritim
Indonesia, 1(1), 1–8.
45. Moore C.J. 2008. Synthetic polymers in the marine
environment: A rapidly increasing, long-term threat. 59. Stolte A., Forster S., Gerdts G., Schubert H. 2015.
Environmental Research, 108(2), 131–139. Microplastic concentrations in beach sediments
along the German Baltic coast. Marine Pollution
46. Muchlissin S.I., Widyananto P.A., Sabdono A., Bulletin, 99(1–2), 216–229.
Radjasa O.K. 2020. The abundance of microplas-
tics in coral reef ecosystem sediments in Karimun- 60. Suwartiningsih N., Setyowati I., Astuti R. 2020. Micro-
jawa Marine National Park. Jurnal Kelautan Tropis, plastics in Pelagic and Demersal Fishes of Pantai Baron,
24(1), 1–6 (in Bahasa). Yogyakarta, Indonesia. Jurnal Biodjati, 5(1), 33–49.
47. Nie H., Wang J., Xu K., Huang Y., Yan M. 2019. 61. Tuhumury N. & Ritonga A. 2020. Identification of
Microplastic pollution in water and fish samples Existance and Type of Microplastics in Cockle at
around Nanxun Reef in Nansha Islands, South Tanjung Tiram Waters, Ambon Bay. TRITON: Ju-
China Sea. Science of the Total Environment, 696. rnal Manajemen Sumberdaya Perairan, 16(1), 1–7.
48. Nugroho D.H., Restu I.W., Ernawati N.M. 2018. A 62. Wahdani A., Yaqin K., Rukminasari N., Suwarni,
Study of Microplastics Abundance in Benoa Bay, Nadiarti, Dwi F.I., Fachruddin L. 2020. Micro-
Bali. Current Trends in Aquatic Science, 1(1), 80–90. plastics concentration on Manila Clam Venerupis
philippinarum in Maccini Baju Waters, Labakkang
49. Prendergast A.J., Humphrey J.H., Mutasa K., District, Pangkajene Kepulauan Regency, South
Majo F.D., Rukobo S., Govha M., Mbuya M.N.N., Sulawesi. Maspari Journal, 12(2), 1–13 (in Bahasa).
Moulton L.H., Stoltzfus R.J. 2015. Assessment of
environmental enteric dysfunction in the SHINE 63. Wang W., Ndungu A.W., Li Z., Wang J. 2017. Micro-
Trial: Methods and challenges. Clinical Infectious plastics pollution in inland freshwaters of China: A
Diseases, 61, 726–732. case study in urban surface waters of Wuhan, China.
Science of The Total Environment, 575, 1369–1374.
50. Rachmat S.L.J., Purba N.P., Agung M.U.K., Yuliadi
L.P.S. 2019. Characteristic of microplastic debris at 64. Widianarko B. & Hantoro I. 2018. Microplastics in
estuary of DKI Jakarta. DEPIK, 8(1), 9–17. seafood from north coast of Java. Universitas Kato-
lik Soegijapranata, Semarang (in Bahasa).
51. Ragusa A., Svelato A., Santacroce C., Catalano P.,
Notarstefano V., Carnevali O., Papa F., Rongio- 65. Wijaya B.A. & Trihadiningrum Y. 2019. Meso- and
letti M.C.A., Baiocco F., Draghi S., D’Amore E., Microplastics Pollution in Surabaya River on Dri-
Rinaldo D., Matta M., Giorgini E. 2021. Plasticenta: yorejo to Karang Pilang Segment. Jurnal Teknik
First evidence of microplastics in human placenta. ITS, 8(2), 211–216.
Environment International, 146, 1–8. 66. Yolla. 2020. Types and density of microplastic in
52. Rahmadhani F. 2019. Identification and analysis of the coastal area of the Naras Hilir Village, Pariaman
microplastics on pelagic and demersal fish, sedi- City, West Sumatera Province. Bachelor Thesis,
ment, and sea water in Mandangin Islands, Sampang Universitas Riau, Pekanbaru (in Bahasa).
District. Bachelor Thesis, Universitas Islam Negeri 67. Yona D., Prikah F.A., di As’adi M.A. 2020. Identifi-
Sunan Ampel Surabaya, Surabaya (in Bahasa). cation and Comparison of Plastic Waste Abundance
53. Rahmawati N.F., Fajar N.A., Idris H. 2020. Social, based on Size in Several Beach Sediment at Pa-
economic factors, and utilization of posyandu to- suruan District, East Java. Jurnal Ilmu Lingkungan,
wards stunting among toddlers of poor families of 18(2), 375–383.
PKH recipients in Palembang. Jurnal Gizi Klinik 68. Yudhantari C.I.A.S., Hendrawan I.G., Puspitha
Indonesia, 17(1), 23–33 (in Bahasa). N.L.P.R. 2019. Microplastics in Digestive Tract of
54. Ramírez-Álvarez N., Rios Mendoza L.M., Macías- Protolan Lemuru Fish (Sardinella Lemuru) in Bali
Zamora J.V., Oregel-Vázquez L., Alvarez-Aguilar Strait. Journal of Marine Research and Technology,
A., Hernández-Guzmán F.A., Sánchez-Osorio J.L., 2(2), 47–51.
Moore C.J., Silva-Jiménez H., Navarro-Olache L.F. 69. Zhu L., Wang H., Chen B., Sun X., Qu K., Xia B.
2020. Microplastics: Sources and distribution in sur- 2019. Microplastic ingestion in deep-sea fish from
face waters and sediments of Todos Santos Bay, Mex- the South China Sea. Science of the Total Environ-
ico. Science of the Total Environment, 703, 1–46. ment, 677, 493–501.
140You can also read