An Introduction to the Economy of Alaska - Gunnar Knapp Professor of Economics Institute of Social and Economic Research University of Alaska ...

Page created by Sheila Rodgers
 
CONTINUE READING
An Introduction to the Economy of Alaska - Gunnar Knapp Professor of Economics Institute of Social and Economic Research University of Alaska ...
An Introduction to the Economy of Alaska

                Gunnar Knapp
            Professor of Economics
 Institute of Social and Economic Research
        University of Alaska Anchorage
                February 2012

                                             1
An Introduction to the Economy of Alaska - Gunnar Knapp Professor of Economics Institute of Social and Economic Research University of Alaska ...
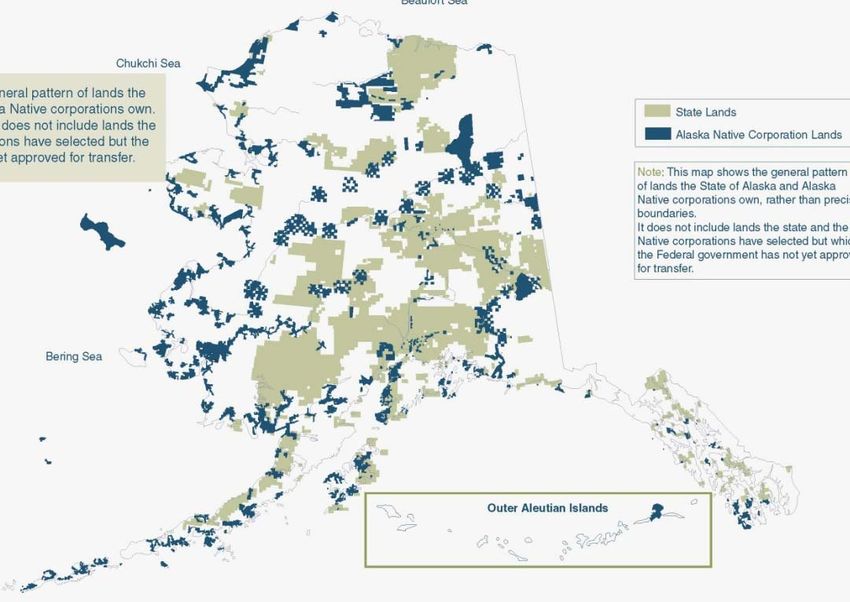
There are important economic differences
                     between different regions of Alaska.

  Alaska is a very large state. It is useful to think of Alaska in terms of six major
  regions: Southeast, Southcentral, Interior, Arctic, Northwest, and Southwest.
     These regions differ significantly with respect to their climate and natural
    resources—which contribute to significant differences in their economies.

    One of the main things that different regions of Alaska have in common
economically—whether they are remote busy villages or Anchorage—is their high
             level of dependence on State and federal spending.

                                          Arctic

                        Northwest
                                                     Interior

                                                           Southeast
                          Southwest
                                            Southcentral
                                                                                        2
An Introduction to the Economy of Alaska - Gunnar Knapp Professor of Economics Institute of Social and Economic Research University of Alaska ...
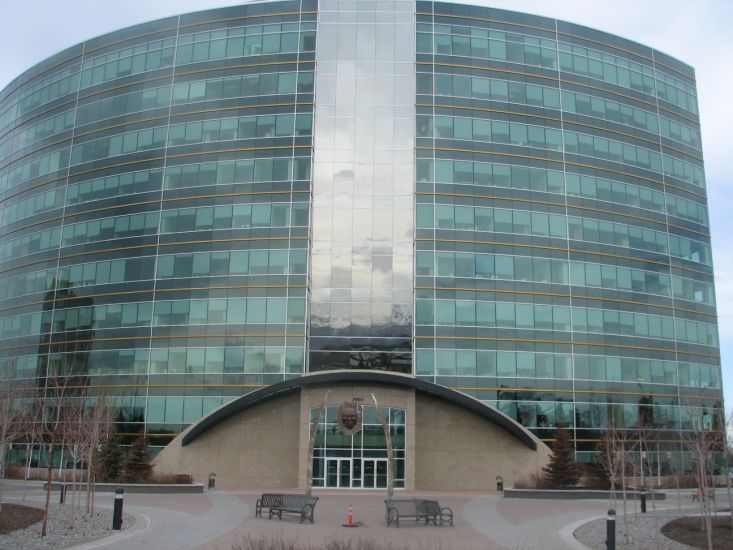
Alaska’s geography creates and constrains
                            opportunities for Alaska’s economy.

Alaska’s geography—its location, climate, topography, and resources—have driven Alaska’s
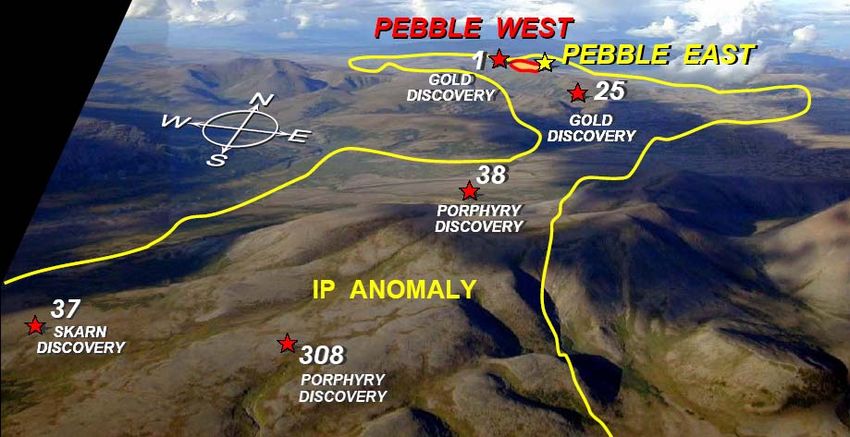
        economy in the past and define and constrain its opportunities for the future.

  Alaska has abundant natural resources—oil, minerals, forests, fish. In the twentieth and
twenty-first centuries, Alaska’s strategic location has contributed to the role of the military and
   more recently the international air cargo industry. Another Alaska natural resource--its
             natural beauty—represents an increasingly important natural resource.

 But Alaska’s remoteness from major markets, cold climate, mountainous topography, and
permafrost make Alaska a costly place to extract resources compared with other parts of the
                                          world.

      In areas with permafrost, buildings like this facility at Prudhoe Bay need to be built on
                  pilings to keep the permafrost underneath them from melting.                    3
An Introduction to the Economy of Alaska - Gunnar Knapp Professor of Economics Institute of Social and Economic Research University of Alaska ...
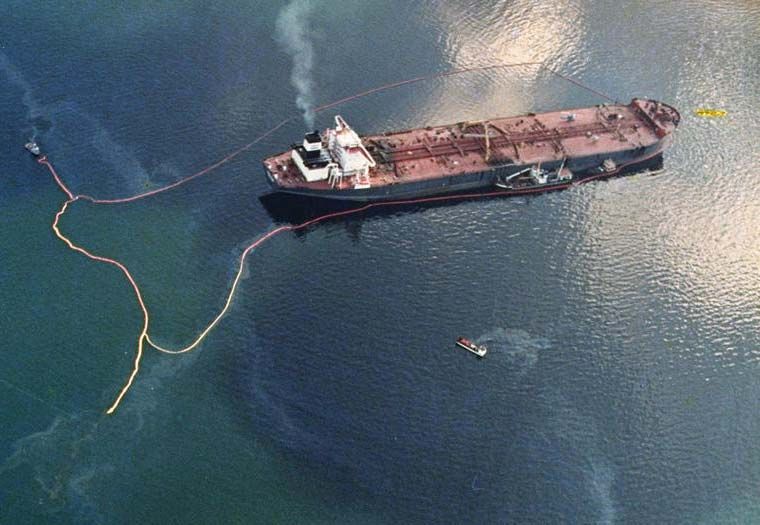
Alaska resource development—and                  Alaska Land Ownership
 who benefits from it—is driven by
land ownership and the priorities of         Federal government          59%
           land owners.                      State government            28%
 Almost all land in Alaska is owned by       Native corporations*        12%
   the federal government, the state         Other owners                 1%
 government, or Native corporations.
                                            *Native corporations were created by the
   Different federal and state lands are     Alaska Native Claims Settlement Act of
   managed by different agencies with           1971. The shareholders of these
      different priorities ranging from         corporations are Alaska Natives.
    preserving lands as wilderness to
developing resources such as oil, timber
 and minerals. About 40% of Alaska is                                    Federal lands
 in federal conservation systems where                                      (white)
                                                                          State lands
   resource development is somewhat
                                                                             (grey)
restricted. About 15% is in “wilderness”                                 Native lands
    where all resource development is                                        (blue)
                 restricted.

   Except on Native lands, almost any
kind of resource development in Alaska
  involves dealing with federal or state
 landowners. Native corporations also
    vary in their priorities for resource
               development.                                                              4
An Introduction to the Economy of Alaska - Gunnar Knapp Professor of Economics Institute of Social and Economic Research University of Alaska ...
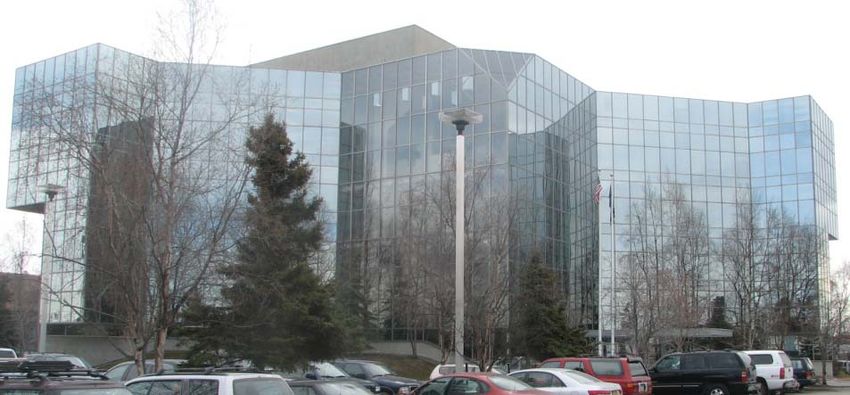
Alaska’s population is about 710,000.

Alaska ranks 47th among U.S. States in population. Alaska’s population is about 1/5 of
Oregon’s, 1/10 of Washington’s, and 1/50 of California’s. Alaska’s population is about
               the same as that of the Akron, Ohio metropolitan area.

     Alaska’s population compared
                                                           Alaska’s population compared with
           with other states
                                                              selected metropolitan areas
   California                              37 million      New York, NY             19 million
   Washington                             6.7 million      Seattle, WA              3.4 million
   Oregon                                 3.8 million      Akron, OH             703 thousand

   Maine                                  1.3 million      Alaska                710 thousand

   Montana                           989 thousand            Alaska’s population compared
                                                                with selected countries
   Alaska                            710 thousand
                                                            Finland              5.2 million
   Vermont                           626 thousand
                                                            Norway               4.7 million
   Wyoming                           564 thousand           Alaska            710 thousand
Source: Statistical Abstract of the United States, 2012.    Iceland           309 thousand
      Data are estimated populations for 2010.
                                                                                                  5
An Introduction to the Economy of Alaska - Gunnar Knapp Professor of Economics Institute of Social and Economic Research University of Alaska ...
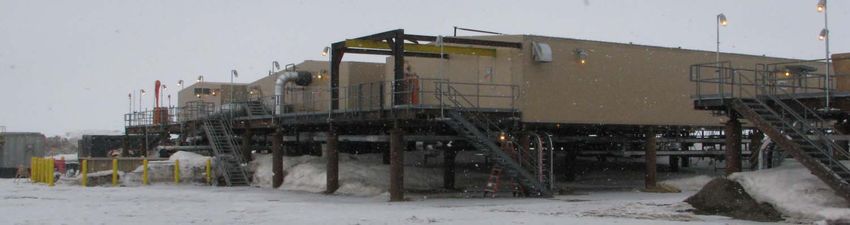
Alaska’s population has grown dramatically since World War II.
  Alaska’s population grew rapidly from about 100,000 just after WWII to
  about 225,000 at Statehood in 1959, about 550,000 in 1986 and about
      710,000 today. Growth has been slower since the mid-1990s.

                                            Total Alaska Population
800,000
                                                                                                 710,000 in 2010
700,000

600,000                    551,000 at peak of state spending boom in 1986

500,000
                  418,000 at completion of the pipeline in 1977

400,000

300,000

200,000                             224,000 at Statehood in 1959
                                                                                Source: Alaska Department of Labor
                                                                                   and Workforce Development,
100,000
                 103,000 one year after WWII in 1946                            Research & Analysis, Demographics
                                                                                               Unit.
     0
                    1950

                             1955

                                    1960

                                                         1975

                                                                  1980

                                                                         1985

                                                                                          1995

                                                                                                  2000

                                                                                                          2005
          1945

                                           1965

                                                  1970

                                                                                  1990

                                                                                                                 2010
                                                                                                                        6
An Introduction to the Economy of Alaska - Gunnar Knapp Professor of Economics Institute of Social and Economic Research University of Alaska ...
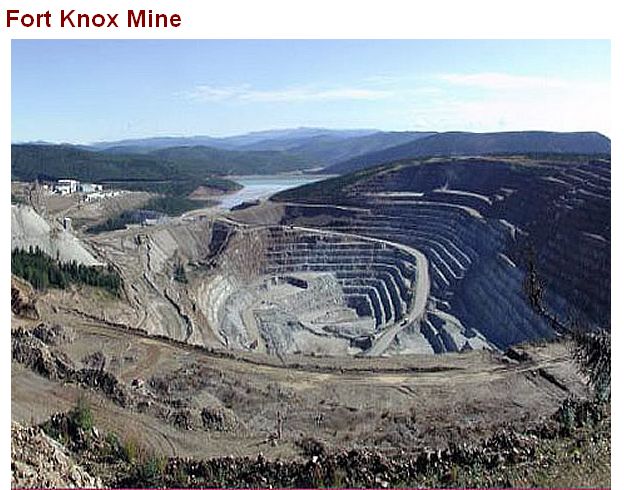
Natural increase and migration drive changes in Alaska’s population.

  Alaska population change is the combined result of natural increase (births minus deaths) and net
 migration (people moving in minus people moving out.) Alaska’s rapid population growth during the
1970s and early 1980s was driven by net in-migration: people moving to Alaska. The history of booms
    and busts in Alaska’s economy can be seen by periods of net in-migration and periods of net-
   outmigration. Since the 1990s most of the growth in Alaska’s population has been due to natural
                                              increase.

                                                                                                      7
An Introduction to the Economy of Alaska - Gunnar Knapp Professor of Economics Institute of Social and Economic Research University of Alaska ...
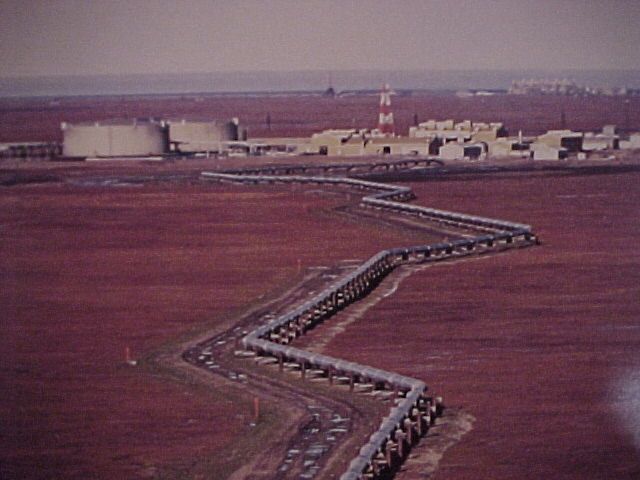
There is no single or best way to measure or describe Alaska’s
              economy. Two frequently-used measures are:

•   Employment: How many people are employed. Employment in Alaska is
    highly seasonal (many more people are employed in the summer than in the
    winter), so employment numbers are typically reported as annual average
    employment. Note that the state’s official employment data don’t count
    several important kinds of work, including people who are self-employed,
    commercial fishermen (who are technically paid a share of their boat’s catch
    and are considered self-employed), and people engaged in unpaid work at
    home (cooking, cleaning, child care, gardening, mowing the lawn) or in
    subsistence hunting and fishing.

•   Gross State Product (GSP): The estimated value of all goods and services
    produced in Alaska by the market sector of the economy.* The market sector
    of the economy is the part in which people work for pay. So Gross State
    Product (GSP) includes the value of what people produce in their paid work,
    but it excludes the value of unpaid work and subsistence hunting and fishing.

    *Technically, Gross State Product (GSP) is calculated as the total value of goods and services
    produced in Alaska, minus the cost of inputs purchased from outside Alaska.
                                                                                                     8
An Introduction to the Economy of Alaska - Gunnar Knapp Professor of Economics Institute of Social and Economic Research University of Alaska ...
Total Alaska wage and salary employment is about 350,000.

 Total wage and salary employment has more than tripled since statehood, when employment was
 less than 100,000. There have been two periods when employment grew very rapidly: during the
construction of the Trans-Alaska Pipeline (1974-77) and during the state spending boom of the early
   1980s. Each of these periods was followed by a recession during which employment declined.
    Alaska employment growth slowed to almost zero after the national recession began in 2008.
About 50,000 people are self-employed in Alaska (working for themselves in their own businesses).
 This includes commercial fishermen, who are not counted in regular wage and salary employment
                                               data.
                                                  Estimated Total Alaska Employment
            500,000
                               Pipeline                      State
                                                                                                                                 Self-
            450,000          construction                  spending                                                              Employment
                                boom,                     boom, early                                                            (including
            400,000                                         1980s                                                                Fishing)
                               1974-77
            350,000
                                                                                                                                 Wage and
            300,000                                                                                                              Salary
                                                                                                                                 Employment
            250,000                                                                                             Global
                                                                                                              financial
            200,000                                                                                            crisis &      Note: Estimates are
                                                                                                                              for average annual
                                                                                                              national
            150,000                                                                                                               employment;
                                                                                                             recession         summer seasonal
                                                              Alaska recession
            100,000                        End of                                                                                employment is
                                                               after oil prices
                                           pipeline                                                                           higher. Estimates
                                                              crashed in 1986                                                   include both full-
             50,000                         boom
                                                                                                                              time and part-time
                                                                                                                                  employment.
                 0
                      1969

                                    1975

                                           1978

                                                   1981

                                                            1984

                                                                   1987

                                                                          1990

                                                                                 1993

                                                                                               1999

                                                                                                      2002

                                                                                                               2005

                                                                                                                      2008
                             1972

                                                                                        1996

                                    Source: Bureau of Economic Analysis Estimates
                                                                                                                                                     9
An Introduction to the Economy of Alaska - Gunnar Knapp Professor of Economics Institute of Social and Economic Research University of Alaska ...
Employment in Alaska’s biggest industries
               is measured in the tens of thousands of jobs.

  A quick indication of how “big” or significant an industry or project is for the
Alaska economy is to look at how many people it employs. Job numbers in the
  tens of thousands are very big. Job numbers in the thousands are big. Job
numbers in the hundreds are not very significant relative to the total economy.

                             Alaska Employment* in 2007:
                                 Relative Magnitudes
                   Total Alaska employment*                   348,000
                   Local government                             38,400
                   Retail trade                                 36,000
                   Fishing                                       7,300
                   Seafood processing                            9,200
                   Air transportation                            6,300
                   Mining employment (excl. oil & gas)           2,000
                   Wood products manufacturing                     400

           *Note: Total includes estimated uniformed military and commercial fishing
                employment. Data are “annual average” employment; seasonal
            employment may be much higher in industries such as fish processing.
                                                                                       10
Alaska’s Gross State Product* was about $48 billion in 2008.

   A quick indicator of how “big” or significant a dollar value is for the Alaska
  economy is to compare it with the size of total Gross State Product. Dollar
values in the billions or hundreds of millions are “big.” Dollar values in the tens
 of millions or millions are much less significant relative to the total economy.

The Scale of Alaska’s Economy in Dollars: Some Relative Magnitudes
Alaska Gross State Product (GSP)                              2008                $47.9 billion
Market Value of Alaska Permanent Fund                         1/1/10              $35.2 billion
Total Alaska employee compensation                            2007                $20.2 billion
Value of Alaska oil production                                FY09                $15.8 billion
Total federal spending in Alaska                              FY08                  $9.4 billion

    A million is NOT the same as a billion!!! A billion is 1000 million!
                          1,000,000 = 1 million
                        1,000,000,000 = 1 billion

     *Gross State Product (GSP) is the total value of goods and services produced in Alaska,
                    minus the cost of inputs purchased from outside Alaska.
                                                                                                   11
Alaska Employment: Oil Industry & Retail Trade

                                                      Oil industry          Retail trade                            The relative importance of different
50,000
                                                                                                                     industries to Alaska’s economy
45,000
                                                                                                                     depends on how you measure it.
40,000

35,000                                                                                                                 Different measures give different
30,000                                                                                                                pictures of the structure of Alaska’s
25,000
                                                                                                                    economy and the relative importance of
20,000
                                                                                                                              different industries.
15,000

10,000
                                                                                                                      These two graphs show employment
            5,000
                                                                                                                          and Gross State Product in two
                          0
                                  2000     2001      2002          2003        2004         2005    2006    2007
                                                                                                                        important Alaska industries: the oil
                                                              Source: BEA employment data                              industry and the retail trade industry
                                                                                                                    (stores). Look at the dramatic difference!
                                   Alaska Gross State Product: Oil Industry & Retail Trade

                                                    Oil industry               Retail trade                           The retail trade industry employs far
                        14,000                                                                                       more people than the oil industry. But
                        12,000                                                                                         the oil industry creates much more
                                                                                                                                       value!
                        10,000
millions of current $

                         8,000                                                                                      Also, note how the value created by the
                         6,000                                                                                      oil industry increased dramatically from
                                                                                                                     2001 to 2007. We weren’t producing
                         4,000
                                                                                                                    more oil (production was declining!) But
                         2,000                                                                                      oil prices were increasing—so the value
                              0                                                                                            of production was increasing.
                                    2000     2001      2002         2003         2004        2005    2006    2007
                                                                    Source: BEA GSP data

                                                                                                                                                                 12
Alaska’s economy may be divided into basic and support industries.

         Basic and support industries are driven by different factors and grow or decline
                                     for different reasons.

Basic industries bring money into Alaska.      Support industries depend on spending of
                                                  Alaska businesses and residents.
   Oil and seafood are basic industries
  because they sell products to markets             Retail trade, services, and local
    outside Alaska. Tourism is a basic             government are support industries.
industry because tourists spend money in
  Alaska. The federal government is a            Support industries are driven by basic
    basic industry because the federal          sector income, and also by the extent to
  government spends money in Alaska.            which Alaskans spend money in Alaska
                                                rather than Outside. Economists say the
 Basic industries are affected by factors        basic income is “multiplied” as it is re-
  such as resource abundance, world                 spent within the Alaska economy,
market conditions, competition from other          generating support income. As the
 regions, federal spending, and federal           Alaska economy grows, the share of
and state resource management policies.          money which is spent in Alaska grows,
                                                   causing the support sector to grow.

  There are two ways the Alaska economy can grow: by growing basic industries, or
    by increasing the “multiplier” so that support industries grow. Much of Alaska’s
   growth over the past four decades has been in support industries, and has come
                             from increasing the multiplier.
                                                                                             13
Since statehood, most of Alaska’s growth has been in support industries
                                                                                      —particularly services.

                                       Since Alaska became a state in 1959, total employment in “traditional basic industries” (federal
                                       government, fishing, oil and gas, mining, & forest products) has changed very little. Almost all
                                       employment growth has been in “support industries”—particularly state and local government,
                                         trade and services. Part of the growth has come from “new basic industries”—particularly
                                       tourism and air cargo—which are difficult to separate from support industries such as services
                                                                             and transportation.

                                       Two employment graphs are shown below because the federal government changed its way of
                                         classifying industries starting in 2001 (from the “SIC” method to the “NAICS” method). It’s
                                          difficult to compare the SIC data available for the period 1961-2001 with the NAICS data
                                             available for years after 1990. For this class, we’ll only use the newer NAICS data.

                                                             Estimated Alaska Employment, 1961-2001                                                                                                                 Estimated Alaska Employment, 1990-2008
                                 500                                                                                                                                                          500
                                 450                                                                                                                                                          450                                                                                Other
                                                                                                                                         Other
Employment (thousands of jobs)

                                                                                                                                                             Employment (thousands of jobs)
                                 400                                                                                                                                                          400
                                                                                                                                                                                                                                                                                 Services
                                 350                                                                                                     Services                                             350
                                 300                                                                                                                                                          300                                                                                Trade
                                                                                                                                         Trade
                                 250                                                                                                                                                          250
                                                                                                                                                                                                                                                                                 Transportation
                                 200                                                                                                     Transportation                                       200
                                 150                                                                                                                                                          150
                                                                                                                                                                                                                                                                                 State and Local
                                                                                                                                         State and Local
                                 100                                                                                                                                                          100                                                                                Government
                                                                                                                                         Government
                                  50                                                                                                                                                           50                                                                                Traditional Basic
                                                                                                                                         Traditional Basic
                                   0                                                                                                                                                            0
                                                            1970

                                                                                 1979

                                                                                                                    1994

                                                                                                                                                                                                                                              2002
                                       1961
                                              1964
                                                     1967

                                                                   1973
                                                                          1976

                                                                                        1982
                                                                                               1985
                                                                                                      1988
                                                                                                             1991

                                                                                                                           1997
                                                                                                                                  2000

                                                                                                                                                                                                    1990

                                                                                                                                                                                                           1992

                                                                                                                                                                                                                  1994

                                                                                                                                                                                                                         1996

                                                                                                                                                                                                                                1998

                                                                                                                                                                                                                                       2000

                                                                                                                                                                                                                                                     2004

                                                                                                                                                                                                                                                            2006

                                                                                                                                                                                                                                                                   2008

                                                                                                                                                                                                                                                                          2010
                                                        Source: BEA Employment Estimates by SIC Code
                                                                                                                                                                                                                  Source: BEA Employment Estimates by NAICS Code
Federal spending is extremely important to                                                                                    Examples of federal spending in
                          Alaska’s economy.                                                                                                     Alaska in 2008 ($ million)
The federal government spent more than $12 billion in Alaska                                                                            Military procurement contracts            1989
  in FY2010. Alaska ranks first among U.S. states in federal                                                                            Salaries and wages                        2206
 expenditures per capita. Federal spending supports not just
                                                                                                                                        Medical assistance program                  693
the military and federal civilian agencies, but also many other
     industries such as construction and health care. UAA                                                                               Highway planning and construction           383
 Professor of Economics Scott Goldsmith has estimated that                                                                              Airport improvement program                 186
  about 1/3 of Alaska jobs depend—directly or indirectly--on
                       federal spending.                                                                                                Indian housing block grants                  80

                                                                                                                                                        Former Alaska Senator Ted
                                              Federal Spending in Alaska: 1981-2010                                                                 Stevens used his political skill and
             14000
                                                                                                                                                     power as one of the most senior
                            Note: The graph shows data                                                                                              members of the Senate to greatly
             12000          reported by the Bureau of the                                                                                              increase federal spending in
                            Census. However, the data for                                                                      Procurement
                            2009 and 2010 are likely
                                                                                                                                                     Alaska. Future federal spending
             10000
                            significantly overestimated due                                                                                            will probably decline because
                            to errors which the Bureau of the                                                                                       Alaska’s congressional delegation
                                                                                                                               Direct Payments
                            Census has acknowledged but                                                                                               no long has as much power and
$ millions

             8000
                                                                                                                               to Individuals and
                            not yet corrected.                                                                                                       there a lot of political pressure to
                                                                                                                               Others
             6000
                                                                                                                                                         cut total federal spending.
                                                                                                                               Wages and
                                                                                                                               Salaries
             4000

                                                                                                                               Grants to State
             2000                                                                                                              and Local
                                                                                                                               Governments
                 0
                                    1985

                                                  1989

                                                         1991

                                                                       1995

                                                                              1997

                                                                                            2001

                                                                                                                 2007
                     1981

                             1983

                                           1987

                                                                1993

                                                                                     1999

                                                                                                   2003

                                                                                                          2005

                                                                                                                        2009

                                                                                                                                                                                            15
Federal spending in Alaska is likely to level off or decline in the future.

  Federal spending in Alaska is high for several reasons. The federal government owns
 and manages a lot of land in Alaska. There are several large military bases, and military
      spending in Alaska increased sharply after 2002 partly because of the Iraq and
  Afghanistan wars. And former Alaska Senator Ted Stevens used his political skill and
power as one of the most senior members of the Senate to direct a lot of federal spending
to Alaska. Future federal spending will probably decline because Alaska’s congressional
delegation no long has as much power, there a lot of political pressure to cut total federal
     spending, and military spending is likely to decline as the US pulls out of Iraq and
   Afghanistan. Because federal government spending plays such a big role in Alaska’s
  economy, a potential leveling off or decline of federal spending is a significant concern.

      Federal Spending in Alaska, Defense & Non-Defense: 2002-2010
  100%

   90%
                                                                                   Ted Stevens
   80%

   70%
   60%
                                                                         Non-
   50%                                                                   Defense
   40%
   30%                                                                   Defense

   20%
   10%
    0%
                               2005

                                                           2009
          2002

                 2003

                        2004

                                      2006

                                             2007

                                                    2008

                                                                  2010
The military plays an important role in Alaska’s economy.

 The military has played an very important role in Alaska’s history and economy. During World War II
 hundreds of thousands of troops were sent to Alaska. The army built the Alaska Highway and many
    other roads, airfields, and military bases, transforming Alaska’s transportation infrastructure and
economy. At statehood 35% of Alaska jobs were military. Since statehood, the number of military has
  declined, while the rest of the economy has grown. In 2006, there were about 23,000 active duty
 military in Alaska—representing about 7% of total jobs. With the deployments of many Alaska-based
military units to Iraq and Afghanistan, in recent years Alaskans have become much more aware of the
        presence of the military in Alaska and their importance to our communities and economy.
WWII: A wrecked P-38
  in the Aleutians                                                                  30%
                                                                                                                        Number of Active-Duty Military in Alaska
                                                                                                                                                                                                                                 35,000
                                                                                                                             25% of
                                                                                                                             jobs in                                                                         7% of

                                     Military Employment as % of Total Employment
                                                                                                                                                                                                            jobs in              30,000
                                                                                    25%                                       1969
                                                                                                                              were                                                                         2006 were
                                                                                                                             military                                                                       military
                                                                                                                                                                                                                                 25,000

                                                                                                                                                                                                                                          Military Employment
                                                                                    20%

                                                                                                                                                                                                                                 20,000

                                                                                    15%

                                                                                                                                                                                                                                 15,000
  Eielson Air Force Base
                                                                                    10%
                                                                                                                                                                                                                                 10,000

                                                                                    5%
                                                                                                                                                                                                                                 5,000

                                                                                    0%                                                                                                                                           0
                                                                                                                      1977

                                                                                                                                            1983

                                                                                                                                                   1985

                                                                                                                                                                 1989

                                                                                                                                                                        1991

                                                                                                                                                                                             1997
                                                                                          1969

                                                                                                 1971

                                                                                                        1973

                                                                                                               1975

                                                                                                                              1979

                                                                                                                                     1981

                                                                                                                                                          1987

                                                                                                                                                                               1993

                                                                                                                                                                                      1995

                                                                                                                                                                                                    1999

                                                                                                                                                                                                            2001

                                                                                                                                                                                                                   2003

                                                                                                                                                                                                                          2005
                                                                                                                                                                                                                                                                17
Alaska’s economy has always depended
     heavily on natural resources.

 Before Alaska became a state in 1959, the
  fishing and mining industries—along with
government—accounted for most of the jobs
 and income in Alaska, directly or indirectly.
The discovery of oil on Alaska’s North Slope
  in the 1960s drastically changed Alaska’s
    economy. Alaska’s oil production is so
   valuable that it now dominates Alaska’s
                   economy.

                                                 18
The oil industry is extremely important to Alaska’s economy.

Along with federal spending, Alaska’s economy is driven by the oil industry. Although only
only a few thousand people are directly employed by oil companies, many more work in oil-
    related jobs such oilfield service activities, oilfield construction projects, and pipeline
  operations. The State of Alaska is extremely dependent on oil revenues, mostly from oil
royalties and severance taxes which oil companies pay to the state. Oil accounts for about
85% of the “unrestricted” revenue available to the State for spending for general purposes.
Thus the oil industry pays for a very large share of state government and local government
 employment. UAA Professor of Economics Scott Goldsmith has estimated that about 1/3
          of Alaska jobs can be attributed—directly or indirectly—to the oil industry.

                Prudhoe Bay, on Alaska’s North Slope, is the largest oil field ever
                  discovered in North America—and a huge industrial complex.

                                                                                                  19
Alaska’s oil production is declining.

 Alaska oil production began with the Cook Inlet oil fields (near Anchorage!) in the
1960s. But it was the North Slope oil fields that made Alaska a major oil producer.
North Slope oil production began after the Trans-Alaska Pipeline was completed in
 1977, and grew very rapidly to a peak of about 2 million barrels per day in 1988.
Production has since fallen by more than two-thirds, to 0.6 million barrels per day in
 2011, as oil has been pumped out of the huge Prudhoe Bay and Kuparuk fields.
                                                               Alaska Oil Production, Historical and Projected
                                  2.5

                                  2.0
    millions of barrels per day

                                  1.5

                                                                                                                                                                                              North
                                  1.0                                                                                                                                                         Slope

                                                                                                                                                                                              Cook
                                  0.5                                                                                                                                                         Inlet

                                  0.0
                                        1959
                                               1962

                                                      1965
                                                             1968

                                                                    1971
                                                                            1974
                                                                                   1977

                                                                                          1980
                                                                                                 1983

                                                                                                        1986
                                                                                                               1989

                                                                                                                      1992
                                                                                                                             1995

                                                                                                                                    1998
                                                                                                                                           2001

                                                                                                                                                  2004
                                                                                                                                                         2007

                                                                                                                                                                2010
                                                                                                                                                                         2013
                                                                                                                                                                                2016

                                                                                                                                                                                       2019
                                                                                     Historical: 1959-2011                                                             Projected: 2012-21             20
Alaska’s oil production is likely to continue to decline.

 Production from new, smaller fields that are under development or are
under evaluation for potential development is not expected to be enough
   to offset the continuing rapid decline in currently producing fields.
               North Slope Historical and Forecasted Oil Production
                    (from the Alaska Department of Revenue’s
                           Fall 2011 Revenue Forecast)

                                                                           21
Oil prices are among the most important factors affecting Alaska oil
                                                                          production, state revenues, and the Alaska economy.

                                              •           Oil prices directly affect how much revenue the State gets from the oil industry.
                                              •           Oil prices affect how profitable oil development is for the oil companies, and their
                                                          willingness to invest in new development.

                                                                                                                                                                                      Oil prices are extremely
                                                                     Average Annual Price of Crude Oil (adjusted for inflation)                                                    volatile! Here is how oil prices
                                       $120                                                                                                                                          (adjusted for inflation) have
                                                                                                                                                                                   changed since North Slope oil
                                       $100
                                                                                                                                                                                      production began in 1977:
$/barrel (expressed in 2011 dollars)

                                       $80
                                                                                                                                                                                          $53/barrel in 1977
                                                                                                                                                                                         $104/barrel in 1980
                                                                                                                                                                                          $31/barrel in 1986
                                       $60
                                                                                                                                                                                          $42/barrel in 1990
                                                                                                                                                                                          $20/barrel in 1998
                                       $40
                                                                                                                                                                                         $104/barrel in 2008
                                                                                                                                                                                          $65/barrel in 2009
                                       $20
                                                                                                                                                                                          $95/barrel in 2011

                                        $0
                                                                                                                                                                                     The State’s revenues and
                                                  1976

                                                                   1980

                                                                          1982

                                                                                 1984

                                                                                        1986

                                                                                               1988

                                                                                                      1990

                                                                                                             1992

                                                                                                                    1994

                                                                                                                           1996

                                                                                                                                  1998

                                                                                                                                         2000

                                                                                                                                                2002

                                                                                                                                                       2004

                                                                                                                                                              2006

                                                                                                                                                                     2008

                                                                                                                                                                            2010
                                                           1978

                                                                                                                                                                                       economy have been
                                                         Source: Average annual price, West Texas Intermediate crude oil, from U.S. Energy Information Administration,
                                                                                       www.eia.doe.gov/emeu/international/oilprice.html                                            dramatically affected by these
                                                                                                                                                                                        oil price changes.
It’s very difficult to predict future oil prices.

                                          Historically, people have frequently predicted we have entered a new era of
                                       permanently higher oil prices. But historically, oil prices have fluctuated widely,
                                           and have been very difficult to predict. In the early 1980s, “real” oil prices
                                         (adjusted for inflation) were at record high levels. Many people assumed oil
                                       prices would stay high. But oil prices fell to very low levels by 1986, leading to a
                                           severe recession in Alaska. The bottom line: Future oil prices are highly
                                                                            uncertain.
                                                                Average Annual Price of Crude Oil (adjusted for inflation)

                                       $120                                                                                                                                   Oil prices are driven by both
                                                                                                                                                                                demand and supply! The
                                       $100
                                                                                                                                                                                sharp drop in oil prices in
$/barrel (expressed in 2011 dollars)

                                       $80
                                                                                                                                                                                2009 was caused by the
                                                                                                                                                                              sharp decline in demand due
                                       $60                                                                                                                                        to a global economic
                                                                                                                                                                                        recession.
                                       $40

                                       $20                                                                                                                                     Costs of alternative energy
                                                                                                                                                                               forms, such as natural gas,
                                         $0                                                                                                                                   coal, and nuclear energy, set
                                              1976

                                                              1980

                                                                     1982

                                                                            1984

                                                                                   1986

                                                                                          1988

                                                                                                 1990

                                                                                                        1992

                                                                                                               1994

                                                                                                                      1996

                                                                                                                             1998

                                                                                                                                    2000

                                                                                                                                           2002

                                                                                                                                                  2004

                                                                                                                                                         2006

                                                                                                                                                                2008

                                                                                                                                                                       2010
                                                       1978

                                                     Source: Average annual price, West Texas Intermediate crude oil, from U.S. Energy Information Administration,
                                                                                                                                                                                an upper limit on oil prices
                                                                                   www.eia.doe.gov/emeu/international/oilprice.html
                                                                                                                                                                                   over the long-term.
                                                                                                                                                                                                               23
The State of Alaska’s oil revenues have fluctuated widely.

      In the first five years of North Slope oil production (1978-1982) Alaska’s oil revenues rose
 dramatically because both oil prices and oil production rose dramatically. A rapid growth in state
 spending led to a huge economic boom. Then oil revenues began a long period of decline, as oil
prices declined and (after 1988) oil production also declined. The steep drop in state oil revenues
in 1987 led to a sharp reduction in state spending and a severe recession in Alaska. Oil revenues
fell even more during the late 1990s, leading to major concerns about the future of state revenues
                                         and the Alaska economy.
                                               State General Fund (Unrestricted) Revenues (adjusted for inflation)
                                       12000                                                                                                                            $120

                                                                                   Non-Oil Revenues
                                                                                                                                                                                                      And then everything
                                       10000
                                                                                   Oil: Other oil revenues                                                              $100                          changed! Oil prices
 Revenues (millions of 2011 dollars)

                                                                                   Oil: Production taxes                                                                                               soared—and in the
                                                                                   Oil: Royalties                                                                                                     mid 2000s the state
                                        8000                                                                                                                            $80
                                                                                   Average Oil Price (ANS West Coast)                                                                                     also increased

                                                                                                                                                                               Oil price ($/barrel)
                                                                                                                                                                                                      production tax rates
                                        6000                                                                                                                            $60                            on the oil industry.
                                                                                                                                                                                                           Suddenly and
                                                                                                                                                                                                           unexpectedly,
                                        4000                                                                                                                            $40
                                                                                                                                                                                                          Alaska was rich
                                                                                                                                                                                                       again—with record
                                        2000                                                                                                                            $20                           oil revenues in 2008!
                                                                                                                                                                                                         Revenues have
                                          0                                                                                                                             $0
                                                                                                                                                                                                      fallen since then but
                                                                                                                                                                                                        remain very high.
                                               FY78

                                                      FY80

                                                             FY82

                                                                     FY84

                                                                            FY86

                                                                                    FY88

                                                                                           FY90

                                                                                                  FY92

                                                                                                         FY94

                                                                                                                FY96

                                                                                                                       FY98

                                                                                                                              FY00

                                                                                                                                     FY02

                                                                                                                                            FY04

                                                                                                                                                   FY06

                                                                                                                                                          FY08

                                                                                                                                                                 FY10

                                                                                                                                                                                                                              24
Projections of future state revenues really are highly uncertain!

 This graph shows the Department of Revenue’s 10-year projections for state revenues
   for a six-year period—and what actually happened. Note that the projections for the
  future changed widely from year to year! Note that usually the projections were pretty
close to actual revenues for the year the projections are made in (except in FY 2008) but
              they were usually way off by the second year of the projections.

                                                State General Fund (Unrestricted) Revenues:
                                             Alaska Department of Revenue 10-Year Projections                                                            Having lots of oil
                       12000                                                                                                                                 revenue is
                                                                                                                                                            great—most
                       10000                                                                                                                             states would love
                                                                                                                                                           to have our oil
                                                                                                                                 Actual Revenues
                       8000                                                                                                                                   revenue!
 millions of dollars

                                                                                                                                 Fall 2004 Projections
                                                                                                                                 Fall 2005 Projections
                                                                                                                                 Fall 2006 Projections
                       6000                                                                                                      Fall 2007 Projections
                                                                                                                                                          Bit it does make
                                                                                                                                 Fall 2008 Projections   it hard to plan for
                                                                                                                                 Fall 2009 Projections
                       4000
                                                                                                                                                              the future,
                                                                                                                                                           because the oil
                                                                                                                                                           revenue varies
                       2000
                                                                                                                                                          so widely and is
                                                                                                                                                              so hard to
                          0
                                                                                                                                                                predict.
                               FY05

                                      FY06

                                             FY07

                                                    FY08

                                                           FY09

                                                                  FY10

                                                                         FY11

                                                                                FY12

                                                                                       FY13

                                                                                              FY14

                                                                                                     FY15

                                                                                                            FY16

                                                                                                                          FY18
                                                                                                                   FY17

                                                                                                                                                                          25
The Alaska Department of Revenue is projecting that state revenues will decline gradually in the
                      future. But what will actually happen is highly uncertain!
This graph shows the Alaska Department of Revenue’s projections for State revenues through FY 2021—
as of Fall 2011. They are projecting (guessing) that oil prices will average slightly higher in 2012, causing
     revenues to increase, but that future revenues will decline as production declines. But the future
         projections are highly uncertain—because we don’t know what will happen to oil prices!

                                                          State General Fund (Unrestricted) Revenues:
                                                     Actual (through FY 11) and Projected (beginning FY 12)
                               12000

                                                                                                                             Actual                               Department of
                                                                                                                           revenues                                 Revenue
                               10000                                                                                                                               projections
         millions of dollars

                                8000
                                                                                   Non-Oil Revenues
                                                                                   Oil: Other oil revenues
                                6000                                               Oil: Production taxes
                                                                                   Oil: Royalties
                                4000

                                2000

                                  0
                                              1980

                                                                   1986

                                                                                 1990

                                                                                               1994

                                                                                                                    2000

                                                                                                                                   2004

                                                                                                                                                 2008

                                                                                                                                                        2010

                                                                                                                                                                      2014

                                                                                                                                                                                           2020
                                       1978

                                                     1982

                                                            1984

                                                                          1988

                                                                                        1992

                                                                                                      1996

                                                                                                             1998

                                                                                                                            2002

                                                                                                                                          2006

                                                                                                                                                               2012

                                                                                                                                                                             2016

                                                                                                                                                                                    2018
                                                                                                                                                                                                  26
Alaska has very large natural gas resources
                               —but no way yet to get them to market.

 There are enormous natural gas resources on Alaska’s North Slope—comparable in energy value to
Alaska’s oil resources. These gas resources have not been developed because there is no pipeline to
                                       bring them to market.

 Over the past decade there has been a lot of talk and excitement about building a gas pipeline. There
  has also been a lot of debate about where the pipeline should go. The two main options are pipeline
through Canada to the American midwest, or a pipeline to Valdez where the gas could be converted into
                       liquified natural gas (LNG) and shipped to markets in Asia.

   But a gas pipeline is not a sure thing! Building a gas pipeline raises extremely complex economic,
 financial, political and legal issues. Building a gas pipeline would be extremely expensive—potentially
more than $20 billion (about half the value of Alaska’s Permanent Fund)—based on cost estimates that
 are already several years old. Because of the high cost and the great uncertainty about future natural
gas prices, developing North Slope natural gas in inherently risky. Anyone taking on this risk—the gas
producers, the pipeline owners, gas customers, or the State—will want a large share of the profits. This
                              makes it hard to reach a deal to build a pipeline.

 A recent steep decline in US natural gas prices, due to the rapid development of Lower 48 shale gas
  resources, has greatly reduced the likelihood that a pipeline to the midwest could be economically
  viable. But exports of LNG from Alaska to Asian markets would face competition from many other
potential lower-cost LNG suppliers, such as Russia, Indonesia and even the US lower 48 states. Some
 people argue that no gas pipeline option is economically viable: that there isn’t any way to profitably
                       develop North Slope natural gas resources at the moment.

   Even if a gas pipeline is built, it will probably be at least ten years before construction would start.

                                                                                                              27
Alaska Seafood Industry
 Alaska’s seafood industry is very large and very
 diverse. Many different kinds of boats—ranging
   from very small to very large—harvest many
 different kinds of fish. These are processed into
many different kinds of products which are sold in
markets all over the world. This makes it difficult to
  generalize about the Alaska seafood industry.

 The most important species for the Alaska seafood
     industry—in terms of volume and value—are
     pollock, salmon, halibut and crab. There are
   important differences between these fisheries in
  resource conditions, market conditions, the types
and scale of boats that are used, who participates in
    the fisheries, and who manages the fisheries.

                                                         28
Alaska Seafood Industry Economic Importance
   Alaska’s seafood industry is world-scale. The value of fish
  harvests was about $1.7 billion in 2008. More than a billion
    dollars in value is added in fish processing. The seafood
industry is particularly important for rural Alaska. Fishing is the
  most important source of income, taxes, infrastructure and
    utilities for coastal communities--and an important part of
 Alaska culture. However, many fishermen and the majority of
  fish processing workers are non-residents, and most of the                                                       Average annual fishing
  large companies in the seafood industry are based outside                                                          employment is about
                              Alaska.                                                                             9000 and average annual
                                                                                                                        fish processing
                                                                         Alaska fish                                 employment is about
                                                                      processing plants                             7000. The number of
                                                                                                                     people working in the
                                                                                                                  seafood industry is much
                                                                                                                   higher because many of
                                                                                                                    the jobs are seasonal.

           Map source: Alaska Division of Community Advocacy web site: http://www.dced.state.ak.us/cbd/seafood/seafoodprocessors.htm.
                                                                                                                                             29
Seafood Industry Challenges

  Unlike many other places, most Alaska fish resources are healthy and not over-
 fished. However, falling prices caused a sharp decline in value during the 1990s,
   particularly in the salmon industry, which faced an economic crisis. Since 2002
 prices and value have been increasing again. The management of many fisheries
  is being “restructured” to restrict the number of boats participating and to create
  fishing rights which may be bought and sold. This process is very controversial,
     because it significantly affects who participates in and benefits from Alaska
                                         fisheries.
                                                                                                                             Competition from salmon
                                                                                                                          farming led to a sharp drop in
                                    Real Ex-Vessel Value of Alaska Seafood Harvests
                                                                                                                           salmon prices in the 1990s.
                           2,500
                                                                                                                          Fish farming is growing rapidly
                                                                                                                            worldwide, but is banned in
                           2,000
                                                                                                                                     Alaska.
millions of 2008 dollars

                           1,500                                                                             Groundfish
                                                                                                             Shellfish
                           1,000                                                                             Halibut
                                                                                                             Herring
                                                                                                             Salmon
                            500

                              0
                                                                                        1995
                                   1960

                                          1965

                                                    1970

                                                           1975

                                                                  1980

                                                                         1985

                                                                                 1990

                                                                                               2000

                                                                                                      2005

                                                 Source: National Marine Fisheries Service                                                                  30
Mining
   Alaska has several large operating zinc,
gold, silver and coal mines, and a number of
 smaller mines. Several very large mining
prospects in southwestern Alaska, including
  the Pebble and Donlin Creek copper and
gold deposits, are under evaluation and may
  be developed in the next few years. The
     total annual value of Alaska mineral
   production is more than $1 billion. Total       The Red Dog mine, north of Kotzebue, is
 direct employment in mining is about 1500       Alaska’s largest mine and the world’s largest
                     jobs.                        zinc mine. The land is owned by an Alaska
                                                      Native corporation, NANA Regional
   Although Alaska has significant mineral        Corporation. The Red Dog mine employs
   resources, high costs of extraction and          about 500 people, many of them Alaska
  transportation and volatile prices make it        Natives who are shareholders of NANA.
     difficult for Alaska mining projects to
 compete in world markets. State revenues
 from mining are only about 1% as high as
             state revenues from oil.

                                      The Fort Knox mine,
                                     north of Fairbanks, is
                                          Alaska’s largest
                                      operating gold mine.
                                                                                                 31
The Pebble Mine
 A major new potential mining project in Alaska is the proposed Pebble mine, which would
 develop copper and gold from a very large deposit in southwestern Alaska. The Pebble
  Partnership, a consortium of mining companies, is working to develop the project. This
        involves extensive studies and a long and complicating permitting process.

   This Pebble mine is generating a lot of controversy—and is likely to generate more--
because other resource values in this area, including fisheries and wilderness, are also very
 high. In particular, the Pebble project is in headwaters of Bristol Bay drainage—home to
           Alaska’s most valuable salmon fishery and many sport-fishing lodges.

         Source: Northern Dynasty Minerals Ltd presentation on Pebble project, downloaded March 14 2006 from:
                              http://www.hdgold.com/i/ndm/NDM_Feb06_BMO_RAD.pdf
                                                                                                                32
Conflict over Resource Development
The debate over the Pebble Mine is similar to many other
debates which have occurred in Alaska’s history between
     advocates of developing Alaska’s resources and
  advocates of protecting Alaska’s environment. These
 debates raise fundamental questions about what kind of
  future we want for Alaska, and whether or not we can
    develop our natural resources and also protect our
  environment. Alaska’s constitution says that Alaska’s
 resources are to be managed for the “maximum benefit”
   of Alaskans. But not all Alaskans agree about what
               “maximum benefits” means.

                                                           Here are two websites—one from
                                                            an organization which opposes
                                                           developing the Pebble mine and
                                                                one which supports it.

                                                                                            33
Tourism
 About 1.7 million visitors came to Alaska in the summer of 2008, more than half of
  them on cruise ships. Total employment attributable to tourism is estimated—by
various methods—at about 25,000. The number of tourists visiting Alaska each year
   was growing steadily for many years until the recession caused a sharp drop in
   tourism in 2009. In the long-run, tourism is likely to continue to grow—creating
   demands for new facilities and recreational opportunities for visitors, as well as
                         conflicts over crowding and land use.

Source:Alaska Visitor Statistics Program V Interim Visitor Volume Report, Summer 2008,
          http://www.commerce.state.ak.us/oed/toubus/pub/AVSP_2008.pdf

                                                                                         34
Trade and Services
    Much of Alaska’s employment                                                                 Estimated Alaska Employment, 1990-2008
                                                                          500
 growth over the past 40 years has
                                                                          450                                                                                Other
     come in support industries—

                                         Employment (thousands of jobs)
                                                                          400
   particularly trade and services.                                                                                                                          Services
                                                                          350
Trade and service jobs now account                                        300                                                                                Trade
     for about half of total Alaska                                       250
  employment. Alaskans are much                                           200
                                                                                                                                                             Transportation

 more likely to work in a retail store                                    150
                                                                                                                                                             State and Local
 or a hospital than on an oil rig or a                                    100                                                                                Government

  fishing boat. The growth in trade                                        50                                                                                Traditional Basic

and services has led to a decline in                                        0

                                                                                                                          2002
                                                                                1990

                                                                                       1992

                                                                                              1994

                                                                                                     1996

                                                                                                            1998

                                                                                                                   2000

                                                                                                                                 2004

                                                                                                                                        2006

                                                                                                                                               2008

                                                                                                                                                      2010
 average Alaska wages—because
wages tend to be lower in trade and                                                           Source: BEA Employment Estimates by NAICS Code

  services than in other industries.

                                                                                                                                                                              35
Alaska’s Permanent Fund
                       In 1976, Alaskans voted for a constitutional amendment mandating that part of the state’s oil
                        revenues must be deposited in a Permanent Fund.* These Permanent Fund savings have
                       been invested in a diversified portfolio of assets including stocks, bonds and real estate. With
                        new deposits and growth in the value of investments, the total value of the Permanent Fund
                       grew to $40 billion by 2011. The value of the Permanent Fund fell sharply in 2002 and 2009
                           due to market downturns, but rebounded quickly. We can’t spend the principal of the
                       Permanent Fund—only the realized earnings.** As the Permanent Fund has gotten bigger,
                         these realized earnings have gotten bigger. Between 1998 and 2003, they exceeded the
                                                             State’s oil revenues.
                                                           Alaska Permanent Fund Market Value
                                                                 (fiscal year end-balance)
                      45,000
                                                                                                                                                       *The amendment requires that
                      40,000                                                                                                                           “at least 25 percent of all
                                                                                                                                                       mineral lease rentals, royalties,
                      35,000
                                                                                                                                                       royalty sales proceeds, federal
                      30,000
                                                                                                                                                       mineral revenue-sharing
millions of dollars

                                                                                                                                                       payments and bonuses received
                      25,000                                                                                                                           by the state be placed in a
                                                                                                                                                       permanent fund, the principal of
                      20,000                                                                                                                           which may only be used for
                                                                                                                                                       income-producing investments.“
                      15,000

                      10,000                                                                                                                           **Realized earnings are stock
                                                                                                                                                       dividends, bond interest, real
                       5,000                                                                                                                           estate rent and the income
                                                                                                                                                       made or lost by the sale of any
                          0
                                                                                                                                                       of these investment assets.
                               1978

                                      1980

                                             1982

                                                    1984

                                                            1986

                                                                   1988

                                                                          1990

                                                                                 1992

                                                                                        1994

                                                                                               1996

                                                                                                      1998

                                                                                                             2000

                                                                                                                    2002

                                                                                                                           2004

                                                                                                                                  2006

                                                                                                                                         2008

                                                                                                                                                2010
Permanent Fund Dividends
   Beginning in 1982, the legislature began to distribute part of the realized earnings
  of the Permanent Fund to Alaskans as “Permanent Fund Dividends.” After an initial
  $1000 payment to all Alaskans in 1982, Permanent Fund Dividend annual payment
     amounts have been based on a formula roughly equal to half of the Permanent
       Fund average realized earnings over the previous five years, divided by the
        number or eligible Alaskans. When the fund’s stock, bond and real estate
   investments have done well, Permanent Fund dividends have gone up—and vice
                                         versa.
                               Alaska Permanent Fund Dividend Annual Payments

$2,500                                                                                                              About half the realized earnings
                                                                                                                    of the Permanent Fund are
                                                                                                                    used for dividends and the
$2,000
                                                                                                                    other half have been kept in the
                                                                                                                    fund for “inflation-proofing.”
$1,500
                                                                                                                    The Permanent Fund Dividend
                                                                                                                    program is very popular among
$1,000                                                                                                              Alaskans. It means that
                                                                                                                    Alaskans benefit directly from
                                                                                                                    the past oil revenues and the
 $500
                                                                                                                    Permanent Fund. But it also
                                                                                                                    means that the money isn’t
   $0                                                                                                               available for other uses such as
         1982

                 1984

                        1986

                                       1990

                                              1992

                                                            1996

                                                                   1998

                                                                          2000

                                                                                 2002

                                                                                               2006

                                                                                                      2008

                                                                                                             2010
                                1988

                                                     1994

                                                                                        2004

                                                                                                                    helping to pay for state
                Source: Alaska Permanent Fund Corporation website                                                   government.
                                                                                                                                                       37
The Rural Alaska Economy
 The economy of rural Alaska—particularly villages in western and interior Alaska—is very
   different from that of urban areas that account for most of Alaska’s population. These
population of “village Alaska” is overwhelmingly Alaska Native. Residents get much of their
 food from subsistence. Costs are very high, and basic infrastructure such as housing and
  water are far below the standards of urban Alaska. There are few jobs, and a very high
 share of jobs are in local government, education and health care. The economy is heavily
dependent on federal and state transfers. A major economic challenge facing Alaska is how
 to create economic opportunities in these areas. There are no easy or obvious answers.
                                                         Two Rural Census Areas
                                                                                  Many Alaska villages are
                                             Anchorage    Wade          Yukon-
                                                         Hampton       Koyukuk    accessible only by small
% Alaska Native (1999)                         8.1%       94.7%         63.3%         planes, boats or
Unemployment rate (2000)                       4.7%       17.8%         15.4%     snowmachines. Freight
Adults Not In Labor Force (1990)              26.7%       44.3%         39.5%        costs are heavily
Transfer payments per person (1999)           $4,000      $5,900       $7,100      subsidized by the U.S.
% of population below poverty level (1997)     6.7%       39.4%         24.2%     Postal Service’s “bypass
                                                                                       mail” program.        38
Subsistence                               Subsistence salmon
                                                                        drying
   Subsistence--Alaska’s original economy--remains an
  important part of the economy of rural Alaska. People
 in rural Alaska get much of their food from subsistence.
    Subsistence is a vital part of Alaska Native culture.
   Subsistence is difficult to quantify: it doesn’t show up
     in measures of Alaska’s cash economy, such as
 employment or Gross State Product data. Subsistence
 faces challenges, including a limited resource base and
  growing demands from sport and commercial users. A
       longstanding and important political debate is
    continuing over the relative roles of the federal and
     state governments in Alaska subsistence policy.

  Estimated annual wild food
 harvest (pounds per person)
Nome census area            519
                                                                A woman at a subsistence
Bethel census area          592                                  “fish camp”—an important
                                       Subsistence harvesting   part of summer family life in
                                         of Beluga whales           much of village Alaska
                                                                                                39
Native Corporations
  The Alaska Native Claims Settlement Act of 1971 (ANCSA) created both “regional” and “village” Native
corporations. There is a regional Native corporation for each of twelve Alaska regions. Some of the regional
Native corporations have become very large and profitable businesses with many subsidiaries in Alaska and
   other states. Some of the most financially successful Native corporations, such as Cook Inlet Regional
 Corporation (CIRI) and Arctic Slope Regional Corporation have paid large dividends to their shareholders.
 Others have not been as successful and have paid very small dividends. Even the most successful Native
                      corporations have found it difficult to create jobs in rural Alaska.

                                                       Many of the regional corporations have large
                                                       headquarters office buildings in Anchorage.

                                                                                                               40
Spending as much as—or more than—we earn. . .
              For most of the 1990s, the State of Alaska’s expenditures were higher than its revenues. The
                  State paid for the difference by taking money out of a special savings account that the
                legislature had put aside. Until several years ago, a lot of people worried about what we
               would do when that savings account ran out of money: it looked like we would have to cut
                                 back on state spending, raise taxes, or reduce dividends.

                      When oil prices and oil revenues increased dramatically the past few years, people stopped
                       worrying about that problem. We started spending a lot more money—but luckily we also
                                              saved a lot of money, particularly since 2008.

                      State "General" Expenditures and General Fund Revenues
                                                                                                                                      But people are worrying again. Even if oil
                      6000
                                                                                                                                        prices stay high, if oil production keeps
                                                                                       "General"                                      going down, eventually state oil revenues
                      5000
                                                                                       expenditures                                    will go down. And cutting state spending
                                                                                       General fund                                       won’t be easy. When you hire more
millions of dollars

                      4000                                                             revenues                                          troopers and teachers and University
                                                                                                                                      faculty, give public employees pay raises,
                      3000                                                                                                            build more public facilities that need to be
                                                                                                                                        maintained, and so on, it’s hard to cut
                      2000                                                                                                                                back.

                      1000                                                                                                            We may soon be back with the same old
                                                                                                                                      problem of spending more than we are
                        0                                                                                                             earning, and dipping into savings which
                             FY78

                                    FY80

                                           FY82

                                                  FY84

                                                         FY86

                                                                FY88

                                                                       FY90

                                                                              FY92

                                                                                     FY94

                                                                                            FY96

                                                                                                   FY98

                                                                                                          FY00

                                                                                                                 FY02

                                                                                                                        FY04

                                                                                                                               FY06

                                                                                                                                           could run out in a few years.
                                                                                                                                                                                     41
Alaska’s Fiscal Challenge

 Alaska faces a long-term fiscal problem. As Alaska’s population grows, demand for State
 services will inevitably grow. At the same time, the oil revenues which have paid for most
State services are likely to decline as oil production declines—regardless of what happens to
                                             oil prices.

    Alaska’s investment earnings from the Permanent Fund were growing until the recent
   financial crisis. These investment earnings could in theory become a new “permanent”
  source of state revenues. But Alaskans have come to expect that those earnings will be
           used to pay for Permanent Fund dividends—rather than for government.

 Alaskans pay significant property taxes and/or sales taxes to local governments which help
support both local governments and their local schools. But Alaskans have been unwilling to
  accept broad-based taxes—such as income or sales taxes—to pay for the costs of State
  government. Basically, we get our State government for free (and we expect it to send us
                              money in the form of dividends).

  Eventually, when oil revenues decline, Alaskans will face a difficult choice. Either we will
  have to reduce spending, impose broad-based taxes on Alaskans, use some or all of the
Permanent Fund earnings to pay for state expenditures rather than dividends—or spend from
 the capital of the Permanent Fund (which would require a constitutional amendment). Most
                                likely we’ll do some of each.

  No other state has both high oil revenues and a huge Permanent Fund. Most States would
love to have Alaska’s fiscal problem. It is not an economic challenge but a political challenge.
                                                                                              42
The “Alaska Disconnect”

 Alaska’s fiscal structure—specifically the fact that Alaskans do not pay
   any significant broad-based taxes—leads to a problem which has
               become known as the “Alaska Disconnect.”

   If economic developments creates more jobs, Alaska’s population
   grows. As the population grows, Alaskans need more schools and
  teachers for their children and the other services that state and local
                           governments provide.

 Although the new Alaskans pay local sales and property taxes which
support local services, they don’t pay broad-based state taxes to cover
    the cost of state-funded services such as education and roads.

 The new jobs create new costs for the state but not corresponding new
revenues. As a result, except for oil development (which pays high state
 taxes), many kinds of economic development make the state’s financial
                         situation more difficult.

                                                                            43
Alaska Economic Development Policy

Alaskans and their politicians and long debated how to bring “economic development”
   to Alaska. Government can create jobs by spending money—and has done this
                         throughout Alaska’s economic history.

      But the federal and state governments have a poor track record in creating
  sustainable, profitable private-sector economic development by spending money. A
 number of government-funded projects, such as the Delta Barley and Point McKenzie
  Dairy agriculture projects, and the Alaska Seafood International plant in Anchorage,
ended in complete failure. It’s difficult for government to create profitable private sector
                            development by spending money!

  Alaskans also exhibit conflict about whether they really want resource development.
  Almost every resource development opportunity—mining, logging, cruise ships, sport
fishing lodges, fish farming—is opposed by local residents or other resource users who
                            prefer to keep things as they are.

                                                      The $50 million Alaska Seafood
                                                           International Plant in
                                                         Anchorage was sold to a
                                                       church group for $25 million.
                                                                                               44
Alaska’s economic future is uncertain.
              There are positives, negatives and unknowns.

Positives include the potential for further development of Alaska’s large and
varied resource base (oil, natural gas, coal, minerals, fish and forests), the
  growing value of Alaska’s scenic resources for tourism, the information
 revolution which is making it possible for companies and people based in
   Alaska to do business anywhere in the world, and the earnings of the
                              Permanent Fund.

   Negatives include declining oil production, the likelihood that federal
    spending in Alaska will decline significantly, and continued global
           competition from other natural resource producers.

We don’t know how resource discoveries, market prices, and political and
     technological changes may affect Alaska’s economic future.

                                                                                 45
Surprises
    Many of the most important events which have
     changed Alaska’s economy have been almost
completely unexpected. Examples include World War
  II, the 1964 earthquake, the discovery of the giant
 Prudhoe Bay oil field, the Exxon Valdez oil spill, the
   dramatic rise in oil prices in 1979 and in the mid
      2000s, and the recent world economic crisis.

There are probably more surprises in Alaska’s future,
which may have similarly unanticipated and dramatic
             effects. What will they be?
                         ??

                                                          46
You can also read