Southland Science Report - Water Quality in Southland - Thriving Southland
←
→
Page content transcription
If your browser does not render page correctly, please read the page content below

Southland
Science Report
Water Quality in Southland
4. What influences water quality in Southland
This section describes the main influences of water quality across Southland, and is focused on a high-level
region-wide viewpoint. For a brief summary of monitoring results at a catchment group scale please refer to
Appendix A. (The data in Appendix A is limited to the data available on the LAWA 3 website with state and trend
information. Additional information may be held by ES.) Fiordland catchments that drain to the west are not
considered in this work.

4.1 Climate
The climate of Southland is strongly influenced by the topography, especially the Fiordland Mountains, and by
the strong westerly flow of maritime weather that it receives directly from the Southern Ocean. Overall, the
region is relatively wet with between 800-1200mm of annual rainfall across the plains and extreme rainfall of
up to 8000mm a year in Fiordland. It is important to appreciate that climate varies in parts of Southland. For
example, relatively high rainfall close to Fiordland with significantly less average annual rainfall to the east.
Summer droughts do occur, for example during 2012/13; and in some years there were significant reductions
in annual average rainfall, for example in 20174. Southland receives less sunshine than the rest of New Zealand
and temperatures are generally lower with frequent frosts and snowfalls (Macara, 2013).

4.1.1 Climate change
Climate change is expected to bring many challenges and the need for adaption across many parts of society.
NIWA (Zammit et al., 2018) has undertaken climate change modelling for each region in New Zealand, including
Southland. Findings indicate that changing temperatures and rainfall patterns are likely to have significant
impacts on farming productivity in Southland. An increase in drought conditions is likely in the central-northern
parts of the region. Increases in dry days are projected for much of the Waiau catchment and large increases in
Potential Evapotranspiration Deficit (PED) are expected in the northern Mataura catchment.

Areas that currently rely on irrigation during dry months may find that there’s not enough water to go around.
Recharge patterns for aquifers will likely change with changing patterns in rainfall. Further, coastal aquifers may
be at risk of saltwater intrusion as sea levels rise, rendering them unsuitable for abstraction.

Increased rainfall is likely for much of the region during winter months. This will have implications for managing
nutrients and waste, particularly on dairy farms. Increased rainfall events will also affect surface flooding, which
could affect production on vulnerable land.

Another key element to climate change is the global movement of plant and animal pests. Warmer temperatures
and fewer frosts in Southland could result in increased numbers and fertility of invasive weeds. Farmers in
Southland may have to change to growing plant species more commonly grown further north at present.

Rising temperatures and drier summers also put forested areas at risk of wildfires. As well as the affecting
corporate growers, the increased risk of wildfires may affect farmers with planted blocks who rely on the sale of
timber to supplement their income.

Further details regarding the modelled future climate of the Southland region are outlined below.

Temperature changes

Temperatures will likely increase within a range of 0.5-1°C by 2040 and by 0.7-3°C by 2090. This is a broad range

3 LAWA = Land Air Water Aotearoa, www.lawa.org.nz Regional councils cooperate by uploading surface water and
groundwater quality data onto this website. Common sampling, reporting and data analysis methods are used.
4
    NIWA Annual Climate Summary 2017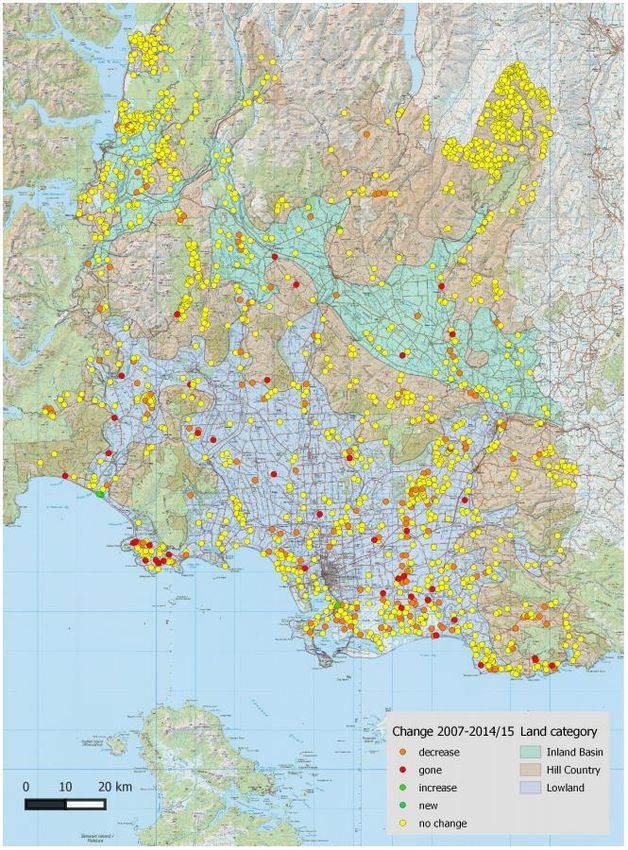
and reflects the range of uncertainty in the modelling. It is expected that Autumn will be the season that sees
the most change.

Extreme temperatures will also see change with the average number of hot days expected to increase with time
(0-10 days by 2040 and 5-55 days by 2090). A heatwave is defined by NIWA as being a period of three or more
consecutive days, whereby the maximum daily temperature is higher than 25oC. Southland has three main sites
that currently experience the most heatwaves: Te Anau, Riversdale and Lumsden. Heatwaves in these areas are
predicted to increase from the current three days per year to about 25 days per year by the end of the century.
Therefore, the risk of drought is likely to increase in these areas as the century progresses.

The number of frost days is expected to decrease in the region by 0-5 days by 2040 and by 10-20 days by 2090.

Rainfall patterns and drought

Predicted changes in rainfall patterns are expected to show marked seasonality and variability across the region.
Annual rainfall for the region as a whole is expected to increase slightly by 2040 at 0-5% while the longer-term
outlook (2090) is for an increase of 5-20% with the largest increase in the northern part of the region. Despite
the increase in annual rainfall the number of wet days is expected to decrease by up to 10 days across most of
the region and by 10-20 days in the Waiau River catchment. It is important to appreciate that specific catchments
are likely to have specific responses to climate change that may be different than the regional averages.

Across both the 2040 and 2090 predictions the number of heavy rain days (>50mm/day) are expected to increase
throughout Southland, apart from a small part of the Eastern Waiau catchment.

‘Dry days’ are defined as days with less than 1mm rainfall. Currently the northern Mataura catchment has the
highest number of dry days, with an annual average of 225-250 days. The central part of Southland has an annual
average of 200-225 dry days per year, while the western Waiau catchment has an annual average of 175-200
dry days per year. Southern Fiordland has the fewest dry days with an annual average of 100-150 per year.

Predictions for the future are mixed. Some parts of Southland will likely experience more dry days, while others
have fewer (i.e., are wetter). By 2040, up to 10 fewer dry days per year are expected for central parts of the
region, as well as parts of northern and western Fiordland. Up to 10 more dry days per year are expected for
much of the Fiordland and Waiau catchments, the southern Mataura and Oreti catchments, and Stewart Island.

By 2090 most of the region will experience a decrease in dry days, outside of the Waiau catchment, eastern
Fiordland, and Stewart Island. The largest increases are projected for the eastern Waiau catchment, where 10-
20 more dry days per year are expected.

Meteorological drought (assessed using Potential Evaporation Deficit) is expected to increase mostly in the
central-northern part of the region across all time periods and scenarios. Potential Evaporation Deficit is
expected to increase by 40-80mm per year for most of the region by 2040 and by up to 100mm by 2090 under
the highest emissions scenario modelled.

Hydrological regime

The climate change scenarios were used to model potential effects on the hydrological regime in the region.
Overall spring flows are expected to be slightly higher, summer flows are expected to slightly decrease, while
autumn and winter flows are expected to increase.

Impact on low flows are expected to be variable across the region with flows in Fiordland and the Waiau River
catchment expected to increase and for the rest of the region expected to decrease, apart from coastal areas of
the Ōreti and Matāura catchments.
Floods, as characterised by the Mean Annual Flood, are expected to increase in size across the whole region.

4.2 Geology and soils
Southland has a varied and complex geology and topography. The Fiordland mountains dominate the western
third of the region and are comprised of hard bedrock that has been severely glaciated and formed into very
steep terrain. This area is largely in conservation land and covered with forest or alpine vegetation. Another
geological feature of significance is the Southland Syncline that runs from the Takitimu Mountains across
Southland to the coast at the Catlins. This forms the Hokonui Hills that separate the two areas of plains present
in Southland. The Southland Plains extend from the Waiau River in the west across to the border with Otago
region to the east of Gore. North of the Hokonui Hills are the Waimea Plains that flank the mid-reaches of the
Ōreti and Matāura Rivers (Grant, 2020).

Southland’s complex geology is reflected in its soils. Environment Southland recognises about 170 different soil
types in Southland that have different physical, chemical and biological components. Soil structure is integral
to its functioning, affecting water movement and storage, plant rooting depth and the availability of water and
nutrients, as well as the ability of soil to resist erosion. Soils also differ in how they take up, store and transport
the building blocks of life, including carbon, nitrogen and phosphorus. For more information on Southland soils
and how they function, see Environment Southland’s physiographics reports.

4.3 Hydrology and hydrogeology
Other than the catchments that drain to the west in Fiordland (these are not considered in this study), the
Southland Region is drained by four major rivers: the Waiau River, the Ōreti River, the Matāura River, and the
Aparima River. The first three have their headwaters in the high mountainous areas (Fiordland, Thomson
Mountains and Eyre Mountains) in the northwest of the region; and the Aparima begins in the Takitimu
Mountains. Higher in the catchments where there is plentiful sediment supply the rivers form a braided
morphology, but this quickly changes to a wide meandering morphology as they flow across the gently sloping
plains towards the south coast (Mager & Horton, 2018). Along with these main rivers there are many thousands
of kilometres of natural streams and artificial drains that originate in the mountains or on the plains and feed
into the main rivers.

4.3.1 Streams and rivers
The morphology of streams and rivers has been changed dramatically in parts of lowland Southland. In order to
hasten water flow from the land to the coast, and bring more land into primary production, many streams and
rivers have undergone substantial channelisation and straightening works. For example, much of the lower
Waihopai River has been straightened and flood banks built along its margins. Streams draining into the lower
Aparima River have also undergone straightening in order to manage flooding in the lower catchment.

Southland's largest river-straightening project was the Makarewa Scheme. To protect flood-prone land, the river
was straightened to hasten drainage. This was done by short-cutting its multitude of meanders across very flat
land. A hundred miles of river was channelled using dragline excavators between 1965 and 1968. The river was
shortened by about 80.5 kilometres 5.

The Waiau River has also undergone a significant change in terms of flow. The Waiau River used to be the largest
river in the region, and second largest in the New Zealand, with a mean flow of 550m3/s (Mager & Horton, 2018)
but since the commissioning of the Manapouri Power Scheme in the 1970’s most of its flow is diverted through

5

    https://www.lawa.org.nz/explore-data/southland-region/river-quality/waihopai-stream/
    http://www.stuff.co.nz/southland-times/culture/in-the south/10622762/Crewman-takes-a-punt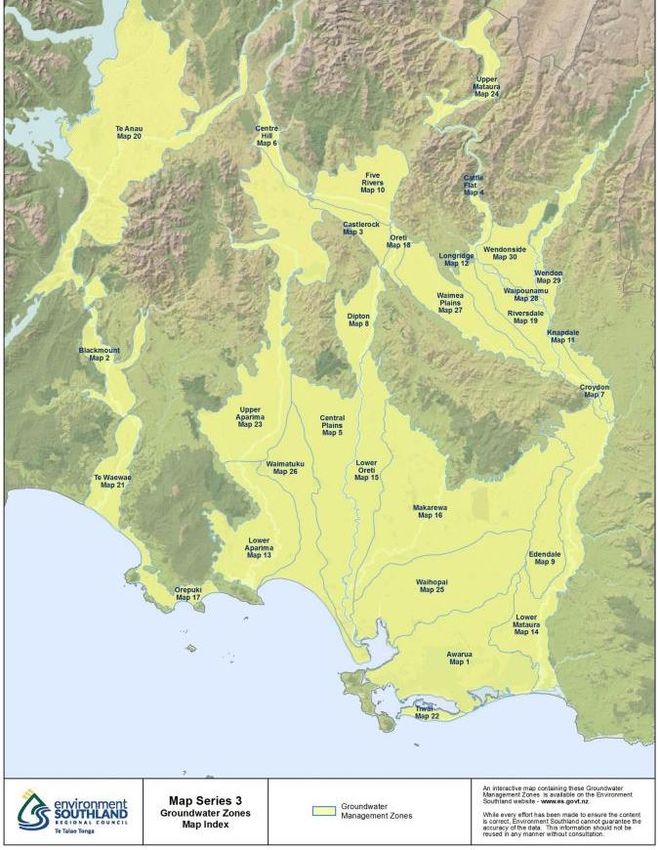
the power station to Doubtful Sound. Now the mean flow is lower at 167 m3/s and consequently the
downstream river morphology has changed (Mager & Horton, 2018).

4.3.2 Artificial drainage
Before development for agriculture, much of lowland Southland was covered in wetlands. There are about
18,240km2 of agricultural land in Southland, of which about 13,870 km 2 (about 76%) are located in areas that
were historically wetlands and now have some form of artificial drainage. Artificial drainage is essential to
lowering the water table, making areas of former wetland suitable for agriculture (Pearson, 2015).

Pearson (2015) looked at the extent of artificial subsurface drainage in Southland. She concluded that artificial
subsurface drainage systems cover about three quarters of agricultural land in Southland. In Southland, an
average of approximately 120 metres of tiles per hectare are required in mole-tile systems to achieve adequate
drainage.

Areas of high to very high density drainage systems are found mostly in the Central Southland Plains areas and
around the Waituna wetland. Artificial drainage networks are most active during wetter months when they
transport large volumes of soil water to nearby areas of surface water, such as ditches or streams.

4.3.3 Groundwater
Groundwater is sub-surface water that sits in saturated soils and geological materials located below the water
table. Aquifers are areas of where groundwater exists in sufficient and accessible quantities to be abstracted for
human use. We have three main types of aquifer in Southland: unconfined, semi-confined and confined aquifers
Figure 2).

Figure 2: Three main aquifer types in Southland: unconfined, semi-confined and confined. Source:
Environment Southland

Unconfined aquifers are directly connected to the land above. They tend to have a shallow water table and can
be highly connected to streams and rivers. Unconfined aquifers can be divided into three main types:

    1.   Riparian aquifers: Located under the recent floodplains of major river systems. These aquifer systems
         exhibit a high degree of interaction with surface water (recharge and discharge), which can influence
         the quality and quantity of both ground- and surface water. Riparian aquifers can be found along the
         margins of all Southland's major rivers.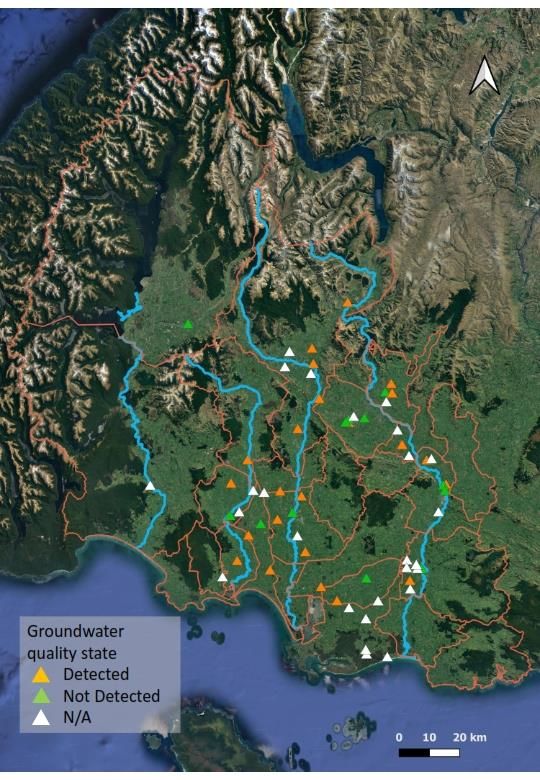
Figure 3: Riparian aquifer showing connectivity to land (via deep drainage) and surface water. Source:
Environment Southland

    2.   Terrace aquifers: Located under elevated gravel terraces along the margins of river valleys. They usually
         have little interaction with surface water. However, some terraces have large springs where
         groundwater resurfaces at the terrace edge. Some of these springs are significant in size and during
         low flow periods can contribute a significant proportion of stream baseflow in some areas.

Figure 4: Terrace aquifer showing relationship with riparian aquifer, connectivity to land (via deep drainage),
and surface water via springs. Source: Environment Southland

    3.   Lowland aquifers: Located in the remnants of older, highly weathered gravel beds. They are criss-
         crossed by numerous small streams.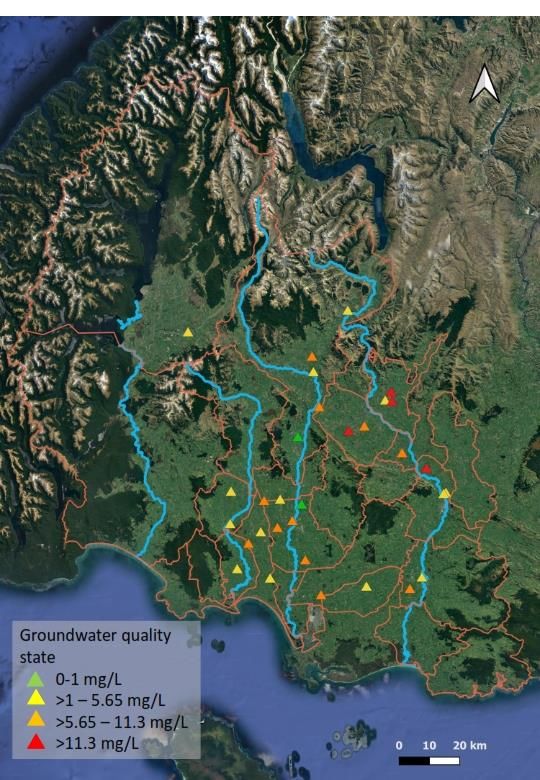
Figure 5: Lowland aquifer showing relationship with riparian aquifer, connectivity to land (via deep drainage),
and surface water via small streams. Source: Environment Southland

Confined aquifers are located at depth, often sitting below shallow unconfined aquifers. They are bounded
above and below by rock or other largely impermeable materials. Semi-confined aquifers differ from confined
aquifers by having a top layer that is of low permeability. Water is able to flow very slowly between a semi-
confined and an unconfined aquifer located above.

4.4 Land use
Southland’s pre-human vegetation was comprised of forest, scrub, and wetland. The early Polynesian settlers
cleared areas of forest by burning and were replaced by tussock. Early European settlers cleared much of the
remaining forest from the plains and began to artificially drain wetter areas and plant exotic grasses (Newson,
2000; Grant, 2020).

The general land cover pattern for the region has been relatively stable for at least the last 25 years, with some
notable exceptions (Table 1). For example, there has been a 32% increase in exotic forest and artificial bare
surfaces increased 43%.The conservation area in the western third of the region has remained the same and the
broad land use class of exotic grassland has dominated the area of the Southland Plains for the same period as
illustrated in the table below (LAWA, 2020). Since 1985 agricultural expansion into new areas has largely ceased
but change has still occurred with the significant shift from sheep and beef farming to dairy farming (Ledgard,
2013).
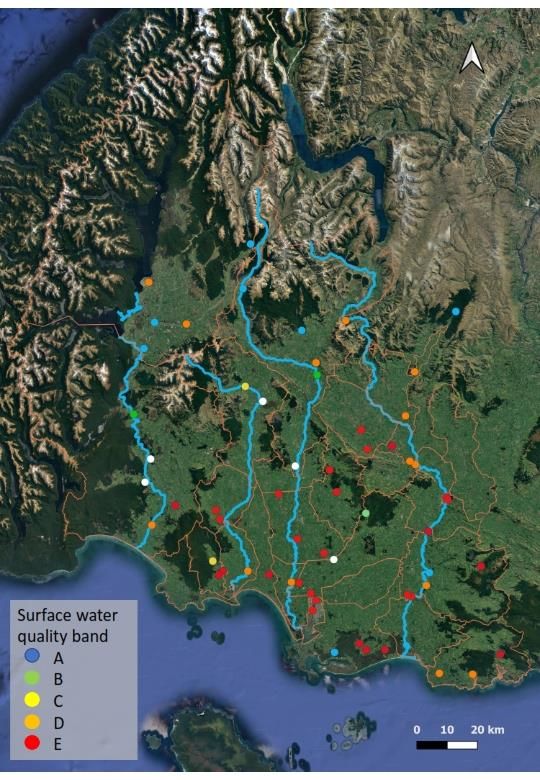
Table 1: Southland Region landcover class change between 1996 and 2012 (LAWA, 2020)

 Land cover Class                                                                     Area Change

                                                                                 ha                   %

 Indigenous forest                                                               -1,497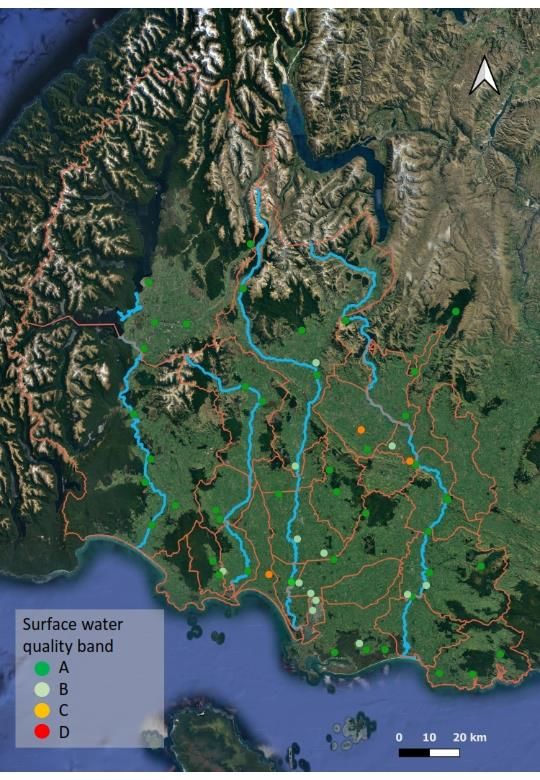
The pattern of changing water quality between mountains and sea can clearly be seen in Figure 6, which shows
the E. coli grades under the NPSFM 2020 National Objectives Framework (NOF) “numeric attribute states”6 for
the monitored sites across Southland. Sources of this contamination are mainly associated with run-off from
agricultural land and concentrations are usually higher following rainfall. Faecal source tracking by Moriarty et
al. (2019a-d) across a wide range of sites found that the predominant source of faecal indicator bacteria was
ruminant animals (sheep and cattle) and wildfowl, with occasional human sources. Often the proportion of
ruminant pollution will increase following rainfall compared to under baseflow conditions that are dominated
by wildfowl signatures (Moriarty et al., 2019a-d). It is also important to appreciate that the risk to human health
may differ between different faecal sources.

It is important to appreciate that under the NPSFM, microbiological water quality for human contact is expressed
as risk levels rather than as a simple “safe” or “not safe”. However, the data represented in Figure 6 are generally
interpreted as indicating that bands D and E indicate a significant infection risk.

Nitrate-nitrogen concentrations in surface waters are illustrated in Figure 7 with total oxidised nitrogen data
ranked against the NPS-FM 2020 NOF numeric attribute states for nitrate-nitrogen. Total oxidised nitrogen (TON)
has been used here as a proxy for nitrate-nitrogen as TON is the sum of nitrate and nitrite. Nitrite is generally a
very small fraction of the TON concentration in rivers, so TON is taken to be approximately equivalent to nitrate-
nitrogen concentrations.

The predominant reference point used for TON (nitrate-nitrogen) used in this report is the NPSFM 2020 water
quality guideline (the NPSFM terminology is “numeric attribute state”) for nitrate-nitrogen. This relates to
nitrate toxicity rather than nitrogen as a nutrient source for plant (periphyton, macrophyte and phytoplankton)
growth. Establishing nutrient concentrations targets for surface water will be an important part of catchment
water quality management and we understand that Environment Southland is likely to propose such targets in
the forthcoming Southland Water and Land Plan – proposed plan change (SWLPPC). However, currently there
are no national or regionally specific nutrient concentration targets. The draft NPSFM included a dissolved
inorganic nitrogen national bottom line of 1.0 mg/L for ecosystem health. This proposal was not included in the
final NPSFM.

Therefore, this report uses the current NPSFM nitrate-nitrogen (toxicity) water quality numeric attribute state
in the NPSFM 2020 and specifically the National Bottom Line (annual median 2.4 mg N/L and annual 95th
percentile 3.5 mg N/L) as a primary nitrogen reference.

There is a risk that by using this reference point, concentrations in some catchments might indicate the absence
of any nitrogen issues while in reality the concentrations may well be high enough to cause significant plant
growth in the catchment. However, it is important to appreciate that even in catchments where nitrate-nitrogen
concentrations do not breach the nitrate-nitrogen toxicity National Bottom Line, they are likely to still have
significant nutrient related water quality issues such as periphyton extent and estuary eutrophication7.
Conversely, if a catchment has nitrate-nitrogen concentrations that exceed the National Bottom Line, we
consider that those catchments are likely to be identified as a priority for nitrogen loss reduction.

There are some catchment areas that are either not represented by existing monitoring or are under-

6 NPSFM NOF = National Policy Statement National Objectives Framework. This provides for “numeric attribute states”
(effectively national water quality standards) to be set via regional plans. The report uses the term “water quality standards
to refer to both regional plan standards and NPSFM numeric attribute states.
7
 “The trophic status of a lake or estuary refers to the primary productivity (amount of algae) produced in the
water and the amount of nutrients (P and N) in the water. Oligotrophic waters usually have low primary
productivity (high water quality and few algae) and are nutrient poor, while eutrophic waters have high
primary productivity (low water quality and frequent algal blooms) due to excessive nutrients. Mesotrophic
waters lie somewhere in between the two states. Eutrophication is an increase in the nutrients available in a
waterbody which can subsequently increase primary productivity and degrade water quality, leading to a
reduction in mahinga kai habitat and survival.” NIWA. https://niwa.co.nz/our-
science/freshwater/tools/kaitiaki_tools/impacts/nutrients/eutrophication
represented in the current network. This has made it challenging to provide catchment group specific
information and conclusions. It is important to have good data and to maintain a long-term monitoring
programme to be able to both understand water quality issues and to track changes over time.
Figure 6: Southland water quality monitoring sites graded according to the NPS-FM 2020 National Objectives
Framework category: E. coli for Human Contact (Appendix 2A, Table 9). Data from LAWA 2018 state data set
(LAWA, 2020)
Figure 7: Southland water quality monitoring sites graded according to the NPS-FM 2020 National Objectives
Framework category: Nitrate (Toxicity), River ecosystem health (Appendix 2A, Table 6). Data from LAWA 2018
state data set (LAWA, 2020)
5.2 Groundwater quality
Groundwater quality varies significantly across the region and is affected by many variables. Many of the
unconfined aquifers are relatively shallow and have high water tables (i.e. groundwater can lie close to the
surface, particularly during wet periods). The unconfined nature means they are often recharged directly by
rainfall that filters through the overlying materials. This process can provide a conduit for contaminants to move
down into the aquifer where they can persist and be transported down gradient. Key contaminants of concern
for groundwater are E. coli and nitrate-nitrogen. As there are no groundwater quality objectives in the NPS-FM
2020 we have used the Drinking Water Standards New Zealand (2018) (DWSNZ) for assessment in this report.
These standards are referred to in Objective 8 of the Region-Wide Objective in the proposed Southland Water
and Land Plan (pSWLP) as the required standard until such time as any freshwater objectives are established
under the Freshwater Management Unit processes.

E. coli is present in many of the monitored wells across the region and often does not meet the DWSNZ
thresholds as shown in Figure 8 below. This is a human health threshold designed around the requirements for
providing safe drinking water, as many rural properties and communities may source their domestic water
supply from groundwater.

Nitrate-nitrogen is present in concentrations that strongly indicate nitrate leaching from pastoral land use in all
but one of the 30 monitoring bores included in this analysis as shown in Figure 9. Of the remainder there are 6
that have been shown to exceed the DWSNZ threshold more than 25% of the time. These are clustered across
the Waimea Plains around the Balfour and Wendonside areas. The trend analysis on LAWA8 indicates that
approximately half of the sites are showing a degrading trend in quality. In cases where there are long aquifer
residence times it could take significant time to improve nitrate-nitrogen concentrations.

This interpretation is based on readily available data from a range of bores used in Southland to monitor
groundwater quality. There are some limitations in the monitoring that mean our interpretations can only be
tentative. For example, it is apparent from our brief primarily desktop review of the bore: type, depth, wellhead
protection, and locations, that the reasons for initially establishing the bores varies considerably. Some bores
have been located close to known locations of effluent application to endeavour to assess potential local effects.
Some bores used historically have had inadequate wellhead protection (See Appendix B) and may have acted as
conduits for contaminated surface water to enter groundwater. Some of these bores are not monitored
frequently enough to enable full statistical analyses. Very few bores appear to have been established as long-
term (i.e., to be used for 50+ years) bores to monitor regional groundwater quality. The ideal would be for long-
term strategically located bores to be established on regional council owned land or land with an access
easement that provides for groundwater quality monitoring by the regional council.

This data and location-specific investigations by Environment Southland into groundwater quality in various
locations strongly indicate that nitrate concentrations in Southland groundwater are a significant issue, both in
terms of groundwater used as a source of drinking water and as a source of recharge water for rivers. However,
the limitations outlined above make it challenging to draw definitive conclusions about the state and trend of
regional groundwater quality in some parts of Southland.

8 LAWA = Land Air Water Aotearoa, www.lawa.org.nz Regional councils cooperate by uploading surface water and
groundwater quality data onto this website. Common sampling, reporting and data analysis methods are used.
Figure 8: State of E. coli in groundwater in Southland. (Sites where E. coli has been detected are not suitable
as a source of untreated drinking water.)
Figure 9: State of Nitrate-Nitrogen in groundwater in Southland showing median concentrations relative to
the DWSNZ maximum acceptable value of 11.3 mg/L
5.3 Wetlands
Wetlands are very important landforms for the protection of biodiversity and their ability to provide ecosystem
services (Dare & Ewans, 2018). Southland has in the past had extensive wetland systems of various types but
since the arrival of Europeans, and due to their tendency to want to drain land for agriculture, approximately
90% of the wetlands have been lost. With so few wetlands remaining it is not unreasonable to consider all
remaining wetlands to be significant with some being considered more important than others based on the
extent of the loss of each type (Clarkson et al, 2011). However, it has been found that wetlands in Southland
are still being lost despite many legislative and policy tools being in place to try to protect them (Dare & Ewans,
2018). Dare & Ewans found that wetland loss was highest in lowland areas where approximately 1,165 ha was
lost between 2007 and 2014/15, or a rate of around 1.5% lowland areas as shown in Figure 10. This is a surprising
and concerning statistic and possibly is indicative of the misunderstanding by some of both the importance of
wetlands and in fact what landforms and vegetation constitute being a wetland.
Figure 10: Change in mapped wetland areas between 2007 and 2014/2015 (from Dare & Ewans, 2018)
5.4 Estuaries
Estuaries are an extremely important part of the overall landscape of Southland. They are the receiving
environment of much of the material carried by the rivers so are therefore impacted by activities in the upstream
catchment. As such the health of the estuary can be an indicator of potential upstream issues. Estuaries support
aquatic and terrestrial ecosystems and there are five important components that work together to do this: water
quality, water quantity, habitat, aquatic life, and ecological processes (ES, 2020).

As estuaries are the final receiving environment for sediment and nutrient load from the region’s rivers, they
are naturally productive environments. Estuaries have developed over millennia to process the natural loads
coming off their catchment. However, when this load is changed through introduction of additional nutrients or
sediment, there can be significant adverse effects. Some estuary systems are more sensitive than others to
these changes (ES, 2020).

Estuaries in Southland have been grouped according to their level of susceptibility, or risk of becoming
eutrophic. Some estuaries have a higher risk of eutrophication than others, depending on catchment load, level
of river inflow and volume, levels of nutrient accumulation, estuary size, shape and depth, and tidal influence
(ES, 2020).

Increases in sediment and nutrient loads to the estuaries that are the result of changes in upstream land use
practices are significant drivers of degradation of estuary health (Green, 2015). The influx of nutrients can lead
to proliferations of phytoplankton and macroalgae (Green, 2015) which can lead to poor trophic conditions.
Shallow estuaries, and especially Intermittently Closed or Open Lakes and Lagoons (ICOLLs), are most susceptible
to such changes. Figure 11 below shows Southlands monitored estuaries, all of which are shallow and two of
which (Lake Brunton and Waituna Lagoon/Waipārera) are shallow ICOLLS.

Figure 11: Southland’s monitored estuaries (from ES, 2020)

Table 2 shows that in the most recent assessment of estuary health by Environment Southland (ES, 2019) there
are three estuaries that are classed as having high overall eutrophic risk (Waiau Lagoon/Te Wae, Lake Brunton
and Waituna Lagoon/Waipārera). The New River Estuary and the Jacobs River Estuary are classed as at moderate
risk but are clearly eutrophic and the Waikawa Estuary is showing signs of stress. Once an estuary system has
entered a eutrophic state it can be difficult to reverse that due to the complexity of the estuary system itself and
the likelihood of significant lag times between land use management practice changes and changes in sediment
and nutrient concentrations in the contributing waters.

The results for the low eutrophication risk Toetoes Estuary strongly indicates that despite the well flushed nature
of the estuary it is exhibiting signs of eutrophication with low sediment oxygen concentrations and significant
reductions in seagrass coverage.

Table 2: Estuary health monitoring results as at 2018 (from ES (2019))

                                         Nutrients in   Oxygen in         Macrophyte
         Estuary            Soft Mud                                                       Sea grass      GEZ*
                                          sediment      sediment            cover
                                            High Eutrophication risk
 Waiau Lagoon/ Te
 Wae
 Lake Brunton
 Waituna Lagoon/
                                                                         N/A
 Waipārera
                                          Moderate Eutrophication Risk
 New River Estuary
 Jacobs River Estuary
 Waikawa Estuary
 Haldane Estuary                                                                          None
                                                                                          observed
 Freshwater Estuary
                                             Low Eutrophication Risk
 Waimatuku Estuary
 Toetoes Estuary

                    Key:               Very Good
                                       Good
                                       Fair
                                       Poor
 * Gross Eutrophic Conditions (GEZ) occur when estuaries have the combined effects of high mud content, a
 shallow RPD (50% cover)

5.5 Water quality and biodiversity
Freshwater has a critical role in providing for New Zealand’s diverse freshwater species and their habitats.
Changing land use, introduced invasive species, changes in waterway forms, and reduced flows collectively
increase pressure on freshwater bodies. In turn, this affects freshwater fish, invertebrates, plants, and birds
reliant on functioning freshwater ecosystems.

The landscape of the Southland region has been significantly modified since the arrival of humans. The least
modified area is the mountains of Fiordland and other mountainous areas, though these have still been
impacted by introduced fauna and flora. The remainder of Southland including the plains and lower hill country
has been significantly changed from a variety of vegetation types that supported a wide range of fauna to what
is now almost a monoculture of exotic grassland. This will have had detrimental effects on the biodiversity of
the area and resulted in significant species loss over time. It is important that where there are remnants of
natural fauna and flora that they be preserved and protected both to maintain the variety of species but also for
the ecosystem services values they hold.

One of the most impacted landform types is wetlands, which have been dramatically reduced in extent through
land drainage for agriculture. This is particularly significant due to the high level of ecosystem services provided
by wetlands for processing of nutrients and sediment.
6. Managing freshwater quality in Southland
Environment Southland has obligations under the Local Government Act (LGA) (Local Government Act, 2002) to
provide for community needs now and into the future. As a regional council, Environment Southland is
responsible for managing the natural and physical resources of Southland, including air, land, water and the
coast.
As discussed in the sections above, Southland is characterised by its diverse geological landscapes, climate, soils,
and hydrogeology. Therefore, there cannot be a ‘one size fits all’ approach to managing freshwater quality in
the region. In order to help manage freshwater quality across a diverse landscape, Environment Southland has
divided the region into:
• Freshwater management units (FMUs)
• Surface water management units
• Groundwater management zones (GMZs)
• Physiographic zones
These are discussed in more detail below.
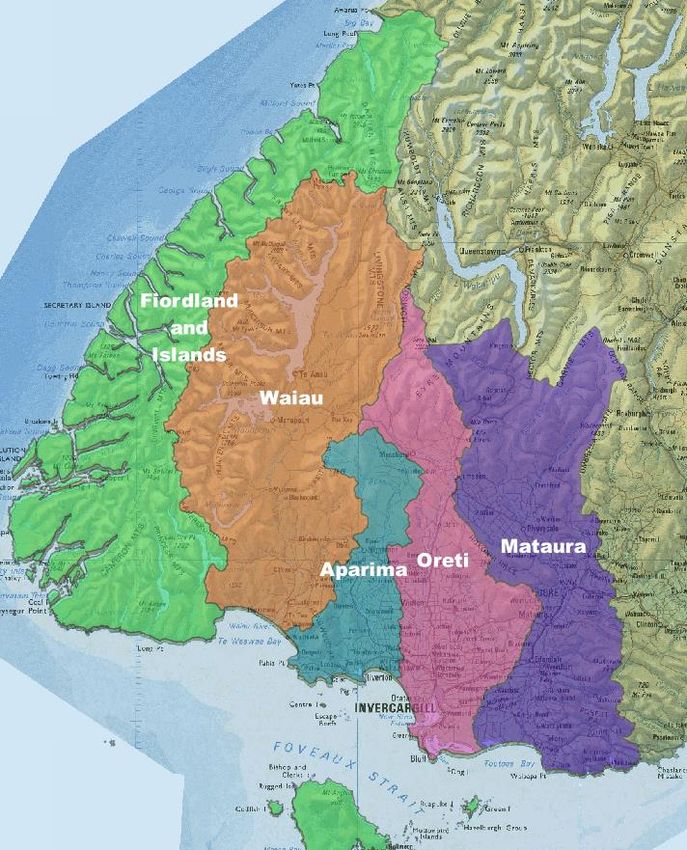
6.1 Freshwater management units (FMUs)
Freshwater management units (FMUs) are used nationally to plan and manage freshwater. The Ministry for the
Environment describes a freshwater management unit as `the water body, multiple water bodies or any part of
a water body determined by the regional council as the appropriate spatial scale for setting freshwater
objectives and limits and for freshwater accounting and management purposes.’ Environment Southland has
divided the Southland region into five FMUs: Fiordland and Islands, Waiau, Aparima, Ōreti and Matāura, shown
in Figure 13. The Environment Court has recently issued an interim decision 9 on the pSWLP that strongly
indicates that the Waituna Lagoon/Waipārera will be made a separate FMU.
Catchment groups are located within different FMUs. Each FMU has a different set of characteristics that
influence freshwater quality. Therefore, catchment groups in one FMU may face different challenges to groups
located in other FMUs. See Appendix A (section 14) for more detail.
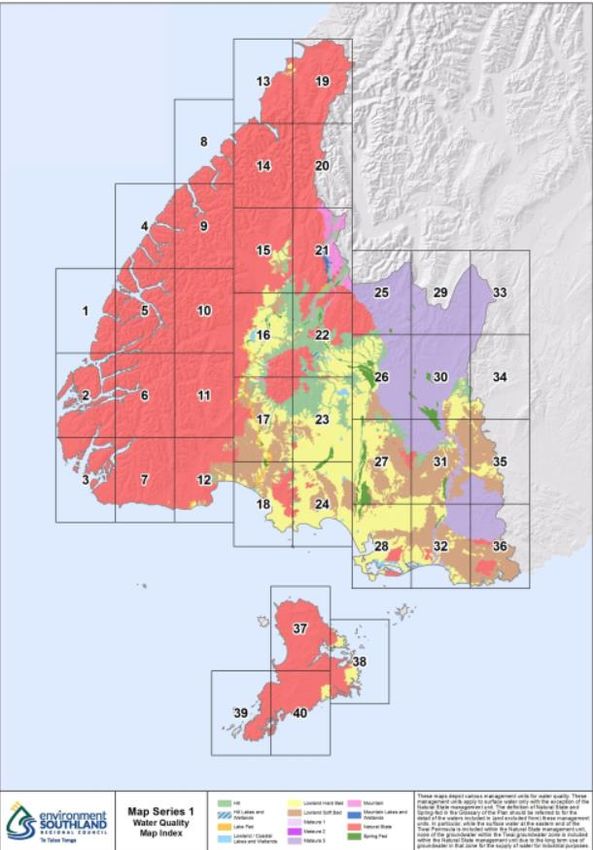
6.2 Surface water management units
The pSWLP refers to “surface water management units” (see Figure 16) such as lowland soft bed, lowland hard
bed, mountain and hill, and the pSWLP also includes surface water quality standards that are linked to the
specified surface water management units. The Environment Southland GIS website (https://maps.es.govt.nz/)
also refers to 17 surface water management zones.
6.3 Groundwater management zones (GMZs)
Southland’s unconfined aquifers have been divided into 30 groundwater management zones (GMZs) based on
areas of similar hydrogeological characteristics (see Figure 14). Zones were delineated based on the presence
of unconfined (or semi-confined) aquifers hosted in Quaternary alluvium.
The management zones differ in terms of water recharge, water discharge, water availability, storage volumes,
9 https://www.environmentcourt.govt.nz/assets/Documents/Publications/2019-NZEnvC-208-Aratiatia-Livestock-Limited-v-
Southland-Regional-Council.pdfwater quality, and surface connectivity. Combined, these factors affect how Environment Southland manages
the use of groundwater resources. Note that separate management criteria apply to unconfined and confined
aquifers.
6.4 Physiographic zones
Environment Southland uses a physiographic concept to assist in understanding how contaminants build up and
move through different soil types, through areas of groundwater and into surface waterways. 10. This approach
involves integrating information particularly on climate, geology, topography and soils to create specific
physiographic zones that have common features in terms of how contaminants move to water.
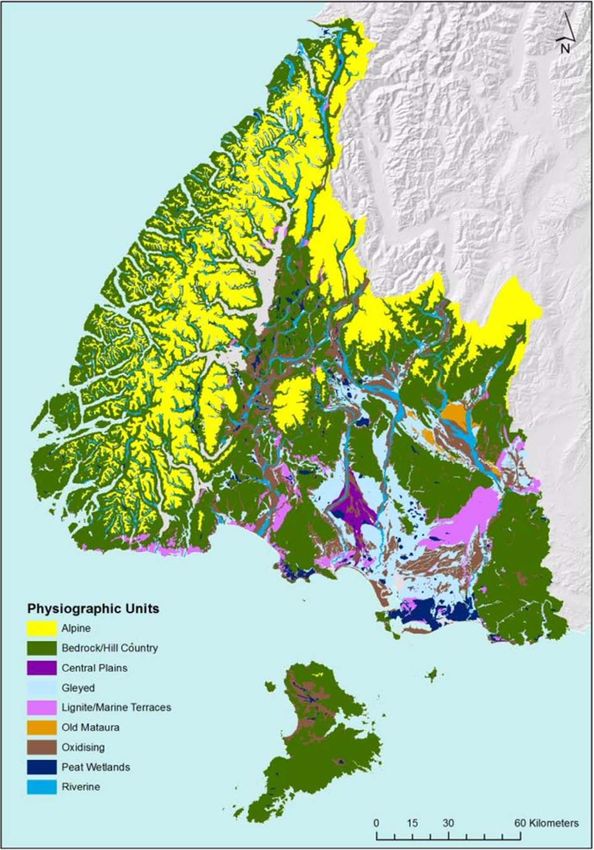
There are nine physiographic zones for Southland (Figure 15):
• Alpine
• Bedrock-hill country
• Central Plains
• Gleyed
• Lignite-marine terraces
• Old Mataura
• Oxidising
• Peat wetlands
• Riverine
Contaminants in some zones may not be such a problem in others. Understanding the key transport pathways
for contaminants helps to understand these differences between zones. The four main transport pathways are
overland flow, artificial drainage, deep drainage, and lateral drainage. Natural bypass flow also occurs in areas
where water can drain vertically through the soil profile via cracks and fissures. Transport pathways also
influence contaminant attenuation processes i.e., processes that can reduce the amount of contaminants that
eventually enter groundwater and/or surface water.
Figure 12: Example of contaminant pathways and attenuation for the Peat Physiographic Zone. Source:
Environment Southland
10
https://www.es.govt.nz/community/farming/physiographics/introduction-to-physiographicsFigure 13: The five freshwater management units (FMUs) in Southland as at November 2020
Figure 14: Environment Southland Groundwater Management Zones from the proposed Southland Water and
Land Plan
Figure 15: Environment Southland’s physiographic zones from Hughes et al. 2016
Figure 16 Surface water management units specified in the pSWLP
You can also read