Particulate Matter in the United Kingdom - Summary AIR QUALITY EXPERT GROUP - UK Air
←
→
Page content transcription
If your browser does not render page correctly, please read the page content below
AIR QUALITY EXPERT GROUP

Particulate Matter in
the United Kingdom
Summary

Prepared for:
Department for Environment, Food and Rural Affairs;
Scottish Executive; Welsh Assembly Government; and
Department of the Environment in Northern Ireland
This is a summary of the second report produced by the Air Quality Expert Group.

United Kingdom air quality information received from the automatic monitoring
sites and forecasts may be accessed via the following media:
Freephone telephone helpline 0800 556677
TELETEXT page 156
Website: http://www.airquality.co.uk
            http://www.defra.gov.uk/environment/airquality/

Department for the Environment, Food and Rural Affairs
Nobel House
17 Smith Square
London SW1P 3JR
Telephone: 020 7238 6000
Website: www.defra.gov.uk

© Crown copyright 2005

Copyright in the typographical arrangement and design rests with the Crown.

This publication may be reproduced free of charge in any format or medium
provided that it is reproduced accurately and not used in a misleading context.
The material must be acknowledged as Crown copyright with the title and
source of the publication specified.

This document is also available on the AQEG website at:
http://www.defra.gov.uk/environment/airquality/aqeg

Published by the Department for the Environment, Food and Rural Affairs.
Printed in April 2005 on material containing 80% post-consumer waste and
20% elemental chlorine-free pulp.

Product code PB10580a ISBN 0-85521-144-X

AQEG is Professor Mike Pilling (Chairman); Professor Helen ApSimon; Dr David
Carruthers; Mr David Carslaw; Dr Roy Colvile; Professor Richard Derwent OBE;
Dr Stephen Dorling; Professor Bernard Fisher; Professor Roy Harrison OBE;
Dr Mathew Heal; Professor Duncan Laxen; Dr Sarah Lindley; Dr Ian McCrae;
Mr John Stedman; Professor Mike Ashmore; Dr Mike Jenkin; Dr Peter Woods;
Mr Stephen Moorcroft; Dr Tim Murrells; Dr Paul Quincey; and Mr Ken Stevenson.

   When referencing this document, please use the following phrasing:
   AQEG (2005) Particulate Matter in the UK: Summary. Defra, London.
1

    Introduction                                   What is particulate matter?
The Air Quality Expert Group (AQEG) was        Airborne particulate matter is made up of
set up in 2002, following the publication of   a collection of solid and/or liquid materials
the ‘Air Quality Strategy for England,         of various sizes that range from a few
Scotland, Wales and Northern Ireland’,         nanometres in diameter (about the size of
which describes the plans drawn up by the      a virus) to around 100 micrometres (100
Government and Devolved Administrations        µm, about the thickness of a human hair).
to protect and improve air quality in the      It consists of both primary components,
United Kingdom (UK).                           which are released directly from the source
                                               into the atmosphere, and secondary
AQEG aims to help the UK Government            components, which are formed in the
tackle air pollution by examining where        atmosphere by chemical reactions.
pollutants come from and what their            Particulate matter comes from both human-
concentrations are in the UK.                  made and natural sources. It contains a
                                               range of chemical compounds and the
This is a Summary of AQEG’s second report,     identity of these compounds provides clues
Particulate Matter in the United               to its origin (see Tables 1 and 2).
Kingdom. We have included a glossary at
the back to explain certain terms (these are   Measurements of the concentration of
shown in bold the first time they occur in     particulate matter in air are made by
the document).                                 recording the mass of particulate matter
                                               in one cubic metre of air, using the units
                                               micrograms per cubic metre, µg m–3.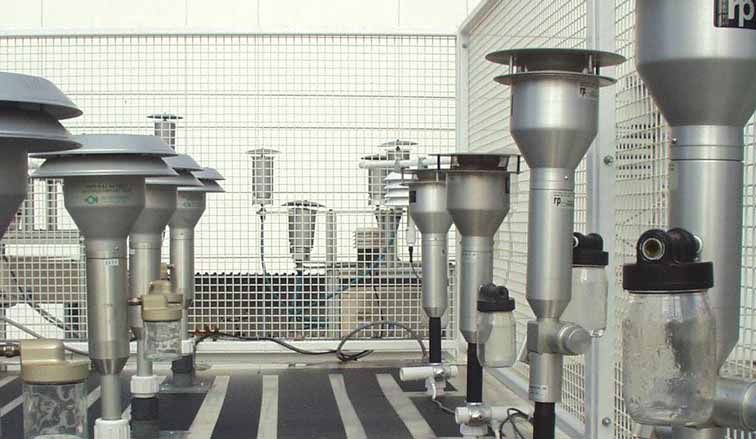
2

Particulate matter is classified according                             concentration of particles that are less than
to its size and this classification is used                            or equal to 10 µm in diameter; similarly PM2.5
in concentration measurements. For example,                            describes the concentration of particles that
PM10 is – to a good approximation – the                                are less than or equal to 2.5 µm in diameter.

Table 1. Components of particulate matter.
    Primary components                        Sources
    Sodium chloride                           Sea salt.
    Elemental carbon                          Black carbon (soot) is formed during high temperature combustion of fossil
                                              fuels such as coal, natural gas and oil (diesel and petrol) and biomass fuels such
                                              as wood chips.
    Trace metals                              These metals are present at very low concentrationsand include lead, cadmium,
                                              nickel, chromium, zinc and manganese. They are generated by metallurgical
                                              processes, such as steel making, or by impurities found in or additives mixed
                                              into fuels used by industry. Metals in particles are also derived from mechanical
                                              abrasion processes, e.g. during vehicle motion and break and tyre wear.
    Mineral components                        These minerals are found in coarse dusts from quarrying, construction and
                                              demolition work and from wind-driven dusts. They include aluminium, silicon,
                                              iron and calcium.

    Secondary components                      Sources
    Sulphate                                  Formed by the oxidation of sulphur dioxide (SO2) in the atmosphere to form
                                              sulphuric acid, which can react with ammonia (NH3) to give ammonium sulphate.
    Nitrate                                   Formed by the oxidation of nitrogen oxides (NOx – which consists of nitric oxide
                                              (nitrogen monoxide, NO) and nitrogen dioxide (NO2) in the atmosphere to form
                                              nitric acid, which can react with NH3 to give ammonium nitrate. Also present
                                              as sodium nitrate.
    Water                                     Some components of the aerosol form of particulate matter, such as ammonium
                                              sulphates and ammonium nitrates, take up water from the atmosphere.

    Primary and secondary                     Sources
    components

    Organic carbon                            Primary organic carbon comes rom traffic or industrial combustion sources.
                                              Secondary organic carbon comes from the oxidation of volatile organic
                                              compounds (VOCs). There may be several hundred individual components.
                                              Some of these trace organic compounds, such as certain polycyclic aromatic
                                              hydrocarbons, are highly toxic.

    Note that abbreviations such as SO2 and NOx are often used instead of the names of the chemicals in full.
    We will follow this practice in this Summary.
3
Table 2. Precursors of secondary particulate matter.
Primary components Sources
SO2 SO2 is formed by the combustion of sulphur-containing fuels such as coal.
Ship fuels such as heavy fuel oil are also a source. However, SO2 emissions
from coal-burning power stations have been much reduced by the use of
a technology called flue gas desulphurisation and automotive fuels are now
low in sulphur.
NOx NOx is formed by the combustion of fuels used in power generation, domestic
heating and traffic. See the AQEG report Nitrogen Dioxide in the United
Kingdom for more details.
NH3 Ammonia (NH3) is emitted mainly from agricultural sources, particularly
livestock waste.
VOCs Aromatic compounds such as benzene and toluene are generated by traffic
and solvents. Monoterpenes come from vegetation, especially conifers
and heathers.
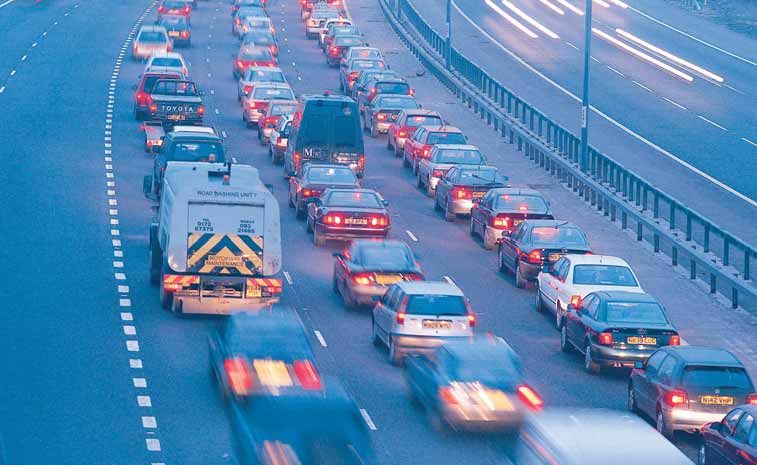
Where does it come from? The sources of particulate matter are shown
in Figure 1. To the right of the figure are
Primary particles are released into the urban background and roadside sites (these
atmosphere from a number of stationary terms are defined later in this summary,
and mobile sources. The major mobile source on page 9) where people live and work.
is road transport, which produces primary Furthest to the left of the figure are the
particles when fuels are burned or lubricants sources of secondary particulate matter,
used up in the engine, when tyres and brakes VOCs, NOx and SO2. The formation of
wear down and from road dust. The main secondary particulate matter takes time.
stationary sources are the burning of fuels During the hours or even days over which
for industrial, commercial and domestic this happens, the air containing the
purposes. Emissions of dust can also pollution can travel long distances and so
generate high concentrations of particulate these gases may have been emitted on
matter close to quarries and construction mainland Europe. The sources of primary
sites. Primary particles can also be produced particulate matter are shown in the centre
from natural sources, for example sea spray of the figure.
and dust from the Saharan desert travelling
vast distances. Secondary particulate matter
is formed from chemical reactions of the What are the health effects
gases NH3, SO2 and NOx released into the of particulate matter?
atmosphere (see Table 1). Secondary
particulate matter is also formed from Particulate matter can affect our health.
organic compounds by reactions that occur The available evidence suggests that it is
in the atmosphere. These organic compounds the fine components of PM10, which have
are released when fuel is burned or when a diameter of 2.5 µm or less and are formed
fuel or solvents evaporate; they are also by combustion, that are the main cause of
emitted naturally by vegetation. the harmful effects of particulate matter.
These fine particles consist of carbon, trace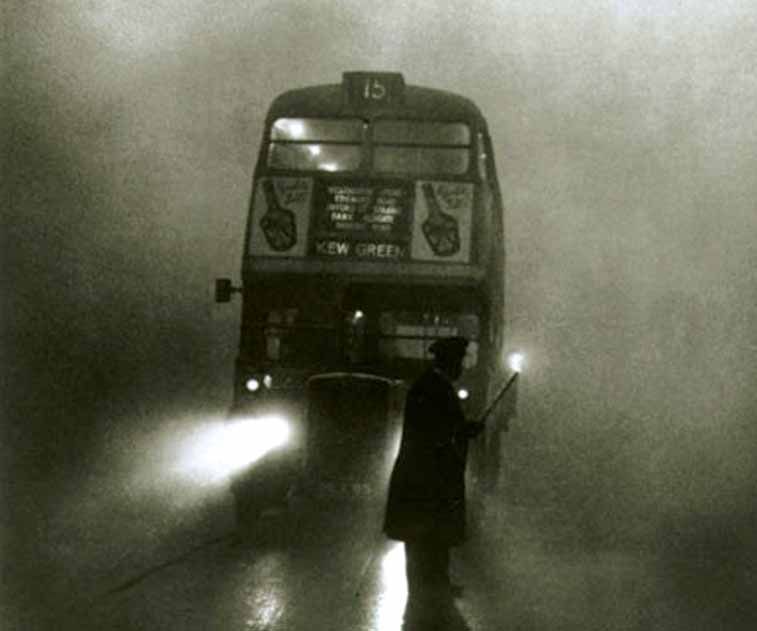
4
5

Figure 1. Sources of particulate matter.

     VOCs                 Transboundary transport
                    SO2
                                                                                       Dispersion
                                  Oxidation                  NH3                      Soot

                  VOCs    NOx

                                           NaCl                                      Dust

                                                                          Urban              Roadside
                                                                        background           location
                                                                         location

metals (such as copper and zinc) and organic        each 1 µg m–3 decrease in PM2.5 over the
compounds. There is less evidence to connect        lifetime of the current population of
secondary inorganic particulate matter (such        England and Wales, between 0.2 and 0.5
as sulphates and nitrates) or larger particles      million years of life will be gained. This is
with adverse health effects, although they          equivalent, on average, to 1.5 – 3.5 days
cannot be ruled out.                                for every individual in England and Wales.
                                                    The effect is unlikely to be evenly spread
Particles cause the most serious health             across the population, however, and some
problems among those susceptible groups             people will gain much more.
with pre-existing lung or heart disease
and/or the elderly and children. There is
evidence that short- and long-term exposure             Particulate matter and the
to particulate matter cause respiratory and             UK Air Quality Strategy
cardiovascular illness and even death. It is
likely that the most severe effects on health       To protect our health, Defra and the
are caused by exposure to particles over long       Devolved Administrations have set two air
periods of time. However, UK estimates              quality objectives for PM10 in their Air
indicate that short-term exposure to the            Quality Strategy:
levels of PM10 that we experienced in 2002          1. The 24-hourly objective, which is the
led to 6,500 deaths and 6,400 hospital                 concentration of PM10 in the air averaged
admissions being brought forward that year,            over 24 hours, is designed to make sure
although it is not possible to know by what            that we are not exposed to high
length of time those deaths were brought               concentrations of PM10 for short periods
forward. Work published by the Committee               of time. High concentrations can arise
on Medical Effects of Air Pollution                    during pollution episodes, which are
(COMEAP) in 2001 also indicates that for               short periods of high levels of pollution
6

  that are usually associated with             value from 35 to 7 and a decrease in the
  particular weather conditions.               annual limit value from 40 µg m–3 to 20 µg
                                               m–3. These are called indicative limit
2. The annual objective, which is the          values, because they currently have no
   concentration of PM10 in the air averaged   legal standing. They will be subject to
   over one year, aims to protect us from      further assessment and discussion by
   being exposed to PM10 over a long           experts and policy-makers before a decision
   time period.                                is made on whether to adopt them. In its
                                               Addendum to the Air Quality Strategy, the
The European Union (EU) has also               UK Government and Devolved
developed legislation to limit our exposure    Administrations adopted these stricter
to air pollutants through limit values         indicative limit values as provisional
– concentrations not to be exceeded. Table 3   objectives to be achieved in the UK by 31
shows the objectives and limit values that     December 2010.
need to be achieved by the UK for PM10
concentrations. In addition, emissions of      The provisional annual objective is slightly
particulate matter are controlled by           stricter still for Scotland and slightly less
legislation at national and European levels    strict for London. This reflects the lower
(for example, by limiting engine emissions     concentrations in Scotland and the higher
from road vehicles).                           values found in London. Although these
                                               tighter objectives have no legal standing in
                                               England, Wales and Northern Ireland they
The EU has also proposed stricter limit
                                               have been put into regulations in Scotland
values to be achieved by 1 January 2010.
                                               for the purposes of Local Air Quality
These involve a reduction of the number of
                                               Management.
allowed exceedences of the 24-hourly limit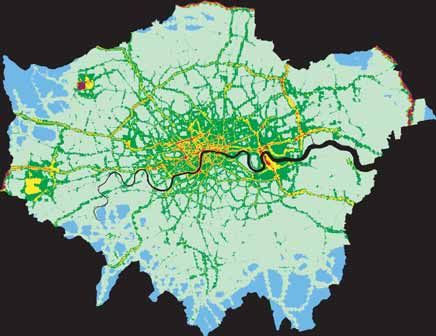
7

8

Table 3. EU limit values and the UK Air Quality Strategy objectives for particulate matter
(measured as PM10).
 Legislation                                24-hourly limit                  Annual limit                  Achieve by
                                            values and                       values and
                                            objectives                       objectives

 EU First Daughter                          50 µg m–3 with up to             40 µg m–3                     1 January 2005
 Directive (99/30/EC)                       35 exceedences a year
 UK Air Quality                             50 µg m–3 with up to             40 µg m–3                     31 December 2004
 Strategy (2000)                            35 exceedences a year
 For the 24-hourly objective, an agreed number of exceedences is permitted. This allows for situations, such as Bonfire Night,
 where it is not possible or practical to expect 24-hourly average concentrations to remain within the agreed limit (see page 14).

     How are emissions of                                             23% in Germany, 13% in France and 39%
                                                                      in Sweden.
     particulate matter
     changing?                                                        We expect emissions to fall by a further
                                                                      28% by 2010, mainly from reductions in
Figure 2 shows the total emissions of                                 power station and road transport
primary PM10 in the UK from 1970 to                                   emissions, but to level off between 2010
2001. The fall in total emissions has been                            and 2020. However, the reduction may not
dominated by reductions in emissions from                             be as great as this if the recent growth in
domestic heating, energy production and                               the numbers of diesel cars on the road
from industrial combustion largely as a result                        continues. The Department for Transport
of a decrease in the use of coal as a fuel.                           now expects that more diesel cars will be
The reductions in particulate matter                                  sold in the UK than it had previously
emissions in the UK are similar to or greater                         forecast. Emissions of particulate matter
than those achieved in mainland Europe.                               from diesel cars are greater than those from
During 1990 to 2001, emissions of primary                             petrol cars.
PM10 in the UK fell by 42% compared with
9
The air quality models used in the AQEG largely due to improvements in engine
report to predict future concentrations of design and to the fitting of three-way
particulate matter used the older, lower catalysts to petrol cars. Reductions in
estimates of the numbers of diesel cars. As emissions from power stations have also
a result, it is likely that future emissions will be been important.
somewhat higher than originally predicted.
There have also been reductions in the How is particulate matter
emissions of those pollutants that lead to measured?
the formation of secondary particulate matter.
Since 1990, SO2 emissions, which lead to The aim of the measurement techniques
sulphate formation, have fallen by over 83% is to determine the concentration of
in the UK. This decrease is attributable to particulate matter in outdoor air. Since the
the switch from coal to gas and the use of air quality objectives are framed in terms of
flue gas desulphurisation at power stations the concentration of PM10, it is necessary to
and other industrial plants to trap SO2 exclude particles greater than 10 µm from
before it reaches the atmosphere. In addition, the analysis. This is achieved by drawing
NOx emissions, which lead to nitrate the air through a size-selective inlet.
formation, have fallen by 39% since 1990 to Measurements are also made of PM2.5 for
meet increasingly strict European standards. which a different size-selective inlet is required.
These reductions in NOx emissions are
Figure 2. PM10 emissions in kilotonnes in the UK by source from 1970 to 2001.
600
500
PM10 emissions (kt)
400
300
200
100
0
1970 1975 1980 1985 1990 1995 2000
Public power Commercial, residential and industrial combustion Industrial combustion
Production processes Road transport Other
Resuspension10
One way of determining particulate matter Other methods, used by member countries
concentrations is the filter-based to establish compliance with EU limit
gravimetric method. With this method a values, must be related back to this
certain volume of air is drawn through a reference method. One disadvantage of the
size-selective inlet and then through a filter. gravimetric method is that it takes about 24
The particulate matter is deposited on the hours to make a measurement, and the
filter, which is then weighed to determine results are reported only after several days.
the mass of particulate matter that was in In the UK, the TEOM analyser is widely
that volume of air. used because it gives results that can be
made available immediately to the public.
A widely used alternative method uses However, this method requires that the air
the TEOM (Tapered Element Oscillating passing into the TEOM analyser is heated
Microbalance). The filter in a TEOM is and this leads to the loss of semi-volatile
mounted on a tapered glass tube that material such as some organic compounds,
vibrates continually. As particles collect on ammonium nitrate and water. The filter-
the filter, the vibration gets slower. The based gravimetric method does not use a
change in vibration can be measured very heated inlet so it is necessary to adjust the
precisely without stopping sampling, giving data collected from TEOMs using a scaling
a continuous measurement of the amount factor to allow the direct comparison of
of particulate matter being collected. TEOM measurements with measurements
made with the EU’s gravimetric reference
The EU defines the filter-based gravimetric method and therefore the EU limit values.
method as its reference method.11
Particulate matter • regional networks – which consist of the
monitoring networks LAQN and other local authority sites; and
Networks of monitoring sites for particulate • other monitoring sites – which are
matter have been established throughout operated by local authorities and groups
the UK. The majority of sites use a TEOM such as the Highways Agency and the
analyser, but a few use the gravimetric and electricity-generating companies.
other methods. Most sites monitor PM10,
but a few also measure PM2.5. The main Figure 3 shows the locations of the 240
networks are: PM10 sites that were operational in 2003
in the UK and that were used by AQEG to
• national networks, including the produce this report. The locations of sites
Automatic Urban and Rural Network measuring PM2.5 are also shown. The
(AURN) – which is funded by Defra and monitoring sites are classified into different
the Devolved Administrations but which types depending on their location, for
also includes some local authority sites, example, kerbside, roadside and urban
including some from the London Air background. This classification is briefly
Quality Network (LAQN); described in Table 4.
Table 4. Definitions of types of monitoring site.
Type Definition of site
Kerbside Sites with sample inlets within one metre of the edge of a busy road.
Roadside Sites with sample inlets between one metre of the edge of a busy road
and the back of the pavement (usually five metres from the roadside).
Urban centre Sites away from roads in city and town centres (for example, in pedestrian
precincts and shopping areas).
Urban background Sites in urban locations (for example parks and urban residential areas) away
from specific emission sources. These locations broadly represent city-wide
background concentrations.
Urban industrial Sites where industrial emissions can make a significant contribution to measured
pollution concentrations.
Suburban Sites typical of residential areas on the outskirts of a town or city.
Rural Sites in the open country away from roads and industrial and residential areas.
Remote Sites in the open country in isolated rural areas that only have regional
background pollution concentrations for most of the time.
There are also 123 sites nationally that information on trends in black smoke
monitor black smoke. Black smoke is dark concentrations over several decades. The
particulate matter – essentially soot – which method is also a good indicator of a
is measured from the degree of staining of particular source of particulate matter
a filter when a certain volume of air is drawn – elemental carbon from stationary and
through it. The main advantage of the black mobile combustion sources. The
smoke monitoring sites is that some of them disadvantage of black smoke measurements
have been operating for many years, giving is that they cannot be related to the EU12
reference method and so have been also measure and assess its composition.
replaced by measurements of PM10 and To this end, limited measurements are also
PM2.5 in the monitoring networks. made of metals, the major ions (such as
sulphate, nitrate and chloride), elemental
Finally, if we are to understand the sources carbon (soot) and organic carbon (carbon
of particulate matter, it is essential that we in the form of organic compounds).
Figure 3. Location of (a) PM10 and (b) PM2.5 monitoring sites.
(a)
(b)
AURN, Automatic Urban and Rural Network; DA, Devolved Administrations; LAQN, London Air Quality Network; KAQN, Kent Air
Quality Network; HBAPMN, Hertfordshire and Bedfordshire Air Pollution Monitoring Network; SAQSG, Sussex Air Quality Steering
Group; Birmingham CC, Birmingham Calibration Club, run by the local authority but with data handling managed by a single company;
Calibration Club, run by local authorities but with data handling managed by a single company; Highways Agency – TRL, run by the
Highways Agency but with data handling managed by TRL; Transport for London – TRL, run by Transport for London but with data
handling managed by TRL; Heathrow, run by Heathrow Airport Ltd.; JEP Innogy and JEP Powergen, run by power generators.13
14
What are the Domestic coal burning was a major
contributor to these smogs.
concentrations of The air quality objectives set by Government
particulate matter and in response to EU legislation are given
how are they changing? in terms of PM10 concentrations.
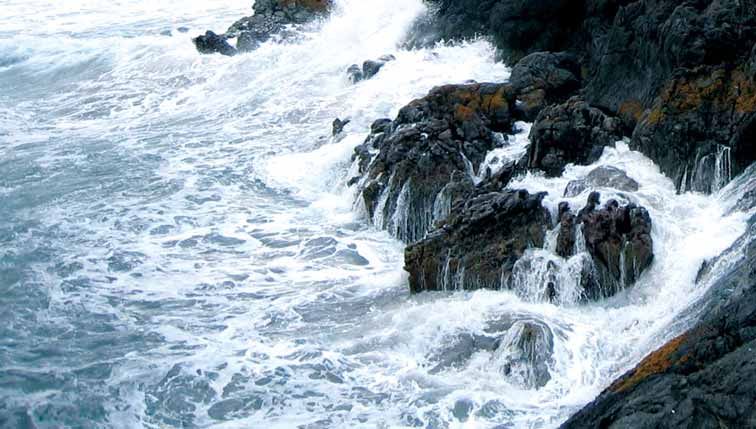
Measurements of PM10 started in 1992 and
It is important to assess whether the so have been made over a much shorter
reductions that have taken place in the time period compared to measurements
emissions of particulate matter to air are of black smoke. Figure 5 shows the annual
reflected in the concentrations we measure. average PM10 concentrations recorded at
a set of long-running urban background
The longest continuous particulate matter PM10 monitoring sites in the UK. The falls
measurements that have been recorded are in PM10 levels recorded at all sites during
those of black smoke. Figure 4 illustrates the 1990s have stopped in recent years and
the substantial reductions in black smoke at some sites the concentrations have even
concentrations achieved in the London increased. The reasons for these changes
Borough of Lambeth between 1961 and
are unclear but they may have been related
1998; the decrease reflects the substantial
to the atmospheric conditions, particularly
decline in coal use. Several severe winter
during 2003, when the weather was unusual
smog events occurred, particularly in
London, during the last century. The worst – especially over the summer when record-
episode was in December 1952. The number breaking temperatures were recorded.
of deaths brought forward, in excess of We need to continue to examine the
those that would normally have been monitoring data as they become available
expected, during the first three weeks of to see whether the expected reductions in
December was between 3,500 and 4,000. emissions are seen in the concentrations.
Particulate matter was a major contributor It is clear, though, that the decreases in
to these health effects and also led to very emissions of primary particulate matter are
poor visibility conditions, sometimes down not fully reflected in the PM10 concentrations
to only a metre or so. recorded by the monitors.
Figure 4. Annual average black smoke concentrations in the London Borough of Lambeth
between 1961 and 1998.
180
160
140
120
Black smoke (µg m–3)
100
80
60
40
20
0
1961
1963
1965
1967
1969
1971
1973
1975
1977
1979
1981
1983
1985
1987
1989
1991
1993
1995
1997
Year15 A comparison between the different types is greater than the urban background of monitoring site reveals interesting average, which in turn is greater than the information which helps us to understand rural average, the differences are not large. why this is the case. Figure 6 shows the If the same analysis is carried out for annual mean PM10 concentrations recorded another pollutant – NOx – a much bigger at 196 monitoring sites in 2003. These sites difference is seen. NOx is emitted exclusively include roadside, urban background and from combustion sources, especially road rural sites. They use TEOM measurements, traffic. It is clear that, compared to NOx, and the scaling factor discussed earlier has PM10 concentrations are much more evenly not been applied. The pink, green and blue distributed across the UK. This observation lines show the average PM10 concentrations reflects the wide range of PM10 sources recorded across each monitoring site type. and, in particular, the contribution of Although, as expected, the roadside average secondary particulate matter.
16

Figure 5. Annual mean PM10 concentrations (TEOM, not scaled) at long-running urban
background monitoring sites in the UK between 1992 and 2003.

                                  40
 PM10 measured by TEOM (µg m–3)

                                  35

                                  30

                                  25

                                  20

                                  15

                                  10

                                   5

                                   0
                                            1992

                                                   1993

                                                          1994

                                                                 1995

                                                                        1996

                                                                               1997

                                                                                         1998

                                                                                                1999

                                                                                                       2000

                                                                                                              2001

                                                                                                                     2002

                                                                                                                            2003
                                                                                      Year

                                                    Belfast Centre                       Birmingham Centre
                                                    Bristol Centre                       Cardiff Centre
                                                    London Bloomsbury                    Edinburgh Centre
                                                    Leeds Centre                         Leicester Centre
                                                    Liverpool Centre                     Newcastle Centre
                                                    Southampton Centre                   Swansea
                                                    Average

Figure 6. Roadside, urban background and rural annual average PM10 concentrations (TEOM,
not scaled) at 196 sites in 2003. The horizontal lines show averages across site types:
roadside (blue), urban background (green) and rural (pink).

                                       40

                                       35

                                       30
   P M10 (µg m )

                                       25
 −3

                                       20

                                       15

                                       10

                                        5

                                        0
17
Looking at the way in which PM10 from sources such as traffic and domestic
concentrations change with time and their heating can reach high levels.
relationship to concentrations of other
pollutants in air can help us understand • Particulate matter concentrations rise
what the sources are. For example, the on the nights around November 5th,
strongest link between PM10 and other when Bonfire Night is celebrated. The
pollutants generated by traffic, such as NOx concentrations can be particularly high
and carbon monoxide, is found at roadside under inversion conditions but are not
monitoring sites. On Marylebone Road in so high under windy conditions.
London, the concentrations of particulate
matter recorded during the week are higher • Summer episodes take place when the
than those found on Sundays, despite there weather is hot and sunny and there is
being little difference in the overall volume little wind. In the presence of sunlight,
of traffic. A probable explanation for this emissions of VOCs and NOx lead to the
is that the amount of heavy-duty traffic production of high concentrations of
(such as lorries) is reduced on Sundays. secondary particulate matter. A severe
Heavy-duty vehicles emit more particulate episode occurred in August 2003 in
matter than other traffic. Southeastern England during a heatwave
that affected much of Europe. These
The composition of the particles also summer smog episodes are also associated
provides information on their origins, as with high concentrations of ozone.
shown in Table 1. Iron, for example, is Secondary particle concentrations can
representative of road dust, chloride of also increase at other times of the year,
marine particles and sulphate of secondary as happened in Spring 2003.
particles formed from SO2. Measurements
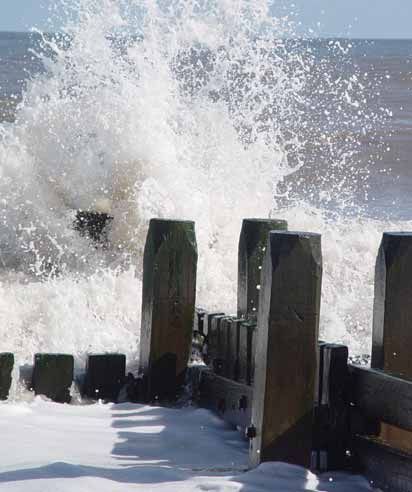
of composition are, therefore, essential to • Gales can cause between one and five
identifying the emissions sources of both sea salt episodes each year from sea
primary and secondary particulate matter. spray. Even sites well inland can
experience increased concentrations of
particulate matter from this source.
Are there conditions
that can lead to high • One or two episodes happen each year
concentrations of when we experience high concentrations
of dust, blown from the Sahara desert.
particulate matter?
Pollution episodes are short periods of high • In September 2002, hourly PM–310
levels of pollution, such as when 24-hourly concentrations over 100 µg m were
average particulate matter concentrations observed at several locations in the UK
higher than 50 µg m–3 are recorded. There as a result of forest fires in Western Russia.
are several types of episode.
• Local pollution episodes can occur as a
• In winter, pollution episodes are result of, for example, construction works.
particularly severe during weather By and large, the number of exceedences
conditions known as inversions. When of a 24-hourly mean of 50 µg m-3 has
the ground is cold and there is little wind, declined over the last 10 years, although
emissions become trapped near to the there were more exceedences in 2003 than
ground and pollutant concentrations in any year since 1997.18
Do current concentrations What are the
exceed the EU limit values? concentrations in places
PM10 results for 2002 and 2003 give a good without monitoring sites?
indication of what concentrations will be We use computer models to work out the
like in 2005, when the objectives and limit concentrations of PM10 in those parts of
values are to be achieved. Table 4 shows the UK where there are no monitoring sites.
the number and percentage of sites that The types of modelling methods used were
exceeded the annual mean and 24-hourly outlined in the Summary of AQEG’s first
limit values in each year. The percentage report Nitrogen Dioxide in the United
exceedences of the stricter indicative limit Kingdom. The models for PM10 are more
values for 2010 are also shown in Table 4. complicated than those used for NO2 because
The sites are divided into two types: of the complex nature of particulate matter
roadside and kerbside – where PM10 and the many components and sources,
concentrations tend to be higher because both primary and secondary, that must be
of traffic-related emissions – and other sites. taken into account. The models are built on
The results show that there were a large the data we get from UK particulate matter
numbers of exceedences during 2002 and monitoring sites and also consider how
2003 and demonstrate the differences that pollutants disperse in the air. Figure 7 shows
can occur from one year to the next. The the estimated annual average background
high PM10 concentrations experienced during concentrations of PM10 during 2002. The
2003 were discussed previously on page 14. map shows that higher concentrations of
particulate matter are found in urban areas.
Figure 7. Estimated UK annual average background PM10
concentrations (µg m–3) during 2002.
Below 12
12 – 14
14 – 16
16 – 18
18 – 20
20 – 22
22 – 24
Above 2419
Table 4. Numbers and percentages of roadside and kerbside and other PM10 monitoring
sites exceeding the 2005 and 2010 EU limit values in 2002 and 2003.
Site type Total number Annual limit value 24-hourly limit value
and year of sites 2005a 2010b 2005c 2010d
Roadside and
kerbside (2002) 67 5 (7%) 66 (99%) 18 (27%) 56 (84%)
Other (2002) 108 1 (1%) 87 (81%) 8 (7%) 58 (55%)
Roadside and
kerbside (2003) 76 13 (17%) 74 (97%) 45 (59%) 75 (99%)
Other (2003) 111 2 (2%) 100 (90%) 20 (18%) 104 (94%)
aNumber (and percentage) of sites with an annual mean greater than 40 µg m–3. bNumber (and percentage) of sites with an annual
mean greater than 20 µg m–3. cNumber (and percentage) of sites with a 24-hourly mean greater than 50 µg m–3 for more than 35 days
per year. dNumber (and percentage) of sites with a 24-hourly mean greater than 50 µg m–3 for more than 7 days per year.
How are particulate matter improved technology such as particle
traps on diesel vehicles. Figure 8 shows the
concentrations predicted calculated annual average concentrations
to change in the future? of particulate matter in London that were
predicted for 2004 and that are predicted
Models are also used to predict future for 2010 and shows clearly the reductions
concentrations of pollutants and have to in concentrations of this pollutant that are
take into account changes in future emissions predicted over that period.
arising, for example, from the use of20
Figure 8. Annual average particulate matter (µg m–3) concentrations in London calculated
for (a) 2004 and (b) 2010.
(a)
Annual average
PM10 (µg/m3)
19
20
21
22
23
24
25
26
27
28
0 10 20 Kilometers >29
(b)
Annual average
PM10 (µg/m3)
19
20
21
22
23
24
25
26
27
28
0 10 20 Kilometers >2921
Analysis of the data from maps of this sort in its report that Defra and the Devolved
allows us to predict likely future exceedences Administrations should increase the
of the air quality objectives. The results show number of monitoring sites at which
that the 24-hourly objective was more measurements are made of the
difficult to achieve than the annual objective composition of particulate matter. This
in 2004 and that there will be exceedences would make it easier for us to work out
along major roads, mainly in London. These the origins of the particulate matter,
maps also show that the stricter air quality which in turn would improve the
objectives suggested for 2010 will lead to accuracy of our models. For example, we
many more exceedences at roadside and do not have a detailed understanding of
even at urban background locations. the contributions that nitrate and
However, it is important to remember that sulphate make to regional background
these 2010 objectives are provisional and concentrations of particulate matter.
currently have no legal standing in England,
Wales and Northern Ireland. In Scotland the • Secondary organic compounds also
2010 objectives have been put into contribute to regional background
regulations for the purpose of Local Air levels of particulate matter, especially
Quality Management. in summertime. By increasing the number
of sites monitoring the composition of
It is difficult to make accurate predictions particulate matter across the UK, we
about future air quality for a number of should be better able to understand how
reasons. much is secondary particulate matter,
how much comes from natural sources
• The number of pollution episodes varies such as sea spray and vegetation and
from year to year.
how much is from human-made sources
such as traffic. Ultimately this information
• The complex nature of particulate matter will help the Government to better
and the large number of possible
sources make modelling – and therefore assess what can be done to further
predictions – difficult. AQEG argues protect human health.22
The future Particulate matter has many sources and
shows links to several different pollutants.
It is clear that, although road traffic emissions Traffic contributions lead to high
are a major source of particulate matter concentrations of both particulate matter
near to roads, the regional contribution to and NO2 near to roads. During summer
particulate matter is substantial. Controlling pollution episodes, regional background
background particulate matter must, concentrations of ozone and of particulate
therefore, be a central part of any UK strategy matter can both be high because they are
to control exposure to particulate matter. produced in the atmosphere by related
In addition, because there is no known safe chemical reactions. The sources of these
level for exposure to particulate matter, it is secondary pollutants are widespread and
not appropriate to rely solely on the use of include mainland Europe. The effects of
air quality objectives. They focus attention pollutants are not only limited to health
on ‘hotspots’ – places where the pollutant effects. Acid deposition originates from the
concentration is high, for example close to emissions of NOx, NH3 and SO2, which
busy roads, but where relatively few people also form secondary particulate matter.
tend to live. Particulate matter and ozone also influence
climate change.
To maximise the benefits of our controls on
particulate matter, we must aim to reduce There is a tendency to treat pollutants, their
exposure more widely. AQEG recommends effects and their control independently,
that forms of regulation be considered that which neglects these relationships. AQEG
are based on reducing the average recommends a more flexible and holistic
exposure to particulate matter experienced approach, which will deliver more cost-
by the UK population, which would effective solutions to air quality management,
complement the 24-hourly and annual including the improvement of particulate
objectives. matter air quality.23
Glossary
Air quality objective Standards are concentrations of pollutants in the air that
have been set to achieve a certain level of air quality.
Objectives are the policy target dates by which the
standards should be achieved, either without exception
or with a permitted number of exceedences in a year.
Air Quality Strategy Report published by the UK Government describing plans
to improve and protect air quality in the UK. A copy can
be found at:
http:/www.defra.gov.uk/environment.airquality/
strategy/index/htm.
Background concentration Refers to the concentration of a pollutant in the
atmosphere in a region away from pollutant sources.
Cardiovascular illness Disease relating to or involving the heart and the
blood vessels.
Committee on Medical An Advisory Committee of independent experts that
Effects of Air Pollution provides advice to Government Departments and Agencies
(COMEAP) on all matters concerning the potential toxicity and
effects upon health of air pollutants.
Concentration The amount of a pollutant in a given volume of air.
Dispersion The process by which a pollutant spreads from its source
in the absence of a wind.
Emission Direct release of a pollutant into the atmosphere.
Episode Short period of high concentrations of pollution.
Exceedence A period of time when the concentration of a pollutant
is higher than the air quality objective.
Indicative limit value A concentration not to be exceeded after a certain date
that may become legally binding if adopted in legislation.
Kilotonne One-thousand tonnes.
Limit value A concentration not to be exceeded that becomes legally
binding after a certain date.
Microgram (µg) One-millionth of a gram.
Micrometre (µm) One-millionth of a metre.
Model In this document, the term refers to a mathematical way
of converting knowledge of air pollutant emissions into
concentrations in the atmosphere.24
µg m–3 Micrograms of a substance in each cubic metre of air.
A unit for describing the concentration of air pollutants in
the atmosphere. A concentration of 1 µg m–3 means that
one cubic metre of air contains one microgram of pollutant.
Nanometre (nm) One-billionth (one thousand millionth) of a metre.
Ozone Toxic unstable gas made up of three oxygen atoms; the
chemical formula is O3. At ground level ozone is formed
by sunlight-driven chemical reactions of NOx with VOCs.
Particulate filter Device for reducing emissions of particulate matter from
diesel vehicles.
Primary pollutant A pollutant that is released straight into the atmosphere
(contrast with secondary pollutant).
Reference method The method that the EU uses to define its air quality limit
values. If member countries use another method for
monitoring, they need to demonstrate that their method
gives the same results as the reference method.
Respiratory illness Disease relating to or involving the lungs and breathing.
Sample inlet The point, usually at the end of a sampling tube, from
which air is taken in to be measured by an air pollution
monitoring instrument.
Secondary pollutant A pollutant that is formed in the atmosphere by chemical
reactions (contrast with primary pollutant).
Semi-volatile compounds Compounds such as ammonium nitrate that will
evaporate on mild heating. Volatile compounds evaporate
at even lower temperatures.
Size-selective inlet A sample inlet that ensures that only particles of a
diameter equal to or less than a specified value are passed
to the monitoring instrument.
Three-way catalyst Device fitted to the exhaust of petrol cars to reduce
emissions of carbon monoxide, NOx and VOCs.
VOCs (volatile organic Chemicals containing carbon that are gases, such as ethane,
compounds) or that easily evaporate at room temperature, such as
benzene. VOCs are released into the atmosphere from
the burning of fossil fuels and from other sources. Some
VOCs, such as isoprene, are emitted by vegetation.25
Further information
Additional copies of this publication may be ordered from:
AQEG Secretariat
Air and Environment Quality Division
4/E14 Ashdown House, 123 Victoria Street,
London SW1E 6DE
Telephone 020 7082 8421
Fax 020 7082 8385
Email sarah.honour@defra.gsi.gov.uk
Current and forecast pollutant concentrations
Freephone telephone
helpline 0800 556677
TELETEXT Page 156
Internet http://www.airquality.co.uk
Contacts
England Air and Environment Quality Division add defra
4/E14 Ashdown House, 123 Victoria Street,
London SW1E 6DE
Telephone 020 7082 8421
Fax 020 7082 8385
Email air.quality@defra.gsi.gov.uk
http://www.defra.gov.uk/environment/airquality/
Northern Air and Environmental Quality add DoE
Ireland 1st Floor, Commonwealth House,
35 Castle Street, Belfast BT1 1GU
Telephone 028 9054 6425
Fax 028 9054 6424
Email EP@doeni.gov.uk
http://www.ehsni.gov.uk/environment/air/air.shtml
Scotland The Scottish Executive
Air, Noise and Nuisance Team, 1-G North, Victoria Quay,
Edinburgh EH6 6QQ
Telephone 0131 244 7250
Fax 0131 244 0211
Email air.quality@scotland.gsi.gov.uk
http://www.scotland.gov.uk/about/ERADEN/ACEUAQT/00016215/
Wales The National Assembly for Wales
Department of Environment, Planning & Countryside
Cathays Park, Cardiff CF1 3NQ
Telephone 029 2082 3499
Fax 029 2082 3658
Email environment.division@wales.gsi.gov.uk
http://www.countryside.wales.gov.uk/
PB10580a26
27
28
You can also read