Population Genetics of the Red Rock Lobster
←
→
Page content transcription
If your browser does not render page correctly, please read the page content below
Population Genetics of the Red Rock Lobster,
                       Jasus edwardsii

                          Luke Thomas

A thesis submitted to the Victoria University of Wellington in partial
fulfilment of the requirements for the degree of Master of Science in
                          Marine Biology.

                 Victoria University of Wellington
                                2012

                                                                         1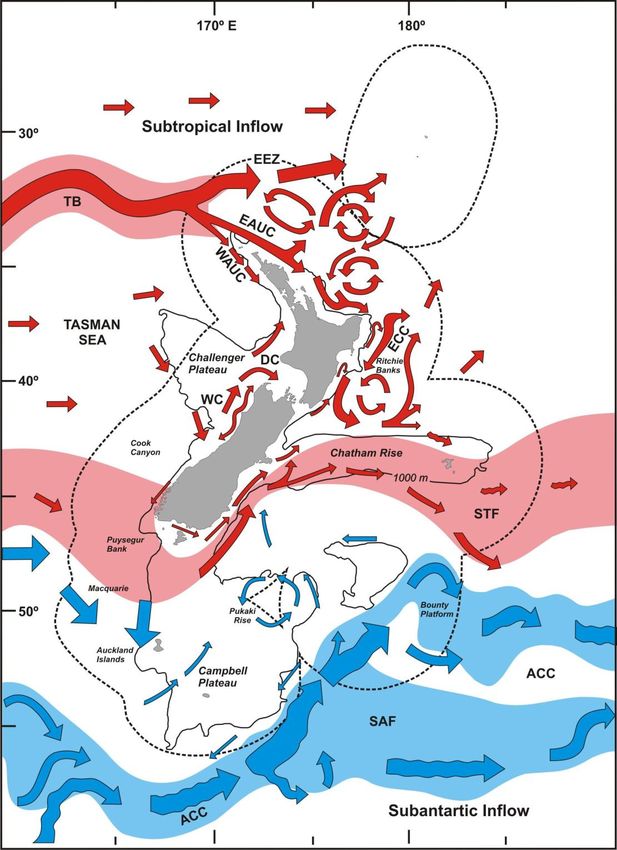
2

This thesis was conducted under the supervision of:

                 Dr. James J Bell

         Victoria University of Wellington

             Wellington, New Zealand

                                                      3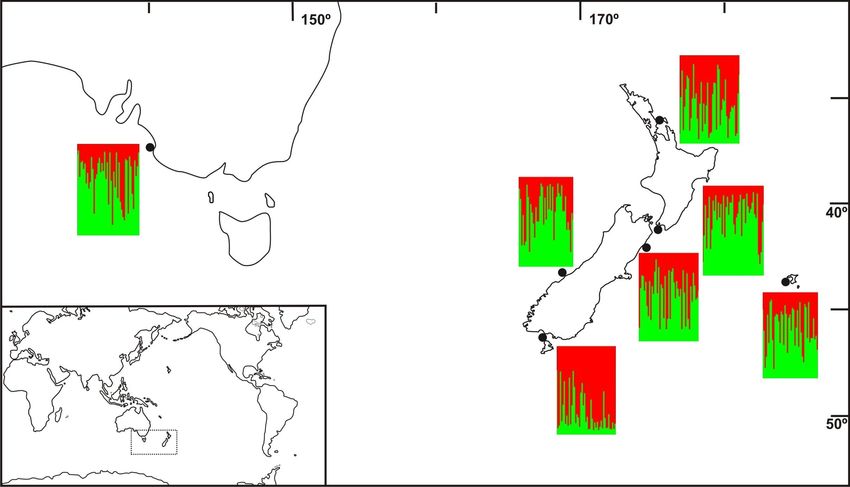
4

General Abstract

Understanding patterns of gene flow across a species range is a vital component of
an effective fisheries management strategy. The advent of highly polymorphic
microsatellite markers has facilitated the detection of fine-scale patterns of genetic
differentiation at levels below the resolving power of earlier techniques.
This has triggered the wide-spread re-examination of population structure for a
number of commercially targeted species. The aims of thesis were to re-investigate
patterns of gene flow of the red rock lobster Jasus edwardsii throughout New
Zealand and across the Tasman Sea using novel microsatellite markers. Jasus
edwardsii is a keystone species of subtidal rocky reef system and supports lucrative
export markets in both Australia and New Zealand. Eight highly polymorphic
microsatellite markers were developed from 454 sequence data and screened across
a Wellington south coast population to obtain basic diversity indices. All loci were
polymorphic with the number of alleles per locus ranging from 6-39. Observed and
expected heterozygosity ranged from 0.563-0.937 and 0.583-0.961, respectively.
There were no significant deviations from Hardy-Weinberg equilibrium following
standard Bonferroni corrections. The loci were used in a population analysis of J.
edwardsii that spanned 10 degrees of latitude and stretched 3,500 km across the
South Pacific. The analysis rejected the null-hypothesis of panmixia based on earlier
mDNA analysis and revealed significant population structure (FST=0.011, RST=0.028)
at a wide range of scales. Stewart Island was determined to have the highest levels
of genetic differentiation of all populations sampled suggesting a high degree of
reproductive isolation and self-recruitment. This study also identified high levels of
asymmetric gene flow from Australia to New Zealand indicating a historical source-
sink relationship between the two countries. Results from the genetic analysis were
consistent with results from oceanographic dispersal models and it is likely that the
genetic results reflect historical and contemporary patterns of Jasus edwardsii
dispersal and recruitment throughout its range.

                                                                                    5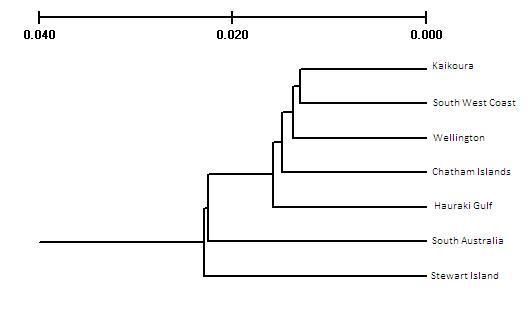
6
Dedicated to my loving parents: Jenny and Nick

                                                 7
Acknowledgements
There are a number of people that I would like to thank for helping both directly and
indirectly with the production of this thesis. First and foremost I would like to
acknowledge my parents. None of this would have been possible without their loving
emotional and financial support and I dedicate this thesis to them.
To my brothers--thanks for listening and pretending to be interested in my research
despite having little knowledge of or care for the subject matter. To mi novia--your
emotional, physical and intellectual support over the last year and a half has been
extraordinary. The quality of this thesis would have no doubt suffered if you were
not by my side. Thanks for all the time you spent proof reading and making
corrections.
I would also like to acknowledge my supervisor Dr. James Bell for his support along
the way. Despite going on paternal leave for several months and supervising 20
some odd PhD students, he still found time for us to meet regularly and discuss the
project. Thanks for all of your input and feedback.
The Kelburn Campus Postgraduate Crew (KCPC) also deserves recognition: Hayden
“Hay-Dogs” Smith, Shaun “Wilko” Wilkinson, Paul “Porites” Fisher, Leighton “LT2”
Thomas, Phil “Spider-Man” Sirvid and many others. Those coffee breaks made lonely
times in the lab more bearable and played an integral role in the development of this
thesis, thanks for the company. An additional shout out to my New Zealand partners
in crime, Tyler “Canadian Seal Clubber” Eddy, Ian “Creasing” Geeson and Pelayo
“Joto Maximo” Salinas for keeping things entertaining along the way. Additional
thanks to Daryl Sykes and Malcolm Lawson of the Rock Lobster Industry Council for
their role in sample collection. They were the ones that ultimately made this project
possible.
8Publications from this Thesis
Published Articles
Luke Thomas and James J Bell (2011) Characterisation of polymorphic microsatellite
markers for the red rock lobster Jasus edwardsii (Hutton 1875). Conservation
Genetic Resources, Technical Notes: DOI 10.1007/s12686-011-9537-x
Author contribution: LT designed the study, performed all of the laboratory work and
molecular analysis and drafted the manuscript. JJB co-designed the study, edited the
manuscript and obtained funding for the study. The New Zealand Rock Lobster
Industry Council collected samples for the study.
Luke Thomas and James J Bell (submitted to Proceedings from the Royal Society) Ecological
relevance of low genetic differentiation: consistency in connectivity patterns for a widely
dispersing marine species.
Author contribution: LT designed the study, performed all laboratory work and
molecular analysis and drafted initial manuscript. JJB co-designed the study, co-
authored the manuscript and obtained funding for the study. Samples were collected
by the New Zealand Rock Lobster Industry Council and the Southern Australian Rock
Lobster Fishery.
Conference Proceedings
James J Bell and Luke Thomas (2011) where did that lobster come from? Trans-Tasman
Rock Lobster Industry Conference (7th Lobster Congress); Marlborough Convention
Centre-Blenheim, New Zealand
Author contribution: LT performed the laboratory work and molecular analysis. JJB
developed the presentation.
9Table of Contents
GENERAL ABSTRACT ......................................................................................................... 5
ACKNOWLEDGEMENTS .................................................................................................... 8
PUBLICATIONS FROM THIS THESIS .................................................................................... 9
TABLE OF CONTENTS ...................................................................................................... 10
LIST OF ABBREVIATIONS................................................................................................. 12
LIST OF FIGURES............................................................................................................. 13
LIST OF TABLES .............................................................................................................. 14
CHAPTER I: GENERAL INTRODUCTION ............................................................................. 15
1.1 THE CONNECTIVITY CONUNDRUM ................................................................................. 15
1.2 BIO-GEOGRAPHICAL COMPLEXITIES AND THE STOCK CONCEPT ........................................... 16
1.3 MICROSATELLITE LOCI ................................................................................................. 18
1.4 THE NEW ZEALAND ROCK LOBSTER FISHERY.................................................................... 20
1.5 JASUS EDWARDSII BIOLOGY .......................................................................................... 22
1.6 PREVIOUS GENETIC ANALYSIS ....................................................................................... 26
1.7 PHYSICAL PROCESSES AFFECTING GENE FLOW ................................................................. 26
1.8 OCEANOGRAPHIC MODELS........................................................................................... 28
1.8 THESIS AIMS .............................................................................................................. 29
1.9 LITERATURE CITED ...................................................................................................... 30
CHAPTER II: CHARACTERISATION OF POLYMORPHIC MICROSATELLITE MARKERS FOR THE
RED ROCK LOBSTER JASUS EDWARDSII (HUTTON 1875)................................................... 37
2.1 ABSTRACT ................................................................................................................. 37
2.2 INTRODUCTION .......................................................................................................... 38
2.3 MATERIALS AND METHODS: ........................................................................................ 39
2.3.1 454 template preparation ................................................................................. 39
2.3.2 454 GS-FLX sequencing procedure (454 life sciences) ....................................... 39
2.3.3 Screening for Tandem Repeats .......................................................................... 41
2.3.4 DNA extraction for primer development ........................................................... 41
2.3.5 Primer Development .......................................................................................... 42
2.3.6 Primer Screening ................................................................................................ 43
2.4 RESULTS AND DISCUSSION............................................................................................ 44
2.5 LITERATURE CITED ...................................................................................................... 47
CHAPTER III: MICROSATELLITE ANALYSIS REVEALS ISOLATION OF STEWART ISLAND AND
STRONG SOURCE-SINK RELATIONSHIP BETWEEN AUSTRALIA AND NEW ZEALAND ........... 50
3.1 ABSTRACT ................................................................................................................. 50
3.2 INTRODUCTION .......................................................................................................... 51
3.3 MATERIALS AND METHODS .......................................................................................... 53
3.3.1 Study Species ..................................................................................................... 53
3.3.2 Sampling ............................................................................................................ 53
3.3.3 Laboratory Protocol and PCR Amplification ...................................................... 54
3.4 ANALYSIS .................................................................................................................. 55
3.4.1 Genetic Diversity ................................................................................................ 55
3.4.2 Population Structure .......................................................................................... 57
3.4.3 Bayesian Analysis ............................................................................................... 58
3.4.4 Trans-Tasman Gene Flow .................................................................................. 58
103.5 RESULTS .................................................................................................................... 59
3.5.1 Hardy-Weinberg and Linkage Equilibrium ......................................................... 59
3.5.2 Genetic Diversity ................................................................................................ 59
3.5.3 Population Structure .......................................................................................... 62
3.5.4 Trans-Tasman Gene Flow .................................................................................. 70
3.6 DISCUSSION ............................................................................................................... 71
3.6.1 Within-Population Diversity ............................................................................... 72
3.6.2 Stock Structure ................................................................................................... 74
3.6.3 Trans-Tasman Gene Flow .................................................................................. 80
3.6.4 Conclusions ........................................................................................................ 81
3.7 LITERATURE CITED ...................................................................................................... 82
CHAPTER IV: GENERAL DISCUSSION ................................................................................ 89
4.1 COUPLING GENETICS WITH OCEANOGRAPHY ................................................................... 90
4.1.1 Patterns of Recruitment around New Zealand .................................................. 90
4.1.2 Trans-Tasman Dispersal..................................................................................... 93
4.2 CONCLUSIONS: IMPLICATIONS FOR MANAGEMENT ........................................................... 94
4.3 LITERATURE CITED ...................................................................................................... 95
11List of Abbreviations
BP Base Pairs
CHI Chatham Islands
CL Carapace Length
CPUE Catch per Unit Effort
DNA Deoxyribonucleic acid
EAC East Auckland Current
ECC East Cape Current
EtOH Ethanol
HG Hauraki Gulf
HWE Hardy Weinberg Equilibrium
IAM Infinite Alleles Model
KAI Kaikoura
mDNA Mitochondrial Deoxyribonucleic acid
NRLMG National Rock Lobster Management Group
NZRLIC New Zealand Rock Lobster Industry Council
PCR Polymerase Chain Reaction
PLD Pelagic Larval Duration
QMS Quota Management System
SA South Australia
SI Stewart Island
SMM Stepwise Mutation Model
STC Sub-Tropical Convergence
SWC South West Coast
SZRLF Southern Zone Rock Lobster Fishery
TAC Total Allowable Catch
TACC Total Allowable Commercial Catch
TD-PCR Touchdown Polymerase Chain Reaction
TF Tasman Front
WEL Wellington
12List of Figures
FIGURE 1.1 The spectrum of population differentiation. Each circle represents a sub-population with
varying degrees of population divergence ranging from (D) panmixia to (A) complete isolation
Taken from Waples and Gaggiotti (2006)……………………………………………………………………………….16
FIGURE 1.2 NZ Quota Management Areas for J. edwardsii………………………………………………………………..21
FIGURE 1.3 Adult J. edwardsii: Total length 25.4 cm. Taken from Kensler (1967)……………………………….23
FIGURE 1.4 The final developmental stage of J. edwardsii phyllosoma larvae. Total length is 43.5mm.
Modified from Kittaka et al. (2005)………………………………………………………………........…………………25
FIGURE 1.5 Distinguishing features of J. edwardsii phyllosoma instars 13, 15 and 17; pl, pleopod; u,
uropod; ls, lateral spine. Bar indicates 1mm. Notice instar 17 uropods and pleopods fully
segmented and differentiated from the abdomen and are fringed with setae presumably for
advanced swimming ability. Modified from Kittaka et al. (2005)…………………………………………….25
FIGURE 1.6 Prevailing currents of the waters surrounding New Zealand. Courtesy of Sebastian
Hernandez….…………………………………………………………………………………………………………………………..27
FIGURE 2.1 Sequence lengths of 454 results from GS-FLX sequencing instrument produced by Genious
Pro 5.1.4. Average length (571 bp…………………………………………………………....………………………….…40
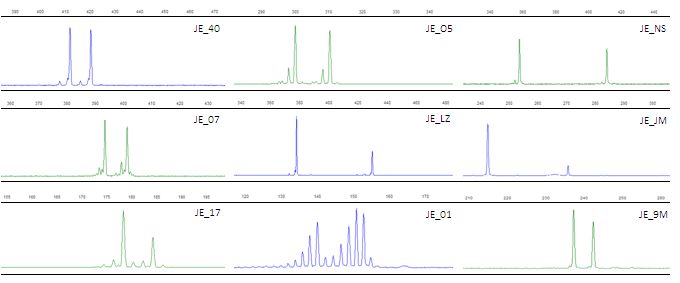
FIGURE 2.2 Chromatograph images of primers as seen in GeneMarker v1.97. Microsatellites in blue
are labelled with fluorochrome tag 6-FAM and in green with HEX.………………………………….45
FIGURE 2.3 Allele discovery curves for each locus for the Wellington population. The curve for each
locus reaches an asymptote when genetic diversity is completely sampled. Curves were
generated using PopGenKit Package (Paquette 2011) in R 2.13.1…………………………………………..45
FIGURE 3.1 Sample site locations where J. edwardsii was collected throughout New Zealand and on
the Australian coast: HG, Hauraki Gulf; WEL, Wellington; KAI, Kaikoura; CHI, Chatham Islands;
SWC, South West Coast; SI, Stewart Island; SA, South Australia………………………………………………56
FIGURE 3.2 Allele discovery curves for 9 microsatellite loci across 7 populations………………………….......62
FIGURE 3.3 UPGMA Cluster using Nei's (1972) minimum distance as implemented in TFPGA by
bootstrap analysis with 10,000 pseudoreplicates.…………………………………………………………………..64
FIGURE 3.4 Isolation by distance generated by IBWS 3.2.1. Pairwise genetic distances (Slatkin’s
linearized FST (above) and RST (below) plotted against the logarithm of minimum oceanographic
distance between populations…………………………………………………………………………………………………65
FIGURE 3.5 Structure 2.3.2 results with pre-defined clusters K ranging from 2-7. Each individual in the
data set is represented by a single vertical line, which is partitioned into K segments that
represent that individual’s estimated membership fraction in each of the K inferred clusters
(Pritchard et al. 2000)…………………………………………………………………………………………………………....67
FIGURE 3.6 Structure results with pre-defined cluster K=2 at corresponding sampled locations...........68
FIGURE 3.7 Prevailing current systems of New Zealand. Courtesy of Sebastian Hernandez………….......77
13List of Tables
TABLE 2.1 DNA extreaction protocol (adopted from Sambrook 1989).………….…………………………………..41
TABLE 2.2 Primer design conditions as used for Primer3 in Geneious Pro 5.1.4 ©……………………………..42
TABLE 2.3 PCR Reaction set-up: For each primer pair a reaction was set up as follows……………………...43
TABLE 2.4 Touchdown (TD) PCR protocol (Korbie and Mattick 2008)..………………………….……………………44
TABLE 2.5 Primer characteristics and sequences of microsatellite loci for J. edwardsii………..……………..46
TABLE 3.1 Sampling locations where J. edwardsii was collected…..…………………………………………………….54
TABLE 3.2 Ho, observed heterozygosity; He, expected heterozygosity; Fis, Inbreeding coefficient; for 7
populations across 9 microsatellite loci (bold values: significant deviation from HWE)……........60
TABLE 3.3 Ho, observed heterozygosity; He, expected heterozygosity; Na, number of alleles; Fis,
inbreeding coefficient at 7 populations averaged across 8 microsatellite loci………………………….61
TABLE 3.4 Allele size variations at 8 microsatellite loci with mean number of alleles, number of private
alleles and total number of alleles at 7 populations 8 microsatellite loci.………………………………..61
TABLE 3.5 Matrix of pairwise comparisons of population differentiation using F ST (below diagonal) and
RST (above diagonal) values at 7 populations using 8 microsatellite loci (bold values: significant
p < 0.05)…………………..……………………………………………………………………………………………………………..63
TABLE 3.6 Assignment tests (Rannala and Mountain 1997) for (A) individuals from each sampling
location (rows) assigned to each population (columns) and (B) clustering of populations based
on AMOVA results. Numbers represent percentages of individuals assigned to each population
and values in bold are correct assignments.…………………………………………………………………………….66
TABLE 3.7 Hierarchical analysis of molecular variance (AMOVA) among 3 different clustering situations:
(A) 4 groups: SA, SI, HG and WEL/KAI/SWC/CHI, (B) 3 groups: SA, SI, and HG/WEL/KAI/SWC/CHI
and (B) 2 groups; SA and New Zealand Populations…………………………………………………………………69
TABLE 3.8 Maximum likelihood estimates of migration rate (M) and effective population size Θ) of
New Zealand and Australian Jasus edwardsii populations. Confidence intervals (90%) are
shown...………………………………………………………………………………………………………………………….……….70
TABLE 3.9 Reported mean annual commercial catch and CPUE values for New Zealand CRA zones (Star
2011) and South Australia Southern Zone (Linnane et al. 2011) for the Jasus edwardsii fishery
from 1990-2010 with standard deviations. Measurements of coastline were taken from Chiswell
and Booth (2003) for CRA zones………………………….………………………….…………………………….…………74
TABLE 4.1 Sinks: fate of phyllosoma hatched in each quota management area as predicted by Chiswell
and Booth (2008) Table should be read as follows: 18 % of phyllosoma released from CRA 1
metamorphosis in CRA 2..……………………………………………………..………………………………………………..91
TABLE 4.2 Sources of settlement (% in each quota management area as predicted by Chiswell and
Booth (2008). Table should be read as follows: CRA 1 receives 80 % of recruits from CRA 9…….91
14Chapter I: General Introduction
1.1 The Connectivity Conundrum
Most marine species, particularly benthic invertebrates, have a bipartite life cycle
consisting of a sessile adult stage and a dispersing propagule stage (larvae, egg or
spore). In some cases the dispersal stage can last for many months (Shanks et al.
2003), providing the opportunity for large-scale dispersal over vast oceanographic
distances. The traditional view for most of the 20 th century was that the marine
environment was a demographically open system characterized by high levels of
larval exchange between populations at large spatial scales (Caley et al. 1996; see
Levin 2006 for a review). This assumption was supported by: (1) the fact that a wide
range of marine taxa exhibit a planktonic larval stage; (2) the abundance of larvae in
offshore oceanic waters; and (3) the spatial and temporal scale of ocean currents
(Levin 2006).
There is now mounting empirical evidence, however, suggesting that larval exchange
in the marine environment often reflects that of a closed system and that larval
retention to natal habitats is a more common process than originally believed
(Swearer et al. 2002). The application of recent technological advances in genetics
(Taylor and Hellberg 2003, Baums et al. 2005) and elemental signature analysis
(Ruttenberg et al. 2005; Becker et al. 2007) have revealed complex patterns of
spatial structure and show that there are numerous cases in which species do not
form panmictic populations throughout their geographic range (Hilborn et al. 2003;
Crivello et al. 2005; Ruzzante et al. 2006). Instead, they are composed of a number of
demographically isolated units that may react independent of one another,
particularly to fishing pressure. Although the marine environment appears to have
few barriers to dispersal in comparison to freshwater or terrestrial systems (Waples
151998; Palumbi 1994), physical oceanographic processes (e.g. topographical eddies,
retention zones, coastal boundary layers) (Largier 2003) and larval behaviour (Fisher
2005; Gerlach et al. 2007) often act as barriers and prevent larval exchange between
populations. The influence that these retention mechanisms have on population
structure varies significantly across taxa and location, creating a wide range of
population connectivity throughout the marine environment (Figure 1).
Figure 1 The spectrum of population differentiation. Each circle represents a sub-population with
varying degrees of population divergence ranging from (D) panmixia to (A) complete isolation Taken
from Waples and Gaggiotti (2006).
1.2 Bio-geographical Complexities and the Stock Concept
The past several decades have been marked by the collapse of a number of
commercial fisheries despite having management strategies in place (Baum et al.
2003; Hilborn et al. 2003; Worm et al; 2006; Pinsky et al. 2011). This suggests that
previous strategies have either ignored or failed to accurately address important
biological processes of the harvested species (Sale et al. 2005). It is now widely
accepted that the foundation of an effective fishery management strategy must
incorporate a comprehensive understanding of population dynamics (Grimes et al.,
161987; Hilborn et al. 2003) and processes that play fundamental roles in shaping
population structure, such as larval dispersal and recruitment (Doherty 1981;
Bohanak 1999).
A stock is the basic unit used in fisheries management and is best defined as an intra-
specific group of randomly mating individuals with temporal and spatial integrity
(Ihssen et al. 1981). A variety of techniques exist to help identify independent stocks
for management and are fundamentally split into two groups: (1)
behavioural/ecological techniques such as mark-recapture, catch data, life history
characteristics, parasite tags and morphology; and (2) molecular techniques, which
include otolith microchemistry, stable isotopes and genetics. For a detailed account
of each of these methods see Begg and Walman (1999). All of the techniques aim to
identify discrete differences between populations and can range from a rather
simple process to a highly technical one requiring complex statistical analyses (Begg
and Walman 1999).
The stock identification process becomes extremely complicated when dealing with
highly fecund species that have a dispersing larval stage (Waples 1998). The logistics
behind physically tagging hundreds of thousands of microscopic larvae and
monitoring them as they disperse over large expanses of oceans are extremely
challenging if not impossible. Because larvae carry with them heritable genes,
genetic markers can serve as a natural ‘tag’ that can be used to help understand
population structure (Palumbi and Warner 2003). This has become an increasingly
popular technique, offering insightful information into the biogeography and
evolutionary divergence of a species (Shaklee and Bentzen 1998; Begg et al. 1999;
Cowen and Srinivasan 2006).
Genetic techniques ultimately aim to use inherited markers (e.g. allozyme,
mitochondrial DNA, nuclear DNA) to identify genotypes that characterize
populations (Coyle 1988; DeYoung and Honeycutt 2005). Over time, evolutionary
forces such as gene flow, genetic drift, mutation and selection drive genotypic
divergence in populations that are expressed as variations in the frequencies of
17alleles (Lowe and Allendorf 2010). This variation is used to interpret how sub-
populations across a species’ range are connected by the exchange of genes
(Palumbi 2003).
Marine resource management is often heavily weighted in politics, and there has
been a consistent trend for governments to disregard bio-geographical properties of
a targeted species in order to maximize short-term economic gain. The disregard for
genetic structure in particular can have severe negative impacts on genetic diversity
(Hauser et al. 2002) and consequently, the overall yield of the fishery (Ricker 1981).
Genetic diversity directly influences the adaptability of a species at the DNA level
and when greatly reduced, can seriously jeopardize the long-term sustainability of
the stock (Hauser et al. 2002; Hutchings and Baum 2005). This is particularly relevant
in the context of global climate change in a stochastic environment and should be a
top priority of all management strategies.
1.3 Microsatellite Loci
The marine environment is generally characterised by relatively high levels of gene
flow in comparison to freshwater or terrestrial systems (Ward et al. 1994; Waples
1998). Consequently estimates of genetic differentiation between populations are
usually on far finer scales. This is particularly the case when dealing with highly
dispersing marine organisms with long-lived larval stages. The ability to exchange
genes over large oceanographic distances places them towards the ‘open’ end of the
connectivity continuum, where genetic differentiation is at very low levels, often
below the resolving power of traditional molecular techniques such as allozyme or
mDNA analysis (Ward 2000). In order to detect differences that may hold biological
significance, highly polymorphic microsatellites have become the tool of choice in
modern stock identification studies for species that require high-resolution analysis
(Ward 2000).
Microsatellite loci are highly polymorphic DNA loci that are widely distributed
throughout the eukaryotic genome with an overall abundance in the order of 104-105
18(Shaklee and Bentzen 1998). The loci occur as simple sequence repeats (2-5 base
pairs) and are normally less than 300 bp long (DeYoung and Honeycutt 2005).
Microsatellite loci are generally considered to be selectively neutral (the majority
appear in non protein-coding portions of DNA) and are characterised by high levels
of mutation (slippage and proofreading errors), making microsatellite loci one of the
most variable types of DNA sequences in the genome (Weber 1990; Ward 2000).
This heightened degree of polymorphism (loci length variation) provides for far more
variation than allozyme or mitochondrial DNA-based techniques and thus, enhances
our ability to discriminate between individuals and populations on finer temporal
and spatial scales (Ward et al. 1994; Carvalho and Hauser 1994, Begg et al. 1999;
Chambers and MacAvoy 2000; Ward 2000). Furthermore, because the loci are
selectively neutral, any variation between populations can be attributed to gene flow
and genetic drift rather than local selection for specific genes.
An important consequence of the extremely high mutation rate of microsatellite loci
is that their underlying mutation pattern cannot be ignored (Balloux and Lugon-
Moulin, 2002). Two models have been developed that take different possible
mutation patterns of the loci into account: the Infinite Allele Model (IAM; Kimura
and Crow 1964) and the Stepwise Mutation Model (SMM; Kimura and Otha 1978).
The IAM assumes that the probability of any allele mutating to any other allelic state
(size) is the same, whereas the SMM has a memory of allele size and as a result
determines alleles of different sizes to be less related than those of similar sizes and
is thought to more accurately reflect the mutation pattern of microsatellite loci
(Balloux and Lugon-Moulin, 2002).
Microsatellites markers have recently become an extremely popular tool to
investigate patterns gene flow in the marine environment. Their highly polymorphic
nature has facilitated the detection of fine-scale spatial genetic variation that has
previously been gone undetected for a number of commercially targeted species
(Bentzen et al. 1996; Ruzzante et al. 1998; Crivello et al. 2005; Machado-Schiaffino et
al. 2010; Olsson et al. 2011). This has considerable implications for the future
management of the fisheries they support.
191.4 The New Zealand Rock Lobster Fishery
Jasus edwardsii was introduced into the New Zealand Quota Management System
(QMS) in 1990 and now supports New Zealand’s most lucrative seafood export
market, worth approximately $230 Million NZD annually (www.fish.govt.nz). It is
not only a lifeline to the commercial fishing industry but also plays an important role
in the customary fishing practices and history of the Maori. Furthermore, it is one of
the most popular recreationally fished species in the country, with almost 10 % of
total allowable catch (TAC) being allocated to the recreational sector. The
Commercial sector receives 78 % (roughly 2,800,000 kg) of the TAC, and the
remaining catch is allocated to the customary sector. In addition to TAC, the fishery
is also regulated by the provision of a minimum legal size, gear restrictions, season
closures and the prohibition against catching incubating females (“berried”) and soft
shelled individuals (“softies”) (NRLMG 2006 Annual Report).
Recorded commercial landings around the country have remained steadily below the
total allowable commercial catch (TACC) over the last 10 years. In 2010, 2.9 M kg of
rock lobster was landed nationally, a quota worth $770 M, only second to Hoki at
$814 M. 80% of this catch is shipped to Hong Kong where prices have almost
doubled since 2006, from $52 to $81 per kg (Ministry of Fisheries 2010).
The fishery is divided into 10 stocks, or CRA zones (Figure 2), with each allocated a
certain percentage of the annual TACC as set by the Ministry of Fisheries (The CRA
zones are divided furthermore into 43 statistical zones for stock assessment
purposes). CRA 10 is strictly an administrative zone and receives no commercial
fishing pressure. While these zones are currently used for that management of J.
edwardsii around New Zealand, they are not based on the biology of the species.
Previous allozyme (Smith et al. 1980; Booth et al. 1990) and mDNA (Ovenden et al.
1992) analysis support the assumption of J. edwardsii forming a single panmictic
population around the mainland of New Zealand (NRLMG Annual Report 2010).
20Figure 2 New Zealand Quota Management Areas for J. edwardsii.
211.5 Jasus edwardsii Biology
Jasus edwardsii (family Palinuridae) inhabits coastal and offshore-seamount rocky
reef habitat around New Zealand and southern Australia (Kensler 1967; Ovenden et
al. 1992). Their range encompasses a wide geographic area from Three Kings Islands
in the north, to the Auckland Islands in the south and from Western Australia east to
the Chatham Islands. They are keystone predators of sub-tidal reef systems and play
an important role in organising community structure and ecosystem functioning
(Shears and Babcock 2003). A dorsal view of an adult is provided in Figure 3.
Fecundity in spiny lobsters is a function of body size, and large J. edwardsii females
(160 mm CL) are capable of producing up to 500,000 eggs annually (Annala and
Bycroft 1987). Fecundity is so high that large females often mate a number of times
prior to oviposition to ensure sufficient sperm supply to fertilize all the eggs in her
brood (MacDiarmid and Butler 1999). As with all palinurids, fertilization is external
with the male depositing a spermatophoric mass on the underside of the female
abdomen, which is used to fertilize the eggs stored on her pleopods. Following
mating events (usually around June), incubating females migrate offshore to deeper
waters on the outer fringes of the reefs (MacDiarmid 1991). Hatching events
predominantly take place in high-energy inshore environments during spring
(September/October), which is thought to be a behavioural adaptation that aids in
dispersal (Booth and Tarring 1986, Chiswell and Booth 1999).
The larval stage of the J. edwardsii bipartite life cycle consists of planktonic
(nauplisoma and phyllosoma) and nektonic (puerulus) phases. The nauplisoma is the
pre-zoea that emerges from the egg following a hatching event and is short-lived
(hours) and very small in size (1 mm length) (Booth and Phillips 1994). The
nauplisoma is rapidly transformed into the stage-1 phyllosoma, a leaf-like
transparent zoea that is much larger and longer lived than the nauplisoma. The
phyllosomas remain in offshore oceanic waters for up to 20 months as they undergo
a series of developmental changes (11 stages, 17 Instars) before metamorphosing
into the puerulus, the post-zoea transitional form (Booth and Phillips 1994). The final
stage of the phyllosoma larva is shown in Figure 4.
22Figure 3 Adult J. edwardsii: Total length 25.4 cm. Taken from Kensler (1967).
23Although capable of diurnal vertical movements, the phyllosoma are considered
poor swimmers (Kittaka 1994), and dispersal is largely dependent on current and
wind. Metamorphosis from the phyllosoma larvae into the nektonic puerulus stage is
thought to take place mainly near the continental shelf break (Booth 1994) and ends
J. edwardsii’s planktonic larval stage. The transparent puerulus (13 mm CL) has a
body plan that resembles the adult form, with newly developed pleopods (Figure 5)
that facilitate horizontal swimming (Kittaka et al. 2005).
The metamorphosis into the puerulus is thought to be immediately followed by rapid
movement towards the coast to recruit to the benthos. Jeffs et al. (2001) calculated
that the non-feeding puerulus have enough nutrient reserves for a mean net swim
distance of 200 km, which infers the maximum distance from the coast that
metamorphosis can take place in order for the puerulus to successfully recruit to the
shore. In light of this, it is presumed that late-stage phyllosoma delay
metamorphosis until triggered by some biological or physical cue (such as low-
salinity shelf water) to ensure that they are close enough to the coast to survive the
trip (Philips and McWilliams 1986; Jeffs et al. 2001; Chiswell and Booth 2005).
Another possibility is that final-stage phyllosoma begin to exhibit horizontal
swimming behaviour prior to metamorphosis to bring them closer to the shelf
(Chiswell and Booth 1999). Puerulus recruit to a variety of habitats from the shallow
sub-tidal zone to depths of up to 50 m and immediately display the shelter-seeking
behaviour that is also characteristic of adults (Kittaka et al. 2005). The first molt into
the juvenile stage happens within weeks after settlement (Booth and Phillips 1994).
Jasus edwardsii is thought to have the longest-lived larval durations of any marine
organism (Booth and Phillips 1994). This complex life history coupled with the
dynamic environmental conditions of the south-west Pacific Ocean and Tasman Sea,
provides the potential for large-scale dispersal and subsequently high levels of gene
flow between populations.
24Figure 4 The final developmental stage of J. edwardsii phyllosoma larvae. Total length is 43.5mm.
Taken from Kittaka et al. (2005).
Figure 5 Distinguishing features of J. edwardsii phyllosoma instars 13, 15 and 17; pl, pleopod; u,
uropod; ls, lateral spine. Bar indicates 1mm. Notice instar 17 uropods and pleopods fully segmented
and differentiated from the abdomen and are fringed with setae presumably for advanced swimming
ability. Modified from Kittaka et al. (2005).
251.6 Previous Genetic Analysis
The earliest genetic analysis of J. edwardsii (Smith et al. 1980) aimed to identify
inter-specific differences between J. edwardsii of New Zealand and J.
novaehollandiae of Australia (now considered conspecific populations) using 21
proteins encoded by 33 loci. The study found no significant genetic differentiation
between samples collected around New Zealand and Australia. Polymorphism was
detected in only one of the 33 loci, and genetic identity over all loci between the two
species was 0.997, a value typical of conspecific populations supporting the notion
that they are a single species (Smith et al. 1980). The study suggested that the
genetic homogeneity indicated an ‘open loop system’ of larval recruitment. A decade
later, Booth et al. (1990) used one polymorphic locus (Ldh allele) to further
investigate the genetic relatedness of J. edwardsii and J. novaehollandiae
populations. The analysis found no detectable heterogeneity across New Zealand
samples, supporting findings from Smith et al. (1980), and concluded that keeping
the two species separated was unjustified. Either trans-Tasman gene flow was
homogenizing the gene pool, or the populations diverged quite recently on an
evolutionary time scale. Ovenden et al. (1992) conducted a mitochondrial DNA
analysis, the most sensitive technique available for stock assessment at the time
(Wirgin and Waldman 2005). Samples were collected from Western Australia to the
east coast of New Zealand spanning 4,600 km of the species range. The analysis
found no genetic sub-divisions across all samples and suggested that the trans-
Tasman populations were exchanging high levels of genes and proposed that New
Zealand lobster populations may be heavily reliant on Australian populations for
recruits.
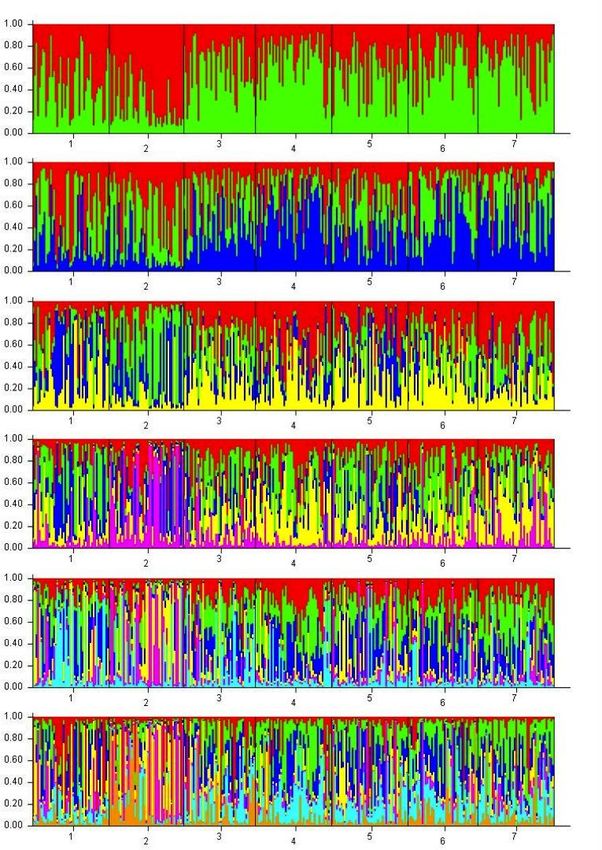
1.7 Physical Processes Affecting Gene Flow
New Zealand sits in the south-west corner of the South Pacific gyre with a
predominantly eastern flowing current system (Chiswell 2009). The main current
systems that influence the region are a product of the Tasman Front in the north and
the Sub-Tropical Front in the south (Figure 6).
26Figure 6 Prevailing currents of the waters surrounding New Zealand. Courtesy of Sebastian Hernandez.
27Warm water from the East Australian Current (EAC) moves southward along the
edge of the Australian shelf where it collides with the Tasman Sea at around 34°S
and flows eastward, commonly known as the Tasman Front (TF) (Chiswell 2009).
The TF gives rise to the East Auckland Current (EAUC) that runs south-east along the
north end of the North Island. Near the East Cape, a main portion of EAUC flow turns
north, and the remainder forms the East Cape Current (ECC) that moves southward
along the east coast (Heath 1982). The ECC re-circulates around the Wairarapa Eddy
at roughly 41°S and then flows eastward along the Chatham Rise (Chiswell and Booth
1999). The Sub-Tropical Convergence (STC) carries cold, nutrient-rich water from
southern Australia over to Fjordland and Stewart Island at roughly 45°S (Heath 1982).
The STC meanders along the continental shelf up the east coast of the South Island
and is commonly referred to as the Southland Front (Heath 1982). Like the ECC, the
Southland Front eventually hits the Chatham Rise and is deflected eastward.
The easterly prevailing current system drives a defined flow down the east coast of
the North Island and up the east coast of the South Island, both eventually hitting
the Chatham Rise and deflecting eastward. The Wairarapa Eddy, caused by the
retroflection of the ECC, is one of the largest interruptions to this flow, and is
thought to act as an important larval retentive mechanism for the North Island east
coast populations (Chiswell and Booth 1999).
1.8 Oceanographic Models
In addition to the genetic studies conducted on J. edwardsii, several studies have
used oceanographic models to investigate patterns of larval dispersal and
recruitment around New Zealand and Australia. Chiswell and Booth (2008)
developed a model using a Langrangian approach where J. edwardsii larval dispersal
paths from each of the CRA zones were simulated using time-varying ocean currents
from 1995-2003 derived from a satellite altimeter. The aim was to determine the
contribution of each CRA zone to recruitment around the country to identify source-
sink relationships between management areas. The fate of larvae released in
28different zones varied substantially, and the results indicated a complex source-sink
relationship between individual CRA zones. The results of this model provided insight
into the demographic connectivity and transport of phyllosoma larvae around New
Zealand.
The prevailing easterly flow of the region and undetectable trans-Tasman genetic
differentiation (Ovenden 1992) suggests that New Zealand lobster stock may be
heavily reliant on Australian populations for recruitment (Smith et al. 1980; Booth et
al. 1990; Ovenden 1992). High densities of adult populations of J. edwardsii occur
along the southern Australian coastline (Victoria, South Australia and Tasmania)
(Phillips et al. 2000) and high numbers of mid-late stage phyllosoma larvae have
been reported throughout the Tasman Sea (Booth et al. 1990; Booth and Ovenden
2000). Chiswell et al. (2003) modelled flow rates across the Tasman Sea and
reported that passive drift across the body of water occurred at rates within the
larval duration of J. edwardsii lifecycle and concluded that trans-Tasman dispersal
was “likely to be a viable mechanism to maintain New Zealand Lobster.”
1.8 Thesis Aims
Given the economic importance of J. edwardsii to New Zealand, understanding
population structure and patterns of gene flow across the Tasman Sea is a top
priority for the New Zealand Rock Lobster Industry Council (NZRLIC). The aims of this
thesis are to: (1) re-examine the genetic stock structure of the red rock lobster Jasus
edwardsii to test the null-hypothesis of panmixia by applying highly polymorphic
microsatellite markers around New Zealand and across the Tasman Sea; (2) to
characterise and quantify trans-Tasman gene flow and demographic connectivity
between Australia and New Zealand; and (3) to determine if patterns of genetic
diversity and connectivity can be explained using oceanographic models.
Chapter 2 presents the development and characterisation of novel microsatellite
markers (the first to be developed for J. edwardsii) and is followed by the application
29of those markers in a population study around New Zealand and Australia in Chapter
3. Chapter 4 will seek to explain those patterns using oceanographic models and
conclude with suggestions for future management based on the results of the
genetic analysis.
1.9 Literature Cited
Annala, J.H. & Bycroft, B.L. (1987) Fecundity of the New Zealand red rock lobster,
Jasus edwardsii. New Zealand Journal of Marine and Freshwater Research, 21,
591-597.
Balloux, F. & Lugon-Moulin, N. (2002) The estimation of population differentiation
with microsatellite markers. Molecular ecology, 11, 155-65.
Baum, J.K. et al. (2003) Collapse and conservation of shark populations in the
Northwest Atlantic. Science, 299, 389-92.
Baums, I.B., Miller, M.W. & Hellberg, M.E. (2005) Regionally isolated populations of
an imperiled Caribbean coral, Acropora palmata. Molecular ecology, 14,
1377-1390.
Becker, B.J., Levin, L. a, Fodrie, F.J. & McMillan, P.A. (2007) Complex larval
connectivity patterns among marine invertebrate populations. Proceedings of
the National Academy of Sciences of the United States of America, 104, 3267-
3272.
Begg G.A. & Waldman J.R. (1999), A holistic approach to stock identification.
Fisheries Research, 43, 35-44.
Begg, G.A., Friedland, K.D. & Pearce, J.B. (1999) Stock identification and its role in
stock assessment and fisheries management: an overview. Fisheries Research,
43, 1-8.
Bentzen, P., Taggart, C.T., Ruzzante, D.E. & Cook, D. (1996) Microsatellite
polymorphism and the population structure of Atlantic cod (Gadus morhua)
in the northwest Atlantic. Canadian Journal of Fisheries and Aquatic Sciences,
53, 2706-2721.
Bohonak AJ (1999) Dispersal, gene flow, and population structure, The Quarterly
Review of Biology, 74, 21-45.
Booth, J.D. & Phillips, B.F. (1994) Early life history of spiny lobster. Crustaceana, 66,
271-294.
30Booth, J.D. & Tarring S.C. (1986) Settlement of the red rock lobster, Jasus edwardsii ,
near Gisborne, New Zealand. New Zealand Journal of Marine and Freshwater
Research, 20, 291-297.
Booth, J.D. (1994) Jasus edwardsii larval recruitment off the east coast of New
Zealand, Proceedings of the Fourth International Workshop on Lobster
Biology and Management. Crustaceana, 66, 295-317.
Booth, J.D., Street, R.J. & Smith, P.J. (1990) Systematic status of the rock lobsters
Jasus edwardsii from New Zealand and J . novaehollandiae from Australia.
New Zealand Journal of Marine and Freshwater Research, 24, 239-249.
Botsford, L. (2001) Physical influences on recruitment to California Current
invertebrate populations on multiple scales. ICES Journal of Marine Science,
58, 1081-1091.
Bradbury, I.R., Laurel, B., Snelgrove, P.V.R., Bentzen, P. & Campana, S.E. (2008)
Global patterns in marine dispersal estimates: the influence of geography,
taxonomic category and life history. Proceedings. Biological sciences / The
Royal Society, 275, 1803-1809.
Caley, M.J. et al. (1996) Recruitment and the local dynamics of open marine
populations. Annual Review of Ecology and Systematics, 27, 477-500.
Carson, H.S., Cook, G.S., Lopez Duarte, P.C. & Levin, L.A. (2011) Evaluating the
importance of demographic connectivity in a marine metapopulation.
Ecology, 92, 1972-1984.
Carvalho G.R, & Hauser L. (1994) Molecular genetics and the stock concept in
fisheries. Reviews in Fish Biology and Fisheries, 4, 326-350.
Chambers G.K. & MacAvoy E.S. (2000) Microsatellites: consensus and controversy.
Comp. Biochem. Physiol. Biology, 126, 455-476
Chiswell, S.M. & Booth, J.D. (1999) Rock lobster Jasus edwardsii larval retention by
the Wairarapa Eddy off New Zealand. Marine Ecology Progress Series, 183,
227-240
Chiswell, S.M. & Booth, J.D. (2005) Distribution of mid- and late-stage Jasus
edwardsii phyllosomas : Implications for larval recruitment processes. New
Zealand Journal of Marine and Freshwater Research, 39, 1157-1170
Chiswell, S.M. & Booth, J.D. (2008) Sources and sinks of larval settlement in Jasus
edwardsii around New Zealand : Where do larvae come from and where do
they go? Marine Ecology Progress Series, 354, 201-217
31Cowen, R.K. (2002) Oceanographic influences on larval dispersal and retention and
their consequences for population connectivity. Coral Reef Fishes, Chapter 7,
149-170, Copyright© Academic Press.
Coyle, T. (1988) Stock identification and fisheries management: the importance of
using several methods in a stock identification study. Taking Stock: defining
and managing shared resources, Proceedings from the Australian Society for
fish biology 173-182.
Crivello, J.F., Jr, D.F.L. & Keser, M. (2005) The genetic stock structure of the american
lobster (homarus americanus) in Long Island Sound and Hudson Canyon.
Journal of Shellfish Research, 24, 841-848.
DeYoung R.W. and Honeycutt R.L. (2005) The Molecular tool box: Genetic techniques
in wildlife ecology and management, Journal of Wildlife Management, 69, 4
1362-1384
Doherty PJ. (1981) Coral reef fishes: recruitment-limited assemblages? Proc. 4th Int.
Coral Reef Symp, 2, 465-70
Fisher, R. (2005) Swimming speeds of larval coral reef fishes: impacts on self-
recruitment and dispersal. Marine Ecology Progress Series, 285, 223-232.
Garoia, F., Guarniero, I., Ramsak, A., Ungaro, N., Landi, M., Piccinetti, C., Mannini, P.
& Tinti, F. (2004) Microsatellite DNA variation reveals high gene flow and
panmictic populations in the Adriatic shared stocks of the European squid
and cuttlefish. Hereditry, 93, 166-174.
Gerlach, G., Atema, J., Kingsford, M.J., Black, K.P. & Miller-Sims, V. (2007) Smelling
home can prevent dispersal of reef fish larvae. Proceedings of the National
Academy of Sciences of the United States of America, 104, 858-863.
Gilg, M.R. & Hilbish, T.J. (2003) The geography of marine larval dispersal: Coupling
genetics with fine-scale physical oceanography. Ecology, 84, 2989-2998.
Hauser, L., Adcock, G.J., Smith, P.J., Ramiréz, J.H.B. & Carvalho, G.R. (2002) Loss of
microsatellite diversity and low effective population size in an overexploited
population of New Zealand snapper (Pagrus auratus). Proceedings of the
National Academy of Sciences of the United States of America, 99, 11742-
11747.
Hauser, L. & Carvalho, G.R. (2008) Paradigm shifts in marine fisheries genetics: ugly
hypotheses slain by beautiful facts. Fish and Fisheries, 9, 333-362.
Heath, R.A. (1982) A review of the physical oceanography of the seas around New
Zealand. New Zealand Journal of Marine and Freshwater Research, 19, 79-
124.
32Hedgecock, D., Barber, P.H. & Edmands, S. (2007) Genetic approaches to measuring
connectivity. Oceanography 20, 70-79.
Hilborn, R., Quinn, T.P., Schindler, D.E. & Rogers, D.E. (2003) Biocomplexity and
fisheries sustainability. Proceedings of the National Academy of Sciences of
the United States of America 100, 6564-8.
Hutchings, J.A & Baum, J.K. (2005) Measuring marine fishes biodiversity: temporal
changes in abundance, life history and demography. Philosophical
transactions of the Royal Society of London. Series B, Biological Sciences, 360,
315-338.
Hutchinson, W.F., Carvalho, G.R. & Rogers, S. (2001) Marked genetic structuring in
localized spawning populations of cod Gadus morhua in the North Sea and
adjoining waters as revealed by microsatellites. Marine Ecology Progress
Series, 223, 251-260.
Ihssen P.E., Booke H.E., Casselman J.M., McGlade J.M., Payne N.R. & Utter F.M.
(1981) Stock identification: materials and methods. Canadian Journal of
Fisheries and Aquatic Sciences 38, 1838-1855.
Jeffs, A.G., Chiswell, S.M. & Booth, J.D. (2001) Distribution and condition of pueruli of
the spiny lobster Jasus edwardsii offshore from north-east New Zealand.
Marine and Freshwater Research, 52, 1211-1216.
Jones, G.P., Milicich, M.J., Emslie, M.J. & Lunow, C. (1999) Self-recruitment in a coral
reef fish population. Nature, 402, 802-804.
Kimura, M. & Crow, J.F. (1964) The number of alleles that can be maintained in a
finite population. Genetics 49, 725-738.
Kimura, M. & Ohta, T. (1978) Stepwise mutation model and distribution of allelic
frequencies in a finite population. Proceedings of the National Academy of
Sciences of the United States of America, 75, 2868-2872.
Kittaka, J. (1994) Culture of phyllosomas of spiny lobster and its application to
studies of larval recruitment and aquaculture. Crustaceana, 66, 258-270.
Kittaka, J., Ono, K., Booth, J. & Webber, W.R. (2005) Development of the red rock
lobster, Jasus edwardsii, from egg to juvenile. New Zealand Journal of Marine
and Freshwater Research, 39, 263-277.
Krug, P.J. & Zimmer, R.K. (2004) Developmental dimorphism: consequences for larval
behavior and dispersal potential in a marine gastropod. The Biological
Bulletin, 207, 233-246.
33You can also read