VALUING THE ROLE OF CONSTRUCTION IN THE NEW ZEALAND ECONOMY - PWC
←
→
Page content transcription
If your browser does not render page correctly, please read the page content below
pwc.co.nz

                          Valuing the role
                          of construction
                          in the New
                          Zealand
                          economy
                          A report to the
                          Construction Strategy Group
An economic analysis      in association with
of the construction
sector that highlights
its value to the New      Construction Industry Council
Zealand economy and
the issues which affect
                          BRANZ
its performance

September 2016

                          Final Report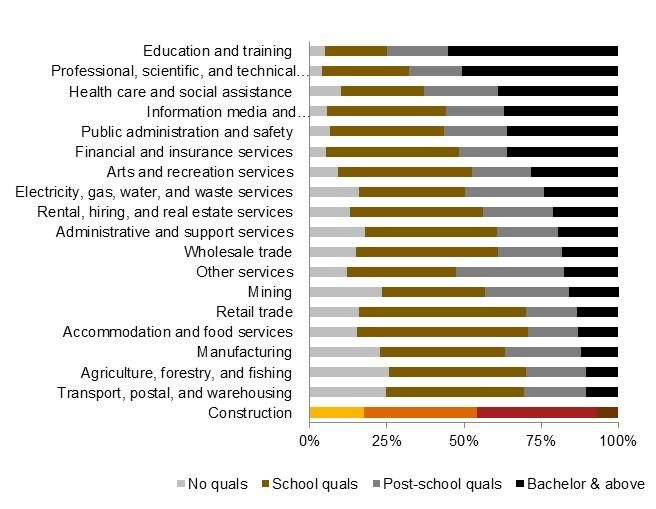
This project, undertaken by PwC, was funded by the Construction Strategy Group, the Construction
Industry Council and BRANZ.
Geoff Hunt
Chair
Construction Strategy Group
PO Box 90626
Victoria St West
Auckland 1142

30 September 2016

Valuing the role of construction in the New Zealand economy
Dear Geoff,

We are pleased to provide our report on the role and value of the construction sector in New Zealand
and the issues which affect its performance.

This report is provided in accordance with the terms of our letter of engagement dated 20 May 2016,
and is subject to the restrictions set out in Appendix C of this report.

If you have any queries please do not hesitate to contact us.

Yours sincerely

Craig Rice                                        Richard Forgan
Partner                                           Partner
craig.rice@nz.pwc.com                             richard.c.forgan@nz.pwc.com
09 355 8641                                       04 462 7118

PricewaterhouseCoopers, 188 Quay Street, Private Bag 92162, Auckland 1142, New Zealand
T: +64 9 355 8000, F: +64 9 355 8001, pwc.co.nz
Table of contents
Key points                                                             i
Executive summary                                                    iii
Recommendations                                                      xi
1.    Introduction                                                    1
2.    The scale and value of the Construction sector                  2
3.    The construction sector’s inter-industry relationships         19
4.    Performance of the construction sector                         23
5.    Structural constraints and opportunities for addressing them   29
Appendix A:          Data classification                             49
Appendix B:          Joint statement by CSG and CIC chairs           50
Appendix C:          Restrictions                                    51

Report to the Construction Strategy Group
PwC
Key points
The construction sector plays a large role in New Zealand’s economy, contributing strongly to employment,
businesses and GDP. It is New Zealand’s fifth-largest sector by employment, comprising around 178,100
FTEs, with another 53,600 FTEs in construction-related services. Together, this accounts for 10% of total
employment across the economy. Construction and construction-related services contributed 8% of New
Zealand’s total GDP in 2015, and has an even greater impact when integration with other parts of the
economy is considered.

The Construction sector delivers almost as much of New Zealand’s GDP as the whole of the Waikato region,
and this contribution is growing. Over the last three years core construction has seen 17% GDP growth,
overtaking wholesale trade to become the 8th biggest contributing sector to GDP.1 Out of the top ten
individual sectors by contribution to New Zealand’s GDP, construction supported the highest job growth
between 2012 and 2015, with core construction contributing one out of every five new jobs in New Zealand
(26,000 new jobs). In contrast, the agriculture, forestry and fishing sector, for example, contributed a much
smaller 330 new jobs over the same period. Adding in construction related services means the sector is
even more significant.

There is a large return to New Zealand’s economy from support for a sector that continues to struggle with
the cyclical nature of work and low productivity. Since 2012, measured labour productivity has increased by
only 1%. Every 1% increase in labour productivity for construction yields an increase in GDP of around
$139m, even before multiplier effects are considered. Supporting the sector by smoothing sources of
volatility means that gains in underlying productivity are not lost when the sector encounters a bust. Over
the long-term, gains in productivity and multiplier effects would compound to produce even larger benefits.

More broadly, improving performance of the sector provides a range of benefits which will be shared by the
industry and consumers. For the industry, this means improved profit margins, better skills development
and earning opportunities and a better ability to weather the cyclical nature of the industry. For consumers,
this means that high quality construction will cost less, involve fewer project delays and have a wider
variety of options to satisfy consumer demand.
Without change, the sector will struggle to meet medium term demand. There is a significant task ahead to
accommodate new private sector and government demand, compounded by the housing shortage in
Auckland. The recently released decisions version of the Proposed Auckland Unitary Plan provides for an
additional 422,000 dwellings over the next 30 years. The opportunity for the construction sector is
significant, but the sector will not be able to meet the challenge without change.
This report identifies a number of areas in which government, industry and consumers could make changes
that would help improve the productivity and performance of the industry.

A recurring theme from our interviews with industry participants was that the government should take
advantage of the current conditions and work more closely to smooth volatility in the cycle. The
government could plan its investment programme to support the industry in a downturn. In this regard,
the same value of funds would be spent but the timing would be used as a tool to smooth volatility when
private sector demand drops. There is the potential to avoid a bust if government sector demand can
counteract falling private sector demand.

In addition, a common theme from industry participants was that there was a clear need for government
procurement processes to improve. Greater uptake of standard contracts and the potential for MBIE’s
procurement guidelines to become mandatory during government procurement, unless there were strong

1   Using 1 digit ANZSIC industries.

Report to the Construction Strategy Group
PwC                                                                                                    Page i
reasons not to use these, were touted as areas which would provide an immediate impact for the sector
while having minimal impact on the government.
More broadly, initiatives the government could take include:
encouraging labour supply through immigration and funding training programmes
increasing the use of standardised contracts
integrating design and build functions during procurement
procuring at scale to ensure economies of scale are achieved
promoting counter-cyclical investment to smooth construction activity
considering improvements to regulatory regimes that negatively impact on construction sector
performance
assessment of the costs and benefits of new regulations should be undertaken by government
before they are introduced, and existing legislation relating to liabilities and retentions should be
reviewed through this lens
consideration should be given to options for streamlining consenting processes and rationalising
the number of Building Consent Authorities to improve consistency in consenting and compliance
processes.
Recognising that the industry responds rationally to the operational framework constructed by the
government, changing that framework creates incentives for the industry to invest, innovate and improve
the sector. However, there are initiatives that the industry itself could undertake to assist with improving
its own performance:
The industry could help grow its productivity through investment in skills, training, innovation,
promoting better contracting practices and exploring options for improved quality assurance
processes.
The industry is facing a labour shortage across the skills spectrum, with a particular shortage in
higher-value roles. The industry could look to recruit workers from other sectors with transferable
skills (eg project managers). Design-related roles are currently a key bottleneck, so encouraging
graduates in this, and other high-value areas would support the industry over the longer term.
Finally, consumers can also play a role in improving the performance of the construction industry.
Clients and consumers could contribute to better performance of the industry through encouraging
improved project management practices, considering whole-of-life-costs for construction projects
and having greater acceptance of standardisation of products and components as well as mass-
customisation in construction.
Report to the Construction Strategy Group
PwC Page ii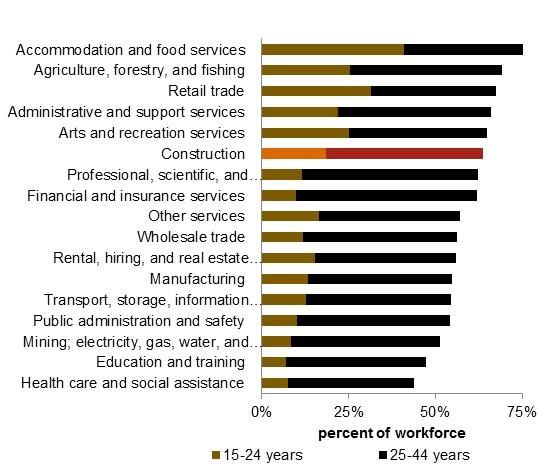
Executive summary
The construction sector is a significant contributor to New Zealand’s economy, delivering 8% of gross
domestic product (GDP) and 10% of national employment, a contribution which is growing, diversifying
and parts are becoming more efficient as the sector develops. However the sector suffers from a number of
external and internal constraints which limit its productivity and performance. This report examines the
size and scale of the sector, the nature of the constraints it faces, and provides recommendations for
government, the industry and consumers to help overcome these issues.

Background to this report
This report provides an update to our 2011 report entitled “Valuing the role of Construction in the New
Zealand economy”. It was commissioned by the Construction Strategy Group (CSG), in association with
the Construction Industry Council (CIC) and BRANZ in order to demonstrate to government and other
stakeholders the value and significance of the sector, and ensure the profile of the construction industry is
up to date.
Our previous report highlighted the value of the construction sector, and the key role it plays in the New
Zealand economy. However, it identified that the boom-bust nature of the sector was clearly a problem,
and was a barrier to improving its productivity and overall performance. We stated that Government’s key
focus needs to be in developing forward certainty for the sector, allowing it to maintain and develop skills,
and boost labour productivity. We set out a number of options which Government could consider which
could enable a more consistent and predictable environment for the sector.

This report looks at the state of the construction sector five years on. The previous report was written at the
bottom of the cycle, whereas today the sector is operating in a boom. However, while the state of the
industry has changed significantly, the underlying structural issues which were identified in our previous
report largely remain today, and the impact of the business cycle on the sector is just as strong.

Since our 2011 report, there has been some progress on improving the performance of the sector. One of
the highlights has been the publication of MBIE’s National Construction Pipeline report, an annual feature
since 2013. This was a direct response of the Government to provide more certainty on the future work
programme for the sector. MBIE’s Pipeline report and the Future Demand for Construction Workers
report, have been very well received by industry participants to support investment and workforce
planning.

The purpose of this report is to update the information on the value of the sector, and also to reconsider the
issues identified in 2011 through a combination of data, literature and interview-based research. We then
reconsider opportunities for improving the performance of the sector.

The construction sector is a major part of NZ’s economy
The construction sector plays a large role in New Zealand’s economy, contributing strongly to employment,
businesses and GDP.

It is New Zealand’s fifth-largest sector by employment, comprising around 178,100 FTEs, with another
53,600 FTEs in construction-related services. Together, this accounts for 10% of total employment across
the economy. Out of the top ten individual sectors by contribution to New Zealand’s GDP, construction
supports the highest job growth between 2012 and 2015. Core construction contributed 26,000 jobs, or one
in every five new jobs in New Zealand, between 2012 and 2015. In comparison, other traditional industries
such as agriculture, forestry and fishing which only offered 330 new jobs over the same period.

Report to the Construction Strategy Group
PwC                                                                                                     Page iii
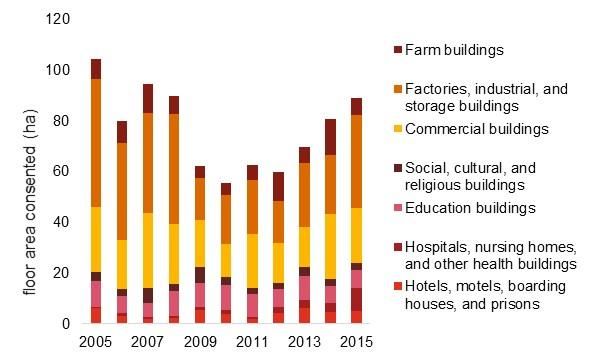
Figure 1 The Construction sector’s share of New Zealand employment, businesses and GDP
         in 2015

Source: PwC Regional Industry Database

Construction and construction-related services contributed 8% of New Zealand’s total GDP in 2015.
However, this impact is much greater when the integration with other parts of the economy is considered.
Not only does construction impact GDP directly, it also enables other sectors to expand their economic
activity, for example through the development of new commercial building space, factories, industrial and
storage buildings, farms and infrastructure.

Around 54% of New Zealand’s 2015 gross fixed capital formation (GFCF, a measure of the economy’s
investment in capital assets) was facilitated through the construction sector. This shows that the sector
plays the key role in building New Zealand’s infrastructure stock, which is the foundation of productivity
and economic growth.

Construction activity is concentrated in New Zealand’s three main regions – Auckland, Canterbury and
Wellington. Together, these three regions make up 60% of total employment in core construction in New
Zealand.

Demand for construction services is largely driven by the private sector, but public demand also plays a key
role. Currently, around 25% of overall GFCF investment is contributed by public sector entities. This
proportion is typically higher at low points in the construction sector cycle; it was around 31% in 2010.

The national input-output tables show that one dollar invested in the construction sector currently
generates around two dollars and eighty cents of total economic activity. The sector has one of the highest
multiplier impacts of any sector in the economy. This is because of the major impact that construction
spending has in stimulating other sectors in its supply chain and through its workers spending their
incomes.

The construction sector is volatile
The construction sector is characterised by high volatility in employment and GDP compared to other
sectors in New Zealand. It is even more volatile than other sectors like hospitality and retail trade, which
are typically perceived to be disproportionally subject to fluctuations in business cycles.

Report to the Construction Strategy Group
PwC                                                                                                     Page iv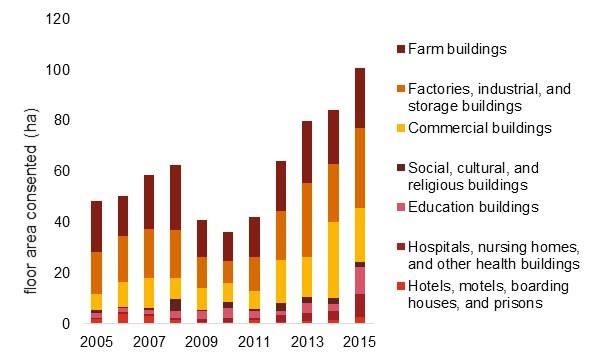
Figure 2 Despite the strong performance in recent years, construction still exhibits greater
volatility than other sectors
Source: PwC analysis, Statistics New Zealand
This has a number of implications for the sector. In periods of high demand, the sector suffers from
capacity constraints, while in downturns it sheds a greater number of jobs than in other sectors. In
addition, it creates significant uncertainty about future demand. This makes it difficult for businesses to
plan for the future. It can discourage investment in skills, additional labour, capital assets, and new
processes. In general, the prevalence of large demand cycles underlines the ability of the sector to grow
sustainably over time.
Currently the sector is operating in a boom
The picture and outlook for construction in New Zealand has changed significantly since our previous
report. In the midst of a trough in the construction boom-bust cycle, the 2011 report was prepared at a
time when the sector was weak. Today, the situation has changed dramatically as the sector grapples with
increased demand from the Christchurch rebuild, earthquake strengthening, leaky building remedial work,
strong residential demand in Auckland, increased business confidence and a forward infrastructure plan
worth $54.9 billion over the next 10 years.2
The number of FTEs employed in the sector has increased by over 18% since 2012, which has expanded the
size of the sector to 10%. Similarly, construction’s contribution to GDP has increased from 4% to 8% since
2010.
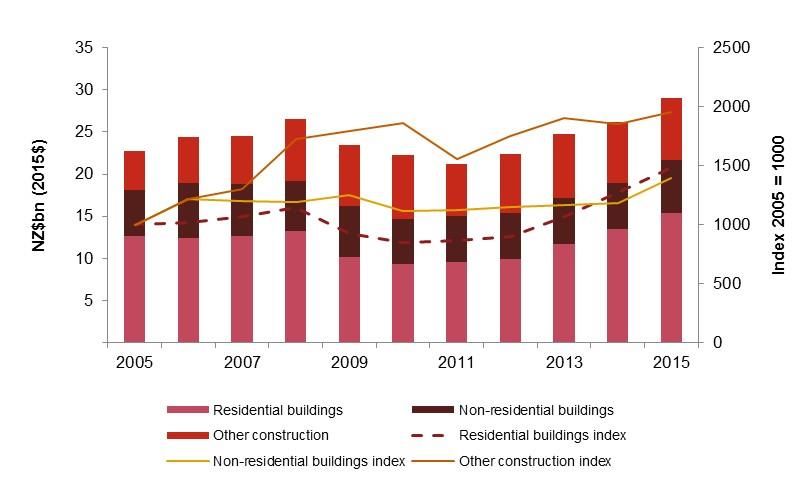
Illustrating the growth in demand, consenting levels have increased markedly. The total value of consented
work in 2015 was 73% higher (in real terms) than the value in 2011. The majority of this increase has
occurred in Auckland and Christchurch.
2 Central government and local government investment intentions 2017 – 2026.
Report to the Construction Strategy Group
PwC Page v
Figure 3 Regional breakdown of all construction consents by value ($2015 real) 3

Source: PwC analysis, Statistics New Zealand

Average incomes in the sector are relatively low, but there remain many opportunities for workers
including higher-skilled workers
Average earnings in construction have been rising over time, but remain lower than the average for the New
Zealand economy as a whole. However there is quite a wide variation of income levels in the sector. In
particular, the sector includes a number of relatively high-skilled roles (including design, supervisory and
project management roles) which typically require tertiary qualifications and offer high wage opportunities
for workers.

The unique requirements of the sector mean that workers are more likely to get a specialist post-school
qualification, rather than a university degree. The construction sector has the highest percentage of
workers with a post-school qualification (out of 19 industries) as their highest level of qualification, but the
lowest percentage of Bachelor degrees. However, the workers in construction with higher education play
an important role in the construction value chain, and the number of people with a Bachelor (or higher)
degree is increasing. Between the 2006 and 2013 census years, the number of workers in construction with
a Bachelor (or higher) degree grew by 49%.

The need for higher-skilled workers is likely to increase over time if the sector moves towards undertaking
more innovative approaches to construction. The use of innovative approaches to design and new building
models would require graduates and higher-skilled workers to support the new processes.

Even in the absence of significant innovation, there is an increasing need for higher-skilled workers. MBIE
forecasts an additional 49,000 construction-related jobs will be needed between 2015 and 2021, including
an additional 2,282 jobs for higher-skilled roles such as construction project managers, civil engineering
professionals and architectural, building and surveying technicians.

Construction sector workers are younger, on average, than across the whole economy. Construction
provides useful opportunities to young workers, including those with relatively little experience, often
giving them their first job in their working careers. Construction offers opportunities to workers at all levels
across the skill and experience spectrum.

While the construction sector is very much male-dominated, the proportion of women employed has been
growing over the last ten years. Furthermore, the average hourly earnings for women is higher than that
for male employees ($27.96 per hour for females vs $26.14 per hour for males). This is largely a result of

3   Includes consents for new structures, and alterations and additions to existing structures.

Report to the Construction Strategy Group
PwC                                                                                                      Page vi
the different roles which women take in the sector – they are more likely to be in higher-skilled, higher-
paying roles (as evidenced by the relative average hourly wages).
Productivity in the sector is relatively poor
While the sector is currently operating in a boom, there remains a significant opportunity to improve the
performance of the sector, resulting in better outcomes for firms and consumers. For firms, this means
better profit margins, opportunities for skills development and higher earnings, and better opportunities to
weather the cyclical nature of the industry.
Construction is a labour-intensive industry and as such labour availability, capability and productivity are
key drivers of sector performance. Labour productivity in the sector is well below the national average and,
although this is not uncommon amongst labour-intensive industries, there is scope for significant
improvements in this area.
We estimate that a 1% increase in labour productivity for construction yields an increase in GDP of around
$139m, even before multiplier effects are considered. Given the low labour productivity base off which
construction is growing, sustained increases in productivity may be more achievable than in many other
sectors.
There are a number of factors which contribute to the low rate of productivity.
The cyclical nature of the sector reduces the average tenure of workers, and this limits the benefits
of experience and can also increase training requirements. The industry’s volatility also introduces
uncertainty for businesses, which makes future planning difficult, and discourages investment in
additional resources and capabilities.
In New Zealand, the construction sector has a predominance of small firms. A lack of
specialisation can limit productivity, while these firms also often lack the scale and balance sheet to
be able to invest to grow and to manage their business through sector downturns and uncertain
futures.
The level of skills in the workforce hinders productivity growth as too few students are entering
higher education courses and entering jobs in the construction sector.
In addition to the proliferation of small players within the industry, the ways in which it operates
can hinder productivity. For example, sub-optimal approaches to contracting, insufficient use of
project management practices, and lack of innovation and collaboration all have negative impacts
on performance.
The nature of contracting and procurement processes constrain innovation as traditional
construction practices are rolled forward and do not provide flexibility or incentivise innovation.
Fragmentation of contracts, separating design and build components, do not incentivise innovation
to produce better consumer outcomes and better ‘value’ for the project and consumers.
The trend to push risk onto suppliers using bespoke contracts increases the time and cost to
negotiate and agree contracts, increasing overall cost-to-build, as suppliers incorporate risk into
their pricing.
Consumer choices can also impact productivity. The use of bespoke designs limits the extent to
which the industry can gain efficiencies through mass-customisation. Customers drive pressure for
low up-front costs and the best price, often without regard for future costs, particularly in the
residential sector.
A drive for low-cost procurement can also result in reduced allowances for design and project
management tasks, and this can cause cost increases at later stages.
Report to the Construction Strategy Group
PwC Page vii The relatively small scale of developments, particularly in the residential space, limits the extent to
which scale efficiencies can be made. A lack of large-scale residential development opportunities
appears to be limiting the speed at which additional housing can be constructed in Auckland.
There also appear to be a number of regulatory elements which are adversely impacting industry
productivity. Regulation such as the joint and several liability rule, the new retentions regime and
health and safety legislation, noting that regulation is developed in response to managing risk and
adverse outcomes, all impose costs on the industry, and can create sub-optimal outcomes through
the allocation of risk and accountabilities. In addition, consenting frameworks can add significant
cost, delays and losses in productivity.
While still low, industry productivity has improved in recent years. Since 2012, construction labour
productivity has increased by 1%. This slight improvement is due to a proportional expansion in GDP and
employment in the construction sector. Further inspection shows that measured labour productivity in core
construction has remained flat since 2012, while there was a 6% gain in construction-related services
labour productivity.
Figure 4 Labour productivity has remained steady in core construction but increased in
construction related services over the boom
Source: PwC Regional Industry Database
Improvements to performance are needed to meet the demand challenge
Improved performance and productivity are considered necessary to meet the challenge of an elevated
pipeline of work over the next six years. The 2016 National Construction Pipeline Report forecasts a longer
and later construction peak than in previous pipeline reports. The real value of construction work is
expected to peak in 2017 at $37.2 billion, and over 2014, 2015 and the six year forecast period the value of
construction work in New Zealand is expected to total over $270 billion.
The strong demand forecast is underpinned by residential demand in Auckland. In 2017, 53% of forecast
national construction growth comes from residential building in Auckland, which is a result of meeting the
current housing shortfall and new demand.
The recently released decisions version of the Proposed Auckland Unitary Plan (which is still subject to a
legal challenge process before it becomes operational) sets out the development potential for 422,000 more
homes in Auckland over the next 30 years. It is up to the construction sector to meet market demand for
housing in Auckland within the bounds of the planning controls. This will not be possible without changing
the approach for construction. Out of the 422,000 new dwelling development potential, approximately 64%
Report to the Construction Strategy Group
PwC Page viii(or 270,000 dwellings) will be accommodated within existing urban areas, through more intensive development. Existing practices will not meet the demand challenge in Auckland. The approach to construction has not fundamentally changed over the last 40 years, but the nature of the demand has changed. New innovative approaches will be required to meet the demand challenge of more intensive housing and to be successful in its delivery. Without this, there is a real risk that the industry cannot capitalise on the underlying demand and consumers choose to forgo new building projects. There are a number of options for improving the productivity and performance of the sector There are a number of areas in which government, industry and consumers could make changes that would improve the productivity and performance of the industry. The current boom provides an opportune time to look beyond the current cycle and improve the performance of the sector over the long-term. Supporting the sector means that any gains in underlying productivity are not lost when the sector encounters a bust. Over the long-term, gains in productivity and multiplier effects would compound to produce even larger benefits for New Zealand. The government sets the regulatory regime within which the construction sector operates. As such, it has the ability to constrain or support growth in the sector with the extent and quality of the regulation it imposes. There is a role for regulation in the construction sector to manage risk. For example, health and safety regulation is imposed to ensure that construction workers can perform their tasks while the risk of adverse outcomes is managed. However, it is the role of government to ensure that the regulatory regime is fit for purpose, that the broader costs and flow-on effects of imposing regulation are well understood and are balanced with the broader benefits of regulation. As an example, the Construction Contracts Act is likely to impose significant flow-on costs to the end consumer. The new requirements mean that risk profile and cost of borrowing are likely to increase for firms, which are all costs that are passed to the end consumer and could jeopardise the operations of many small businesses. The government must ensure that the costs and unintended outcomes are balanced with the benefits and intended outcomes of any regulation. More broadly, initiatives that government could take include encouraging labour supply through immigration and training programmes (even more so than what is currently occurring), and considering improvements to regulatory regimes that negatively impact on construction sector performance. This should include reviewing the costs and benefits of regulations regarding liabilities, health and safety, along with consideration of options to streamline consenting processes and rationalise the number of Building Consent Authorities (BCAs). The government is also a major source of construction demand, particularly in the downturn of the cycle. There is an opportunity for the government to streamline the procurement process and time its investments to support the on-going success of the industry. This is essentially neutral from a cost perspective – only the timing of the investment shifts. There has been an increasing trend for government to use non-standard contracts. The process is costly for the industry through additional time and (legal) cost to negotiate the variations, which becomes a divisive and adversarial process. A common theme from industry stakeholders was that the government should make adoption of MBIE’s procurement guidelines mandatory in central and local government procurement, unless there is a justification for not doing so. We also suggest that the government could consider increasing the use of standard contracts, and increased adoption of MBIE’s procurement guidelines, to reduce the additional time and cost involved in negotiating contracts for the government and industry. More broadly the government has tried to limit its risk by using traditional procurement methods, such as design-bid-build, which separates the different parts of the construction value chain. This often incentivises ‘value engineering’ and hinders innovation across the construction value chain. Flexibility in government procurement approaches, particularly more integration between design and build, would provide flexibility for firms to undertake innovation in their approach and produce better project outcomes. In addition, the government could encourage economies of scale in residential development through aggregation of separate Housing New Zealand Corporation contracts. Report to the Construction Strategy Group PwC Page ix
Finally, the government could play a role in promoting counter-cyclical investment and use timing to
support the industry when private sector demand is low. This does not mean creating new projects, but
rather bringing forward already planned work to stimulate demand in the sector. A sink fund would be
required to ensure that government could bring forward projects ‘on-demand’.

The construction industry could help grow its productivity through additional investment in skills, training,
innovation, promoting better contracting practices and exploring options for improved quality assurance
processes. There may also be opportunities to incentivise training and skills development for existing
workers in the industry, as well as incentivising more high skill workers, with cross-functional skills, into
the industry to address the existing and future labour shortages. There is a marketing challenge to this – to
overcome perceptions that the industry culture is ‘blokey and labouring’. Adopting innovative approaches
to construction, such as investment in mechanisation and off-site construction could assist with the
industry meeting the demand challenge and improved communications of project successes will assist with
changing public perceptions.

Clients and consumers can contribute to better performance of the industry through encouraging improved
project management practices, considering whole-of-life-costs for construction projects and having greater
acceptance of more standardisation and mass-customisation in construction.

Report to the Construction Strategy Group
PwC                                                                                                   Page x
Recommendations
There are a number of areas in which government, industry and consumers could make changes that would
improve the productivity and performance of the industry. These are discussed throughout the body of this
report and are summarised here, with a reference to the corresponding report section.
Recommendations for government
Consider changes to policy settings to increase labour supply during industry shortages. (Section 5
on labour availability)
Consider working with other governments eg Australia to fill labour shortages where demand is
counter-cyclical and labour is mobile. (Section 5 on labour availability)
Work with tertiary providers to improve alignment between the training cycle and labour demand.
Assist with overseeing better standardisation of qualifications for polytechnics and training
organisations (Section 5 on labour availability)
Encourage public sector agencies to use standard contracts to limit the time and cost for all parties
involved. (Section 5 on government contracting)
Procure for large scale projects to encourage the industry to gear up to deliver at scale and to
attract international players (driving improvements in efficiency and effectiveness). The Capital
Infrastructure Plan may be an opportunity for this. (Section 5 on government contracting)
Consider changes to traditional procurement approaches such that design and build functions are
separated, helping to reduce fragmentation in the industry and improving project management and
incentivising innovation across the construction value chain (Section 5 on government contracting
and consumer choices)
Plan the timing of government investment to help smooth the construction industry’s boom-bust
cycle, helping provide stability for construction labour and stabilise prices for consumers. (Section
5 on government contracting)
Undertake better assessment of regulation before imposing it, to ensure that the intervention is
proportionate to the risk being managed and the benefits of the intervention outweigh the costs.
(Section 5 on regulation)
Undertake better ex-post evaluation of the effectiveness of regulation and make changes where it is
found to be ineffective. (Section 5 on regulation)
Consider an alternative or amended regime for retentions which provides the required protections
while lowering the financial burden on the sector (PwC’s ‘hybrid model’ included in our submission
on the Construction Contracts Amendment Act 2015 is an illustrative example). (Section 5 on
retentions)
Consider alternatives to the joint and several liability rule which better reflects the share of the risk
that each party is responsible for. (Section 5 on joint and several liability rule)
Building on changes implemented through the Health and Safety at Work Act 2015, consider how
to improve transparency around compliance, reduce compliance costs and ensure fees and other
ramifications are proportionate to the level of risk and probability of adverse outcomes. (Section 5
on health and safety)
Consider amendments to the building consent process which provide industry with more certainty
regarding timeframes, minimising flow on impacts to the build time. (Section 5 on consents)
In conjunction with local government, consider options to reduce the number of BCAs to ensure
more consistent, and higher quality, application of the building code. (Section 5 on consents)
Report to the Construction Strategy Group
PwC Page xiRecommendations for the construction industry
Support continuous training to ensure that the skills of workers within the industry support the on-
going success of the industry. In particular, explore options for up-skilling the construction
workforce’s project management skills. (Section 5 on labour skills and project management)
Consider options for facilitating industry-wide innovation (a recent example being the introduction
of BIM processes). (Section 5 on technology and innovation)
More widespread use and uptake of mechanisation and off-site construction. (Section 5 on
technology and innovation)
Consider greater use of integrated contracting approaches to promote greater collaboration
between design and build functions. (Section 5 on contracting approaches)
Consider the use of more partnerships and alliances to improve scale (Section 5 on industry scale)
Consider how to facilitate a shift back towards best practice contracting and risk allocation, where
the party who is most able to control the risk bears the consequences of risk materialisation.
(Section 5 on contracting approaches)
Explore options for improving quality assurance processes, for example through a use of quality
assurance documentation or peer-review processes. (Section 5 on project management)
Recommendations for consumers
Demand sound project management by contractors working on construction projects. (Section 5 on
project management)
Consider whole of life costs (including impact on operating costs and eventual outcomes generated)
when commissioning construction projects. (Section 5 on drive for low cost construction)
Increase acceptance of mass customisation and standardisation in construction, helping to drive
down costs and improve productivity. Better understand the impact that bespoke designs have on
cost. (Section 5 on preference for bespoke builds)
Report to the Construction Strategy Group
PwC Page xii1. Introduction
This report provides an update to our 2011 report entitled “Valuing the role of Construction in the New
Zealand economy”. This report was commissioned by CSG, in association with CIC and BRANZ, in order to
demonstrate to government and other stakeholders the value and significance of the sector, and ensure the
profile of the construction industry is up to date.
Our previous report highlighted the value of the construction sector, and the key role it plays in the New
Zealand economy. However, it identified that the boom-bust nature of the sector was clearly a problem,
and was a barrier to improving its productivity and overall performance. We stated that Government’s key
focus needs to be in developing forward certainty for the sector, allowing it to maintain and develop skills,
and boost labour productivity. We set out a number of options which Government could consider which
could enable a more consistent and predictable environment for the sector.
This report looks at the state of the construction sector five years on. The previous report was written at the
bottom of the cycle, whereas today the sector is operating in a boom. However, while the state of the
industry has changed significantly, the underlying structural issues which were identified in our previous
report largely remain today, and the impact of the business cycle on the sector is just as strong.
The purpose of this report is to update the information on the value of the sector, and also to reconsider the
issues identified in 2011 through a combination of data, literature and interview-based research. We then
reconsider opportunities for improving the performance of the sector.
In this report we:
set out the scale and value of the construction sector today, considering the sector’s share of GDP
and employment, along with consideration of regional differences and the demographics of the
industry
consider the construction sector’s inter-industry relationships across the economy and the wider
economic benefits that it brings
assess the performance of the construction sector, reviewing recent growth trends and providing a
future outlook
consider structural constraints to improving the performance of the construction sector, looking at
the sector’s use of labour and capital, operational approaches and the impacts of consumer choices
and regulation, and consider opportunities for addressing them
discuss a number of common misconceptions of the construction sector.
We have applied both qualitative and quantitative approaches in order to provide a holistic view on the
construction industry in New Zealand. We have undertaken analysis of data from Statistics New Zealand,
along with other internal and external sources. This analysis has been combined with information sourced
from previous reports on the construction industry along with insights gained through interviews with
industry personnel. The time and assistance of our interviewees, who provided valuable input to this study
is acknowledged. Members of the CSG Board, BRANZ, CIC, as well as other non-CSG/CIC interviewees are
gratefully acknowledged.
In addition, we acknowledge the contribution of Gareth Stiven and David Norman, co-authors of the
previous report, who provided helpful advice during the development of this report.
Report to the Construction Strategy Group
PwC Page 12. The scale and value of the
Construction sector
The picture and outlook for construction in New Zealand has changed significantly since our previous
report was prepared. In the midst of a trough in the construction boom-bust cycle, our previous report was
prepared at a time when the sector was weak. Fast-forward five years and the situation has changed
dramatically as the sector grapples with increased demand from the Christchurch rebuild, earthquake
strengthening, leaky building remedial work, strong residential demand in Auckland, increased business
confidence and a forward infrastructure plan worth $54.9 billion over the next 10 years.4 The cyclical
nature of the industry has not changed – but it appears that underlying demand for construction will
remain strong for a number of years.
This section outlines the scale and economic value of the construction sector in the New Zealand economy
and how this has changed over the last five years. The sector is a major contributor of employment in
New Zealand, employing 178,100 full-time equivalent workers (FTEs) directly in construction, and a
further 53,600 in construction-related services in 2015.
Construction is made up of a core construction industry (consisting of division E of the ANZSIC06
classification5) and construction-related services (consisting of industries F333 – Timber and Hardware
Goods Wholesaling and M692 – Architectural, Engineering and Technical Services). Our definition is
unchanged from our previous report, which enables comparison to the previous analysis and long-run
trends over time to be identified where the data permits this.6 In our analysis, we have separated
construction and construction-related services where the data from Statistics New Zealand permits this. If
construction-related services cannot be isolated from the broader industry in which they sit (F333 sits in
Wholesaling and M692 sits in Professional, scientific and technical services), our analysis in that section
only pertains to core construction. References to the “Construction sector” relates to the aggregate of core
construction and construction-related services. This is illustrated in Figure 5, and further definitional work
of the sector can be found in Appendix A.
Figure 5 Definition of the Construction sector
Construction
Core
related Construction
construction
services sector
ANZSIC06 -
E301-E329 ANZSIC06 - F333
and M692
4 Capital investment intentions for central government and local government 2017 – 2026 for all capex available at
http://www.infrastructure.govt.nz/plan/evidencebase
5 Australia and New Zealand Standard Industrial Classification 2006, a shared classification of industries used by
New Zealand and Australia.
6 Note that there was a change in calculation method for the Regional Industry Database which means that there was
a series break between the 2011 report and the update report, which impacts on the availability of a long-run time
series for employment and productivity.
Report to the Construction Strategy Group
PwC Page 2Note that our previous report, published in 2011, contained data for the 2010 year. As such, the analysis in
this report relates to changes in the construction sector over the five year period between 2010 and 2015
unless otherwise specified.
Employment, GDP and business units
The Construction sector is a major contributor to New Zealand’s
economy
Figure 6 The Construction sector’s share of New Zealand employment, businesses and GDP
in 2015
Source: PwC Regional Industry Database
Employment
As Figure 6 shows, the Construction sector is a major contributor to New Zealand’s economy, contributing
strongly to employment, businesses and GDP.
Employment in core construction was estimated at 178,100 FTEs in 2015, with construction-related
services estimated to have 53,600 FTEs in 2015. Together, employment in the construction sector was
231,700 FTEs which accounted for 10% of total employment in New Zealand in 2015, up from 8% in 2010.
The gain was equivalent to 32,100 new FTEs over the five year period since our previous report (as shown
in Figure 7). FTEs have grown at an annual average of 3% over the last five years.
Figure 7 Employment in construction since 20107
Source: PwC Regional Industry Database
7 Note there is a series break in the data between 2010 and 2011 due to a change in methodology to improve our
employment and GDP estimates.
Report to the Construction Strategy Group
PwC Page 3The gain in the number of businesses between 2010 and 2015 in core construction was more modest. Approximately 54,500 core construction businesses were operating in 2015, up 2,700 from 2010. Core construction businesses made up 10% of the total number of businesses in New Zealand, a similar percentage to 2010. This implies that firms are taking on more staff rather than new firm start ups, which has been observed in previous booms. Our previous report noted that construction has a high proportion of small businesses, much like the New Zealand economy as a whole, a statement which has not fundamentally changed since 2010. Figure 8 below shows the breakdown of core construction workers into employees and self-employed workers. The construction sector is characterised by a small number of large businesses and large number of small businesses (including self-employed workers and sole-traders). In building construction and construction services, the proportion of self-employed workers is much higher than the New Zealand average. In addition, approximately 90% of businesses in construction had between 0 and 5 employees in 2015. Greater than 94% of businesses in construction had fewer than 10 employees in 2015. Figure 8 The construction sector is dominated by self-employed workers Source: As cited in MBIE (2013) New Zealand Sectors Report, Featured Sector: Construction Output / GDP The Construction sector contributes strongly to New Zealand’s GDP. In 2015, core construction contributed $13.9 billion to New Zealand’s economy and construction-related services contributed a further $5.0 billion. Together, the Construction sector contributed $18.9 billion to New Zealand’s GDP, equivalent to 8% of New Zealand’s economy in 2015. Seen from another perspective, the Construction sector’s contribution to New Zealand’s GDP in 2015 was just shy of the entire Waikato region’s share of New Zealand’s GDP across all industries ($18.9b compared to $19.6 billion in 2015). 8 Over the last three years core construction has seen 17% GDP growth, overtaking wholesale trade to become the 8th biggest contributing sector to GDP.9 Out of the top ten individual sectors by contribution to New Zealand’s GDP, construction supports the largest number of jobs. 8 Statistics New Zealand Regional GDP – year to March 2015 9 Using 1 digit ANZSIC industries. Report to the Construction Strategy Group PwC Page 4
Since 2010, the Construction sector has grown from 4% of New Zealand’s economy to 8%. This growth has
been underwritten by strong confidence in the sector. Firms in the building industry have generally been
optimistic about trading conditions since around 2011, as shown in Figure 9 and Figure 10. In particular,
Figure 9 shows that firms in the building industry (firms involved in building and construction, and
building materials) have been particularly positive about their situation and their short term outlook since
2012. Up until 2011, the outlook of firms in the building industry was on-par with overall firms in the
New Zealand economy. Figure 9 also shows that confidence in the building industry has been persistently
higher than economy-wide perceptions since 2011.
Figure 10 shows that most firms in the building industry expect that the amount of output they will produce
over the next quarter will increase compared to the same quarter of last year. The persistent optimism in
the sector is correlated with increased economic activity over the same 2011 to 2015 period.
Figure 9 Short term confidence indicators for the building industry have been positive for
several years
Source: NZIER QSBO
Figure 10 Expectations of increased output in the next quarter have been positive since 2011
Source: NZIER QSBO
Report to the Construction Strategy Group
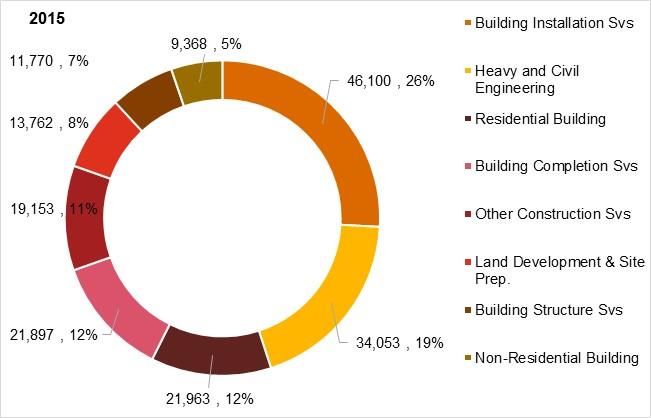
PwC Page 5Employment by construction subsector varies
The core construction sector has eight sub-components, with each subsector servicing a different part of the
construction value chain. Figure 11 provides a breakdown of employment by each of the eight core
construction sub-sectors. The top four sub-sectors, by employment, are:
building installation services (plumbing services, electrical services, air conditioning and heating
services, fire and security alarm installation services, other building installation services)
heavy and civil engineering construction
residential building construction
building completion services (plastering and ceiling services, carpentry services, tiling and
carpeting services, painting and decorating services, glazing services).
These make up 70% of total employment in the core construction sector. Much of this employment is
comprised of sole traders providing sub-contract services.
Figure 11 Building installation services and heavy and civil engineering are dominant
subsectors of core construction (Total New Zealand employment)
Source: PwC Regional Industry Database
In comparison to 2012, there was an increase in the number of people employed in all eight sub-sectors.
The largest gains were in the residential building construction and building and installation services sub-
sectors. These subsectors experienced employment growth of over 6,100 FTEs and 4,400 FTEs between
2012 and 2015 respectively. Figure 12 shows the breakdown of employment in core construction and job
growth by subsector since 2012. Building installation services, heavy and civil engineering and residential
building make up over 60% of employment in core construction.
Report to the Construction Strategy Group
PwC Page 6Figure 12 Breakdown of core construction and job growth by sub-sector Source: PwC analysis, Statistics New Zealand Regional picture of construction in New Zealand Construction activity is concentrated in New Zealand’s three main regions – Auckland, Canterbury and Wellington. Together, these three regions make up 60% of total employment in core construction in New Zealand. Figure 13 shows the regional breakdown of core construction employees and New Zealand’s population. The proportion of employment in construction in Canterbury is higher than the share of Canterbury’s population, a feature of the flow of construction labour to support the Canterbury rebuild effort. Conversely, Auckland’s share of national core construction employees is less than its population share. This reflects the diversity of employment opportunities in Auckland and local economies of scale in the construction sector, both features of Auckland’s size. However, it is likely that there is still a large shortfall in construction labour, which is needed to support Auckland’s residential and non-residential growth and the under-build since the Global Financial Crisis. Wellington is also under-represented in construction FTEs relative to its share of the population, but to a lesser extent than Auckland. Figure 13 Breakdown of FTEs in construction and population by New Zealand region 2015 Source: PwC Regional Industry Database, Statistics New Zealand Figure 14 sets out the employment concentration for regions in New Zealand – that is, the construction employment relative to total employment in the region. A value above one means that construction’s share of total regional employment is greater than the national average; ie that the region has a specialisation in construction. Canterbury is an outlier in terms of its specialisation, with construction being a much greater share of employment than in any other region. This is a feature of workers supporting the Canterbury rebuild. We expect this value would moderate as the Canterbury rebuild work winds down. Auckland has a value below one, but still relatively high compared to regions other than Canterbury. As stated above, Auckland has a substantial construction sector, but also strong employment across many sectors, and it benefits from economies of scale in terms of labour requirements. Report to the Construction Strategy Group PwC Page 7
Figure 14 Employment concentration index for construction shows that there is strength in
          Canterbury

Source: PwC Regional Industry Database

Since 2011 there has been an upswing in consenting activity across New Zealand. Figure 15 shows the value
of consents approved in Auckland, Wellington, Canterbury and the rest of New Zealand over the last 10
years. It includes the value of all construction work, including residential buildings, non-residential
buildings, and non-building construction (eg civil work, infrastructure and others). In the 2015 calendar
year, the value of construction work consented was over $16.8 billion, although we note that work does not
necessarily get constructed in the year it is consented, and not all consented work proceeds to construction.
However, on a like-for-like basis, the value of consented work in 2015 was 73% higher than that in 2011.
The Auckland and Canterbury regions have dominated the consents landscape since 2011-2012. The
construction work from the Canterbury rebuild, spanning residential building, non-residential building and
infrastructure building is a large driver of the construction activity in Canterbury. Meanwhile Auckland’s
construction is currently being driven by residential construction activity (see Figure 16).

Figure 15 Regional breakdown of all construction consents by value ($2015 real)10

Source: PwC analysis, Statistics New Zealand

10   Includes consents for new structures, and alterations and additions to existing structures.

Report to the Construction Strategy Group
PwC                                                                                                    Page 8
As shown in Table 1, construction activity in Wellington, and the rest of New Zealand, is not currently
experiencing the same level of growth observed in Auckland and Christchurch.
Table 1 Growth in building consents between 2011 and 2015
Inflation-adjusted change in the value
Region
in building consents, 2011-2015
Auckland 14%
Wellington 3%
Canterbury 33%
Rest of New Zealand 9%
Source: PwC analysis, Statistics New Zealand
Figure 16 illustrates the strong demand in residential construction in Auckland since 2011. This reflects a
period of under-investment in Auckland’s residential housing stock in the preceding five years. The under-
build of residential housing in Auckland is shown in Figure 17. Residential dwellings consented (again
noting that not all consented structures are built) has not kept pace with population growth in Auckland in
recent years. Strong demand for residential construction is expected to continue over the next five years, as
the industry accommodates pent-up demand and Auckland accommodates a population growing at an
average estimated rate of 63 persons per day over the next 30 years.11 The decisions version of the Proposed
Auckland Unitary Plan allows for an additional 422,000 dwellings in Auckland over the next 30 years, to
accommodate the expected growth in Auckland’s population.
Figure 16 Building consents approved in Auckland $2015 real values 12
Source: PwC analysis, Statistics New Zealand
11 Based on Statistics New Zealand medium subnational population projections for the 2013 to 2043 period for the
Auckland region.
12 Includes consents for new structures, and alterations and additions to existing structures.
Report to the Construction Strategy Group
PwC Page 9Figure 17 Consented residential developments have not kept pace with population growth in
Auckland
Source: PwC analysis, Statistics New Zealand
Non-residential building construction is the realisation of investment in the productive capacity of an
economy. Expansion in the capital stock broadly means that an economy enables firms to produce more
output, improving productivity. Auckland and Canterbury make up the lion’s share of primarily private
sector, non-residential building investment in New Zealand. Figure 18 shows the floor area of non-
residential buildings consented in Auckland between 2005 and 2015. In line with Auckland’s areas of
comparative advantage, the majority of the new consented floor area relates to new commercial buildings
(eg offices, shops, restaurants) and factories, industrial and storage buildings.
Figure 18 Floor area of non-residential buildings consented in Auckland
Source: PwC analysis, Statistics New Zealand
Figure 19 shows the floor area of non-residential buildings consented in Canterbury. The residential
component of the Canterbury rebuild is largely complete, so the attention is now turning to the non-
residential sector. The consented work will be a mixture relating to the Canterbury rebuild and supporting
broader economic growth. Similar to Auckland, the Canterbury landscape features commercial buildings
and factories, industrial and storage buildings. In addition, Canterbury has a significant proportion of farm
buildings in its mix of non-residential buildings. Supporting the agricultural sector in the region in 2015,
almost one-quarter (by floor area) of the Canterbury region’s new consented non-residential buildings were
farm buildings.
Report to the Construction Strategy Group
PwC Page 10You can also read