Phenological and elevational shifts of plants, animals and fungi under climate change in the European Alps
←
→
Page content transcription
If your browser does not render page correctly, please read the page content below
Biol. Rev. (2021), pp. 000–000.                                                                                                                 1
doi: 10.1111/brv.12727

Phenological and elevational shifts of plants,
animals and fungi under climate change in the
European Alps
Yann Vitasse1* , Sylvain Ursenbacher2,3 , Geoffrey Klein1,4, Thierry Bohnenstengel2,
Yannick Chittaro2, Anne Delestrade5,6, Christian Monnerat2 , Martine Rebetez1,4 ,
Christian Rixen7 , Nicolas Strebel8, Benedikt R. Schmidt2,9 , Sonja Wipf7,10 ,
Thomas Wohlgemuth1 , Nigel Gilles Yoccoz11 and Jonathan Lenoir12
1
 WSL Swiss Federal Institute for Forest, Snow and Landscape Research, Zürcherstrasse 111, CH-8903, Birmensdorf, Switzerland
2
 info fauna CSCF & karch, Avenue de Bellevaux 51, CH-2000, Neuchâtel, Switzerland
3
 Department of Environmental Sciences, Section of Conservation Biology, University of Basel, St. Johanns-Vorstadt 10, CH-4056, Basel,
Switzerland
4
 Institute of Geography, University of Neuchâtel, Espace Tilo-Frey 1, CH-2000, Neuchâtel, Switzerland
5
 Centre de Recherches sur les Ecosystèmes d’Altitude, 67 Lacets du Belvédère, 74400, Chamonix Mont-Blanc, France
6
 Laboratoire d’Ecologie Alpine (LECA), CNRS, Université Grenoble Alpes, Université Savoie Mont Blanc, Savoie Technolac, 73376, Le Bourget du
Lac Cedex, France
7
 WSL Institute for Snow and Avalanche Research SLF, Group Mountain Ecosystems, Flüelastrasse 11, CH-7260, Davos Dorf, Switzerland
8
 Schweizerische Vogelwarte, Seerose 1, CH-6204, Sempach, Switzerland
9
 Institut für Evolutionsbiologie und Umweltwissenschaften, Universität Zürich, Winterthurerstrasse 190, CH-6204, Zürich, Switzerland
10
   Swiss National Park, Chastè Planta-Wildenberg, Runatsch 124, 7530, Zernez, Switzerland
11
   Department of Arctic and Marine Biology, Faculty of Biosciences, Fisheries and Economics, UiT The Arctic University of Norway, PO Box 6050
Langnes, N-9037, Tromsø, Norway
12
   UMR CNRS 7058 « Ecologie et Dynamique des Systèmes Anthropisés » (EDYSAN), Université de Picardie Jules Verne, 1 Rue des Louvels,
80000, Amiens, France

      ABSTRACT

      Mountain areas are biodiversity hotspots and provide a multitude of ecosystem services of irreplaceable socio-economic
      value. In the European Alps, air temperature has increased at a rate of about 0.36 C decade−1 since 1970, leading to
      glacier retreat and significant snowpack reduction. Due to these rapid environmental changes, this mountainous region
      is undergoing marked changes in spring phenology and elevational distribution of animals, plants and fungi. Long-term
      monitoring in the European Alps offers an excellent natural laboratory to synthetize climate-related changes in spring
      phenology and elevational distribution for a large array of taxonomic groups. This review assesses the climatic changes
      that have occurred across the European Alps during recent decades, spring phenological changes and upslope shifts of
      plants, animals and fungi from evidence in published papers and previously unpublished data. Our review provides evi-
      dence that spring phenology has been shifting earlier during the past four decades and distribution ranges show an
      upwards trend for most of the taxonomic groups for which there are sufficient data. The first observed activity of reptiles
      and terrestrial insects (e.g. butterflies) in spring has shifted significantly earlier, at an average rate of −5.7 and −6.0 days
      decade−1, respectively. By contrast, the first observed spring activity of semi-aquatic insects (e.g. dragonflies and damsel-
      flies) and amphibians, as well as the singing activity or laying dates of resident birds, show smaller non-significant trends
      ranging from −1.0 to +1.3 days decade−1. Leaf-out and flowering of woody and herbaceous plants showed intermediate
      trends with mean values of −2.4 and −2.8 days decade−1, respectively. Regarding species distribution, plants, animals

* Address for correspondence (Tel: ++41 (0)44 739 2073; E-mail: yann.vitasse@wsl.ch)

                                                                         Biological Reviews (2021) 000–000 © 2021 Cambridge Philosophical Society.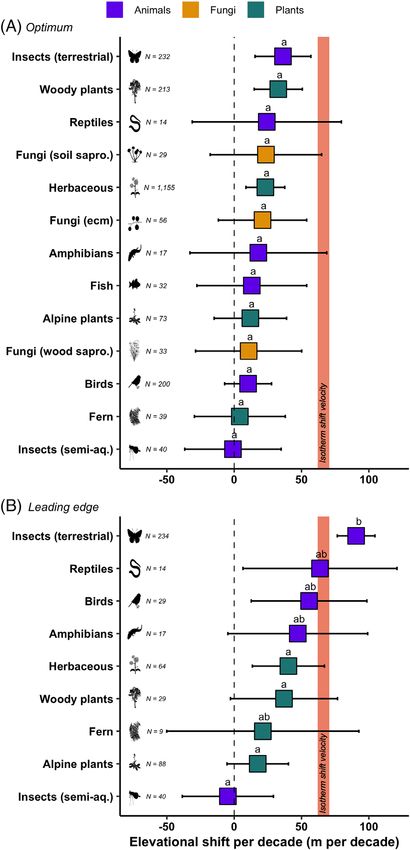
2                                                                                                                                                  Yann Vitasse et al.

       and fungi (N = 2133 species) shifted the elevation of maximum abundance (optimum elevation) upslope at a similar pace
       (on average between +18 and +25 m decade−1) but with substantial differences among taxa. For example, the optimum
       elevation shifted upward by +36.2 m decade−1 for terrestrial insects and +32.7 m decade−1 for woody plants, whereas it
       was estimated to range between −1.0 and +11 m decade−1 for semi-aquatic insects, ferns, birds and wood-decaying
       fungi. The upper range limit (leading edge) of most species also shifted upslope with a rate clearly higher for animals (from
       +47 to +91 m decade−1) than for plants (from +17 to +40 m decade−1), except for semi-aquatic insects (−4.7 m dec-
       ade−1). Although regional land-use changes could partly explain some trends, the consistent upward shift found in almost
       all taxa all over the Alps is likely reflecting the strong warming and the receding of snow cover that has taken place across
       the European Alps over recent decades. However, with the possible exception of terrestrial insects, the upward shift of
       organisms seems currently too slow to track the pace of isotherm shifts induced by climate warming, estimated at about
       +62 to +71 m decade−1 since 1970. In the light of these results, species interactions are likely to change over multiple
       trophic levels through phenological and spatial mismatches. This nascent research field deserves greater attention to
       allow us to anticipate structural and functional changes better at the ecosystem level.

       Key words: biodiversity redistribution, climate change velocity, disequilibrium dynamics, global warming, migration,
       mountain ecosystems, phenological mismatches, upslope shift

       CONTENTS

              I. Introduction . . . . . . . . . . . . . . . . . . . . . . . . . . . . . . . . . . . . . . . . . . . . . . . . . . . . . . . . . . . . . . . . . . . . . . . . . 2
             II. Methods . . . . . . . . . . . . . . . . . . . . . . . . . . . . . . . . . . . . . . . . . . . . . . . . . . . . . . . . . . . . . . . . . . . . . . . . . . . . 3
            III. Synthesis . . . . . . . . . . . . . . . . . . . . . . . . . . . . . . . . . . . . . . . . . . . . . . . . . . . . . . . . . . . . . . . . . . . . . . . . . . . . 7
                  (1) Climate change in the European Alps . . . . . . . . . . . . . . . . . . . . . . . . . . . . . . . . . . . . . . . . . . . . . . . . . 7
                      (a) Changes in air temperature, precipitation and snow cover . . . . . . . . . . . . . . . . . . . . . . . . . . . . . . . . . . . . . . 7
                            (i ) Temperature . . . . . . . . . . . . . . . . . . . . . . . . . . . . . . . . . . . . . . . . . . . . . . . . . . . . . . . . . . . . . . . 7
                           (ii ) Precipitation and snow . . . . . . . . . . . . . . . . . . . . . . . . . . . . . . . . . . . . . . . . . . . . . . . . . . . . . . . . 8
                      (b) Predicted climate change in the European Alps . . . . . . . . . . . . . . . . . . . . . . . . . . . . . . . . . . . . . . . . . . . . . 8
                  (2) Phenological shifts . . . . . . . . . . . . . . . . . . . . . . . . . . . . . . . . . . . . . . . . . . . . . . . . . . . . . . . . . . . . . . . . 9
                  (3) Elevational range shifts . . . . . . . . . . . . . . . . . . . . . . . . . . . . . . . . . . . . . . . . . . . . . . . . . . . . . . . . . . . 10
                      (a) Terrestrial plants and fungi . . . . . . . . . . . . . . . . . . . . . . . . . . . . . . . . . . . . . . . . . . . . . . . . . . . . . . . . 11
                      (b) Terrestrial animals . . . . . . . . . . . . . . . . . . . . . . . . . . . . . . . . . . . . . . . . . . . . . . . . . . . . . . . . . . . . . . 12
                      (c) Freshwater ecosystems . . . . . . . . . . . . . . . . . . . . . . . . . . . . . . . . . . . . . . . . . . . . . . . . . . . . . . . . . . . . 14
                  (4) Plant–animal interactions mediated by species-specific phenological and spatial shifts . . . . . . . . . . . 14
                  (5) Research gaps and ecosystem-based monitoring . . . . . . . . . . . . . . . . . . . . . . . . . . . . . . . . . . . . . . . . 15
           IV. Conclusions . . . . . . . . . . . . . . . . . . . . . . . . . . . . . . . . . . . . . . . . . . . . . . . . . . . . . . . . . . . . . . . . . . . . . . . . . 15
             V. Acknowledgements, author contributions and data availability . . . . . . . . . . . . . . . . . . . . . . . . . . . . . . . . . . 16
           VI. References . . . . . . . . . . . . . . . . . . . . . . . . . . . . . . . . . . . . . . . . . . . . . . . . . . . . . . . . . . . . . . . . . . . . . . . . . . 16
           VII. Supporting information . . . . . . . . . . . . . . . . . . . . . . . . . . . . . . . . . . . . . . . . . . . . . . . . . . . . . . . . . . . . . . . . 20

I. INTRODUCTION                                                                            genetically, or to track their climatic niche requirements
                                                                                           closely, ultimately leading to local extinctions (reviewed in
Biodiversity loss and redistribution as well as extreme cli-                               Jump & Penuelas, 2005; Aitken et al., 2008; Corlett &
matic events are probably the two most prominent environ-                                  Westcott, 2013; Cang, Wilson & Wiens, 2016; Jezkova &
mental challenges with strong socio-economic consequences                                  Wiens, 2016), particularly in terrestrial ecosystems as
that humans have to face in the 21st century. Biodiversity                                 opposed to marine ecosystems (Lenoir et al., 2020).
loss, mainly caused by human alteration of the landscape,                                     Ongoing global warming is changing the geographic dis-
has been occurring at an unprecedented rate since humans                                   tribution of organisms on Earth but their physiology and sea-
expanded across the globe (Butchart et al., 2010). The distri-                             sonal activities are also dramatically altered by climate
butions of many terrestrial organisms are currently shifting in                            change. In fact, phenological changes, such as flowering or
response to global warming and land-use changes in most                                    leaf senescence for plants, as well as mating, breeding, spawn-
parts of the world, poleward and upslope to cooler latitudes                               ing or hibernating for animals, are one of the most visible and
and elevations, respectively, thus generating spatially struc-                             sensitive responses to ongoing global warming in natural eco-
tured patterns in species redistribution (Chen et al., 2011;                               systems (Parmesan & Yohe, 2003; Cleland et al., 2007). For
Lenoir & Svenning, 2015; Lenoir et al., 2020). However,                                    instance, in Europe, leaf-out of temperate trees has advanced
the rate of ongoing global warming is such that numerous                                   by 8–15 days since the 1950s (Fu et al., 2019) and the migra-
plant and animal species may not be able to adapt                                          tion dates of birds have advanced by about a week since 1959

Biological Reviews (2021) 000–000 © 2021 Cambridge Philosophical Society.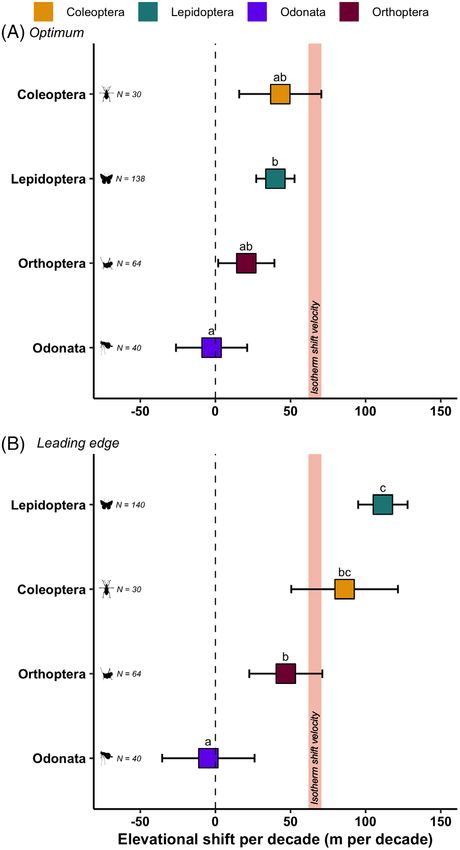
Phenological and elevational shifts in the Alps                                                                                            3

in Canada and northern Europe (Lehikoinen et al., 2019). In         affect their fitness and biotic interactions. Numerous studies
a temperate climate, spring phenology reflects how the phys-         have shown tight relationships between snow conditions
iology and behaviour of organisms interacts with the progres-       and population dynamics of alpine and arctic plants
sive return of favourable conditions for growth, i.e. mainly        (e.g. Inouye, 2000, 2008; Körner, 2003; Wipf &
the increase in air temperature and day length. Because ani-        Rixen, 2010; Berteaux et al., 2016) as well as population
mals are dependent on the development of plants, any                dynamics of animal species (e.g. Korslund & Steen, 2006;
change in plant phenology may elicit a cascade of conse-            Helle & Kojola, 2008; Robinson & Merrill, 2012). Hence,
quences in plant–animal interactions (Beard et al., 2019; Vis-      any changes in air temperature, precipitation and snow cover
ser & Gienapp, 2019; Kharouba & Wolkovich, 2020;                    patterns in high mountain areas are expected to elicit sub-
Rehnus, Pelaez & Bollmann, 2020). How the synchrony                stantial modifications in plant–animal interactions. In the
between animals and plant phenology will change under               European Alps, the pace of climate warming is occurring at
global warming is a challenging and timely question, but            a faster rate than the average warming in the northern hemi-
the consequences of such synchrony are still poorly under-          sphere (Rebetez & Reinhard, 2008), generating faster veloc-
stood at the population, community and ecosystem levels             ities of isotherm shifts. As a result, substantial shifts in spring
due to a lack of long-term ecosystem-based monitoring time          phenology as well as numerous elevational range shifts have
series (but see Kharouba et al., 2018; Visser &                     already been observed for plants, animals and even fungi
Gienapp, 2019; Pelaez et al., 2020).                               over recent decades (see studies in Tables 1 and 2). Long-
   The European Alps form an arc approximately 800 km in            term monitoring in the European Alps offers an excellent
length from east to west and around 200 km in width in west-        natural laboratory to synthetize climate-related changes in
ern Europe with numerous peaks rising over 4000 m. This             spring phenology and elevational distribution for a large
mountain system has been a prominent obstacle for plants            array of taxonomic groups.
and animals during the glacial and post-glacial periods of             Here, we aim at synthetizing the climatic changes that
the Pleistocene, thus being at the crossroads of several bio-       have occurred across the European Alps during recent
geographical units (Taberlet et al., 1998; Hewitt, 2000). The       decades and gathering the observed biotic responses in terms
European Alps are a hotspot of biodiversity offering myriad         of both spring phenological changes (the best documented
habitats and climates over very short distances                     season in terms of phenological observations) and species
(Körner, 2003; Zimmermann et al., 2013). About 13000 vas-           range shifts, reported for flora, fauna and fungi. We provide
cular plant species (>500 endemics) and about 30000 animal          a comprehensive synthesis of these changes and discuss the
species inhabit the European Alps (Agrawala, 2007). Plants,         consequences of such phenological and spatial shifts on spe-
animals and fungi living in this region include generalist spe-     cies interactions across different trophic levels. Moreover,
cies found across all of Europe but also numerous specialist        we point out knowledge gaps that require more investigation
species that have developed adaptations to harsh environ-           in order to be able to predict future structural and functional
ments at high elevations, and are found only in restricted          changes better at the ecosystem level under global warming.
areas such as mountain summits (i.e. sky islands). Angiosperm
plant species are found up to 4507 m (Saxifraga oppositifolia L.)
together with fungi and arthropods (Körner, 2011), while
bryophytes are found up to 4559 m (Vaccari, 1914). In the           II. METHODS
European Alps, as in all mountainous areas, the distance that
an organism has to move in order to cross isotherms is quite        We searched the scientific literature for publications report-
short compared to flatter regions, because of the sharp tem-         ing either species elevational range shifts or spring phenolog-
perature adiabatic gradient induced by elevational gradients        ical trends over recent decades. For phenological changes, we
(Rolland, 2003). This may, to a certain extent, help species to     focused on the spring season because this is better documen-
track isotherm shifts better in mountainous regions                 ted in terms of phenological observations compared to the
(Brito-Morales et al., 2018). However, species living close to      autumn season (Gallinat, Primack & Wagner, 2015), allow-
mountain summits will progressively be limited in habitat           ing for robust comparisons among taxa. We focused on any
availability because moving upward generally means less             important phenological event such as leaf emergence or flow-
land surface available, higher habitat fragmentation, and           ering of plants, peaks of detectability for birds or observations
an inevitable increase in competition among co-existing spe-        of the adult phase for amphibians and insects. For elevational
cies, eventually leading to local extinction events                 range shifts, we focused on studies reporting either shifts of
(Wiens, 2016; Giezendanner et al., 2019). The shift of species      the core distribution of a given species (hereafter ‘optimum’)
ranges in response to climate change is also increasingly ham-      or shifts of the upper elevational limit (hereafter ‘leading
pered by human activities such as tourism, urbanization or          edge’). We restricted our review to studies relying on regular
agriculture, all of which alter species’ habitat suitability and    monitoring data covering at least 10 years across parts of the
distribution by fragmenting natural habitats (Elsen, Mona-          European Alps (i.e. Austria, France, Germany, Italy, Lich-
han & Merenlender, 2020). A warmer climate associated               tenstein, Slovenia and Switzerland) within the period 1980–
with changes in rain regime and snow cover will alter the           2020. For diachronic studies comparing historical and mod-
physiology and phenology of many species, which in turn will        ern surveys, we used only studies that conducted their

                                                                    Biological Reviews (2021) 000–000 © 2021 Cambridge Philosophical Society.
4
Table 1. Documented spring phenological changes in animals and plants in the European Alps over the recent decades. Mean ± standard errors are reported where data are
available for more than one species. For information on the info fauna and PhenoForest databases, see Section II. The data set used for this table is provided as supporting online
information in Table S1
Temperature
Number of Trends
Taxa Study period Area Phenological variable sensitivity References
species (days decade−1)
(days C−1)
PLANTS
Woody plants 1970–2012 Alps and lowlands 14 Leaf-out or flowering −3.4 ± 0.3 −5.1 ± 0.4 Güsewell (2014)
in Switzerland
Herbaceous 1970–2012 Alps and lowlands 5 Flowering −2.8 ± 0.4 −5.6 ± 0.6 Güsewell (2014)
in Switzerland
Trees 1998–2020 Alps and lowlands 8 Leaf-out −2.2 ± 0.7 NA PhenoForest
in Switzerland
Woody plants 2005–2016 French Alps 6 Leaf-out −0.5 ± 2.3 NA Bison et al. (2019)
ANIMALS
Birds
Birds (res.) 1995–2019 Lowland areas 8 Singing activity +2.5 ± 3.6 −2.1 ± 0.8 Strebel et al. (2014)
in Switzerland
Biological Reviews (2021) 000–000 © 2021 Cambridge Philosophical Society.
Birds (sdm) 1995–2019 Lowland areas 12 Singing activity −3.5 ± 3.8 −1.0 ± 0.5 Strebel et al. (2014)
in Switzerland
Birds (ldm) 1995–2019 Lowland areas 14 Singing activity −1.7 ± 1.5 −1.0 ± 0.5 Strebel et al. (2014)
in Switzerland
Passer italiae (res.) 1982–2006 Northern Italy 1 Laying dates −1.9 −1.7 Rubolini et al. (2007)
Sturnus vulgaris (sdm) 1982–2006 Northern Italy 1 Laying dates −0.1 −0.2 Rubolini et al. (2007)
Birds (ldm) 1982–2006 Northern Italy 6 Arrival or laying dates −1.8 ± 0.8 −1.0 ± 0.6 Rubolini et al. (2007)
Ficedula hypoleuca (ldm) 1960–1995 South Germany 1 Arrival dates −0.7 0.06 Hölzinger (1997)
Lagopus muta (res.) 2000–2009 Northern French Alps 1 Median hatching date −4.9 −4.2 Novoa et al. (2016)
Insects
Ips typographus 1996–2005 Southeastern Alps 1 First observation −21 NA Faccoli (2009)
Lepidoptera, butterflies 1998–2010 Swiss lowlands 28 First observation NA −4.9 ± 2.0 Altermatt (2012)
Apatura iris 1982–2002 Forest near Basel, 1 First observation −10.5 −6.4 Dell et al. (2005)
Switzerland
Lepidoptera, butterflies 1991–2019 Switzerland 138 First observation −6.6 ± 0.5 NA info fauna
Odonata 1991–2019 Switzerland 40 First observation −1.0 ± 0.5 NA info fauna
Orthoptera 1991–2019 Switzerland 64 First observation −4.3 ± 0.8 NA info fauna
Amphibians
Anura 1991–2019 Switzerland 10 First observation −1.0 ± 2.2 NA info fauna
Urodela 1991–2019 Switzerland 5 First observation +2.5 ± 3.0 NA info fauna
Reptiles
Squamata 1991–2019 Switzerland 14 First observation −5.7 ± 1.6 NA info fauna
ldm, long-distance migrants; sdm, short-distance migrants; res., resident.
Yann Vitasse et al.Phenological and elevational shifts in the Alps 5
modern survey(s) within the period 1980–2020 and where 2019. Although data collected before 1990 are available,
the median year of the historical survey(s) was after 1950 we restricted our analyses to after 1990 because far fewer
[often called the ‘great acceleration’ period (Steffen observers were active before 1990, which could influence
et al., 2015)] to avoid including decades with no or signifi- trend analyses. Species with taxonomic uncertainty, with a
cantly lower warming trends. Indeed, including studies using limited number of observations per year (variable depending
historical surveys prior to 1950 (e.g. Holzinger et al., 2008; on taxonomic group, left to the experts’ discretion), that are
Rumpf et al., 2018) would inevitably underestimate the rate migrants or show other features that could impact the fre-
at which biotic responses are taking place in response to quency of observations were also removed after careful
ongoing climate change for recent decades. examination by expert co-authors of this review. To avoid
We focused on the European Alps because this region is a distorting influence of extreme values when assessing eleva-
both a hotspot of biodiversity and benefits from a long tional range shifts from the raw data, we computed, for every
research history, allowing a long-term view and comprehen- year, the median (50%) and 95th percentile of the elevation
sive synthesis on climate change-related processes. We as surrogates for the optimum and leading edge, respectively,
extended the study area to lowland regions in direct contact because these were less likely to be distorted than the mean
with the mountain range of the European Alps or to neigh- and maximum elevation values. Similarly, for spring phenol-
bouring mountain ranges (the Jura), provided that part of ogy, we used the 5th percentile of the distribution in the
the European Alps was considered in the studied region observations for a given species for every year. Linear regres-
and assumed to play a significant role in the results sions were then conducted for all species of these parameters
(e.g. Kuhn et al., 2016). against years, and we report the slope values expressed per
Raw data for phenological shift (per decade or per degree decade. In total, for info fauna, 273 animal species were
of warming) and migration rate across elevations per unit included in our analyses, comprising 1558862 observations
time (per year or per decade) were extracted at the species (average: 5710 observations/species; median: 2807 observa-
level from the publications reviewed herein, either from tions/species; 5–95% quantile: 256–21301 observations/
direct access via the journal webpage (appendix or data species) for the altitude analysis and 1560265 observations
depository), or indirectly by requesting species-level (average: 5715 observations/species; median: 2823 observa-
data from the study authors. Depending on the study, differ- tions/species; 5–95% quantile: 196–20380 observations/
ent methods were used to generate species-level data on phe- species) for the phenology analysis. The info fauna database
nological shift or elevational range shift per decade. For gathers observations mainly from citizen volunteers and does
instance, some studies directly reported the observed rates not use a systematic sampling design, rather representing
in phenological shift or elevational range shift per decade haphazard sampling, which may introduce statistical issues
while others reported the magnitude of the observed changes (Callaghan et al., 2019). However, because we used only data
in phenology or elevational distribution over a given time from taxa with sufficient sample sizes and that were carefully
period. In the latter case we extracted information on the checked by experts before they were entered into our data-
duration of the time period covered by that study and com- base, we believe this data set should provide robust trends
puted the rates per decade. Phenological studies reporting of how these species are currently migrating along elevational
the phenological change per degree of warming generally gradients. Additionally, the data from info fauna do not show
include a pre-season temperature window in their calcula- identical trends among taxa; if a particular trend was due
tions, which is best correlated with the studied phenological to observer bias, we would expect to find similar patterns
event, i.e. a couple of weeks or months before the spring phe- across various taxa, which was not the case.
nological event. For more details, readers should refer to the The PhenoForest database consists of records of visual obser-
publications listed in Table 1. vations of the leaf-out timing of eight species during the
All publications used for our synthesis are summarised in period 1998–2020 from volunteers in different sites in Swit-
Tables 1 and 2, and the full data are provided as online sup- zerland (one observer per site, 16 permanent sites in total,
porting information in Tables S1 and S2, respectively. For 1–5 species per site). At each site, 8–10 trees per species were
more robust comparisons, taxonomic groups containing identified and monitored every year by the same observer.
observations of phenological or range shifts for less than five To estimate trends in the leaf-out dates over this study
species were discarded from our quantitative analyses, but period, we applied a linear mixed-effect model for each spe-
are still included in the tables for completeness. cies with leaf-out dates as the response variable, year as the
In addition, we analysed two sources of previously unpub- explanatory variable and sites as a random intercept term,
lished data collected through a citizen science program in and extracted the estimated slope for each species separately.
Switzerland: the info fauna database for both phenology and Following collection/calculation of all the species-level
altitudinal migration of insects, reptiles and amphibians biotic responses in days per decade for shifts in spring phenol-
and the PhenoForest database for phenological trends of sev- ogy or meters per decade for elevational range shifts as
eral tree species. described above, we compared the estimated rates among
From the Swiss central database of info fauna, we extracted taxonomic groups. We ran linear mixed-effects models with
all observations for amphibians, reptiles, lepidopterans, species’ phenological shift per decade or species’ elevational
orthopterans and odonates available between 1991 and range shift per decade as response variables, study/database
Biological Reviews (2021) 000–000 © 2021 Cambridge Philosophical Society.6
Table 2. Elevational range shifts reported for diverse taxa in the European Alps region. Values are means ± standard errors. In the ‘Limit’ column, ‘Optimum’ is the elevation
of maximum abundance and ‘Leading edge’ is the upper elevational limit of a given species. These two metrics are calculated in different ways depending on the studies (see
article references and Section II). For Dainese et al. (2017) only native species were included. For information on the info fauna database see Section II. The data set used for this
table is provided as supporting online information in Table S2
Taxa Study period Area N Mean shift (m decade−1) Limit References
PLANTS
Alpine species 1956–2004a Central Italian Alps 93 +18.1 ± 2.5 Leading edge Parolo & Rossi (2008)
Alpine species 1989–2009 Northeast Italy 80 +26.1 ± 10.0 Optimum Dainese et al. (2017)
Forest plant species 1977–2005a Western French Alps, 97 +38.1 ± 7.8 Leading edge Kuhn et al. (2016)
and other French mountains
Forest plant species 1977–2005a Western French Alps, 97 +25.7 ± 4.6 Optimum Kuhn et al. (2016)
and other French mountains
Forest plant species 1985–1999 Southeast France and Corsica 175 +13.8 ± 6.9 Optimum Bodin et al. (2013)
Non-alpine plant species 1989–2009 Northeast Italy 1128 +32.8 ± 3.2 Optimum Dainese et al. (2017)
BIRDS
Various species 1982–2017 Italian Alps 29 +31.5 ± 8.4 Optimum Bani et al. (2019)
Various species 1982–2017 Italian Alps 29 +55.6 ± 9.5 Leading edge Bani et al. (2019)
Various species 1993–2016 Switzerland 71 +12.0 ± 3.5 Optimum Knaus (2018)
Various species 1993–2004a Italian Alps (Piedmont) 54 +7.2 ± 9.4 Optimum Popy et al. (2010)
Forest species 1978–2002 French northern Alps 24 −7.8 ± 6.5 Optimum Archaux (2004)
Forest species 1973–2001 French southern Alps 17 −6.3 ± 6.3 Optimum Archaux (2004)
Biological Reviews (2021) 000–000 © 2021 Cambridge Philosophical Society.
Lagopus muta 1998–2011 Northern French Alps 1 −24.7 Optimum Novoa et al. (2016)
Lagopus muta helvetica 1984–2012 Swiss Alps 1 +37.8 Optimum Pernollet et al. (2015)
MAMMALS
Ungulate species 1991–2013 Swiss Alps 4 +37.5 ± 10.3 Optimum Büntgen et al. (2017)
INSECTS
Lepidoptera
Thaumetopoea pityocampa 1975–2004 Italian Alps 1 +49.8 Leading edge Battisti et al. (2005)
Various butterfly species 1991–2019 Switzerland 138 +39.9 ± 6.5 Optimum info fauna
Various butterfly species 1991–2019 Switzerland 138 +112.4 ± 6.3 Leading edge info fauna
Coleoptera
Dung beetle species 1992–2007 South western Alps 30 +40.5 ± 24.2 Optimum Menéndez et al. (2014)
Dung beetle species 1992–2007 South western Alps 30 +80.6 ± 39.8 Leading edge Menéndez et al. (2014)
Odonata
Various species 1991–2019 Switzerland 40 −2.6 ± 5.9 Optimum info fauna
Various species 1991–2019 Switzerland 40 −4.7 ± 9.1 Leading edge info fauna
Orthoptera
Various species 1991–2019 Switzerland 64 +20.6 ± 5.4 Optimum info fauna
Various species 1991–2019 Switzerland 64 +46.9 ± 6.9 Leading edge info fauna
AMPHIBIANS
Anura
Various species 1991–2019 Switzerland 10 +13.9 ± 4.8 Optimum info fauna
Various species 1991–2019 Switzerland 10 +42.8 ± 17.1 Leading edge info fauna
Urodela
Various species 1991–2019 Switzerland 7 +19.7 ± 18.7 Optimum info fauna
(Continues)
Yann Vitasse et al.Phenological and elevational shifts in the Alps 7
as a random intercept term and taxonomic group (with as
Comte & Grenouillet (2013)
many levels as taxonomic groups for which there were suffi-
cient data, i.e. groups containing at least five species) as the
main fixed effect. Based on the model estimates of phenolog-
Diez et al. (2020)
Diez et al. (2020)
Diez et al. (2020)
ical shift per decade or elevational range shift per decade for
each taxonomic group separately, we computed the associ-
References
ated 95% confidence intervals. Post-hoc Tukey tests were then
info fauna
info fauna
info fauna
applied to test for differences among the different taxonomic
groups. In the results, we report the mean shift of the phenol-
ogy or migration of a given taxonomic group across studies,
using the estimated marginal mean value ± 95% confidence
Leading edge
Leading edge
intervals from the mixed-effect model. We also report the
Optimum
Optimum
Optimum
Optimum
Optimum
mean ± standard errors of phenological and elevational
shifts per study/database and taxonomic group in Tables 1
Limit
and 2.
In order to visualize whether the rate of species migration
lags behind the pace of climate warming, we computed the
Mean shift (m decade−1)
likely isotherm shifts that have occurred in the Alps since
1970. We used the annual warming trends shown in Fig. 1
+53.5 ± 16.7
+22.6 ± 10.8
+63.7 ± 12.7
+13.1 ± 3.8
+21.0 ± 3.0
+23.6 ± 4.0
+10.7 ± 2.6
for six stations across the Swiss Alps of 0.36 C decade−1 (simi-
lar values are reported by the national offices of Meteorology
and Climatology, e.g. MeteoSwiss). To calculate the corre-
sponding theoretical altitudinal distance required to maintain
the same air temperature, we applied an altitudinal lapse rate
of 0.51–0.58 C 100 m−1, as typically evaluated for annual
mean temperature across different regions of the Alps [France,
Germany, Austria, Italy and Switzerland (Rolland, 2003;
Kirchner et al., 2013)]. The isotherm shift induced by climate
14
14
32
56
29
33
N
7
warming was estimated in this way to range between +62
and +71 m decade−1 during the period 1970–2019.
All calculations and statistics were conducted using R 3.5.1
(R Core Team, 2017).
Streams in France
European Alps
European Alps
European Alps
III. SYNTHESIS
Switzerland
Switzerland
Switzerland
N, number of species; ecm, ectomycorrhizal; sapro., saprophytic.
(1) Climate change in the European Alps
Area
(a) Changes in air temperature, precipitation and snow cover
(i) Temperature. Since the beginning of the 20th century,
Median years of the historical and modern survey.
mean annual air temperature has increased by more than
Study period
1986–2006a
1.5 C across the European Alps (Böhm et al., 2001; Begert,
1991–2019
1991–2019
1991–2019
1960–2010
1960–2010
1960–2010
Schlegel & Kirchhofer, 2005; Rebetez & Reinhard, 2008), with
this trend accelerating strongly during the second half of the 20th
century (Auer et al., 2007; Acquaotta, Fratianni &
Garzena, 2015) with an average increase of about 0.36 C dec-
ade−1 between 1970 and 2019 (Klein et al., 2016, Fig. 1). Air
temperature trends in the European Alps exceed the average
Litter/soil sapro. Species
trend observed over the northern hemisphere by 1.6–2.5 times
Wood sapro. Species
(Keiler, Knight & Harrison, 2010; Foster & Rahmstorf, 2011).
Various species
The increase in air temperatures during the 20th century was
Various species
Various species
Table 2. (Cont.)
Stream fishes
most pronounced around the altitude of the 0 C isotherm
Ecm species
REPTILES
(Serquet, Marty & Rebetez, 2013), in connection with the
FISHES
snow-albedo feedback of snow-covered surfaces and glaciers
FUNGI
Taxa
(Pepin & Lundquist, 2008; Scherrer et al., 2012). However, these
trends hide strong seasonal disparities. During the 20th century
a
Biological Reviews (2021) 000–000 © 2021 Cambridge Philosophical Society.8 Yann Vitasse et al.
was, on average, lower than today, so that the evapotranspi-
ration in summertime was lower (Schär et al., 2004) and con-
sequently the vegetation was much less impacted by these
events. Because air temperature decreases steadily with ele-
vation (and generally precipitation increases), the climatic
water balance of sites >1200 m still remains positive in the
central part of the European Alps (Vitasse et al., 2019). How-
ever, severe droughts are predicted to become more frequent
even at high elevations where organisms might be less
adapted to cope with water limitation (Rosbakh et al., 2017).
Snow cover has an important impact in plant and animal
phenology in mountain ecosystems. A significant reduction
in the number of days with snow precipitation has been
reported at all elevations during the 20th century in the Alps,
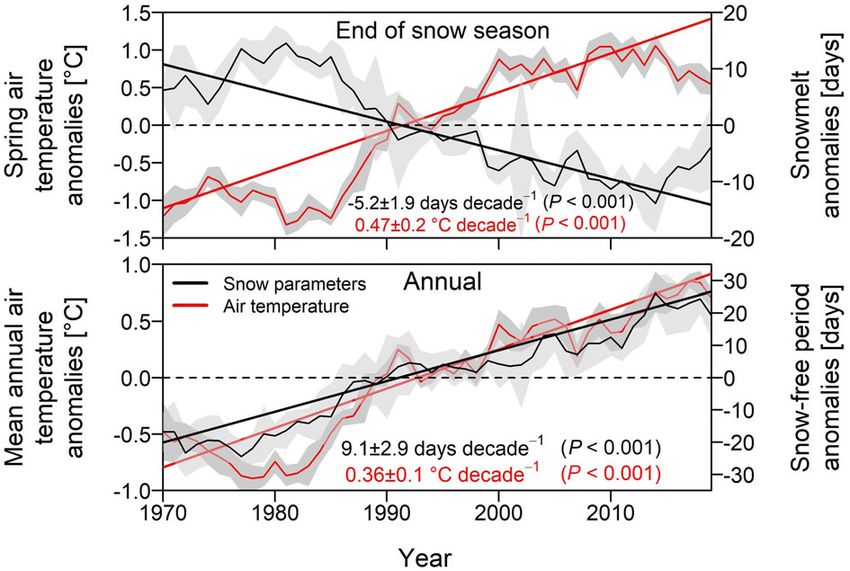
Fig 1. Long-term time series of snow parameters (snowmelt particularly since the 1980s and in relation to warmer air
timing and length of the snow-free period) and mean air temperatures (Laternser & Schneebeli, 2003; Pellicciotti,
temperature (spring temperature from March to May and annual Bauder & Parola, 2010; Valt & Cianfarra, 2010; Serquet
temperature) at six sites spread across the Swiss Alps during the et al., 2011; Diolaiuti et al., 2012; Marty & Blanchet, 2012;
period 1970–2019. Data updated from Klein et al. (2016) Serquet et al., 2013). A similar reduction has been observed
representing yearly average anomalies over the period 1970–
across the northern hemisphere since the 1970s
2019 across six sites in Switzerland located between 1298 and
2540 m (Arosa, Davos, Grächen, Grimsel Hospiz, Scuol and (Hernandez-Henríquez, Déry & Derksen, 2015), especially
Weissfluhjoch). Estimated trends from the Theil-Sen estimator in spring (Brown & Mote, 2009; Brown & Robinson, 2011),
method across the six sites are reported with the associated although this trend varies widely at a global scale (Bormann
standard errors (grey shading) for each snow and temperature et al., 2018; Pulliainen et al., 2020). Analyses of snow water
parameter. Significance of the slopes was tested using Mann- equivalent have shown a clear decrease in snow mass all over
Kendell tests, see Klein et al. (2016) for more details. the European Alps during the period 1973–2012, at all eleva-
tions and more pronounced in spring compared to winter
in Western Europe, air temperatures warmed more in winter (Marty, Tilg & Jonas, 2017b). Mean snow depth has also been
compared to summer (Moberg et al., 2006), but this ratio significantly reduced during the same period in the European
reversed by the end of the 20th and early 21st century (Klein Alps at all elevations and for all seasons (Durand et al., 2009;
et al., 2018). Hence, several studies have shown that summer Schöner, Auer & Böhm, 2009; Pellicciotti et al., 2010;
and spring have warmed more than autumn and winter since Marty & Blanchet, 2012; Marty & Meister, 2012). Detailed
the 1970s (Rebetez & Reinhard, 2008; Klein et al., 2018; Vitasse analyses in the Swiss Alps have confirmed a general decrease
et al., 2018a). Since the end of the 1980s, maximum air temper- in all snow parameters at all elevations, with a faster reduc-
atures have been increasing more than minimum temperatures tion of snow cover at the time of snowmelt compared to the
in connection with the decrease in European air pollution and time of snow onset (Klein et al., 2016). Spring (March to
particulate matter, especially in spring and at mid and high ele- May) was the season with the highest air temperature
vations (Rebetez & Reinhard, 2008; Vitasse et al., 2018a). increase over the last five decades, with a rate of 0.47 C dec-
ade−1 since 1970 in the Swiss Alps (Klein et al., 2018, Fig. 1).
(ii) Precipitation and snow. Annual precipitation has not This strong warming has led to earlier snowmelt, for example
changed across the European Alps over recent decades −5.2 days decade−1 across six locations in the Swiss Alps
(Diolaiuti et al., 2012). Regionally, only a few increasing sea- ranging from 1298 to 2540 m between 1970 and 2019
sonal trends have been observed since the beginning of the (Fig. 1). In autumn (September to November), the air tem-
20th century, mostly during autumn and winter perature warming rate has been less than in spring, although
(Schmidli & Frei, 2005; Scherrer et al., 2016). Winter precip- still sufficient to delay time of snow onset at an average rate of
itation sum has increased slightly, whereas trends towards +3.9 days decade−1 since 1970 for these six stations, leading
more intense but less frequent precipitation were observed to a significant increase in the snow-free period at an average
in summer with no change in overall precipitation sum rate of +9.1 days decade−1 in the Swiss Alps (Fig. 1). How-
(Moberg et al., 2006; Appenzeller et al., 2011; Fischer ever, regional differences across the European Alps exist with
et al., 2019). Recently, European alpine countries have expe- on average stronger trends of snow depth reduction in the
rienced several extreme drought events in summer, associ- southern Alps over recent decades (Matiu et al., 2021).
ated with heat waves, which have led to forest dieback,
vegetation damage and insect outbreaks in the lowlands, par-
(b) Predicted climate change in the European Alps
ticularly in 2003, 2012, 2015, 2016 and 2018 (Corona-
Lozada, Morin & Choler, 2019; Schuldt et al., 2020). Intense Air temperature will increase further in the coming decades if
hot drought events had also occurred during the 20th century present emission rates of greenhouse gases are not substan-
(e.g. in 1911, 1921, 1947, 1949, 1976) but air temperature tially reduced (IPCC, 2013). The difference between
Biological Reviews (2021) 000–000 © 2021 Cambridge Philosophical Society.Phenological and elevational shifts in the Alps 9
predictions based on lower [representative concentration
pathway (RCP) 2.6] or higher (RCP 8.5) greenhouse gas
emission rates (IPCC, 2013) increases with time, particularly
after 2050. Déqué et al. (2007) predicted that air temperature
in the European Alps would increase by 0.30 to 0.45 C dec-
ade−1 until 2100, with a higher expected increase in summer
and autumn and an increased frequency of summer heat-
waves (Keiler et al., 2010). Precipitations in summer are
expected to decrease over coming decades, although with a
higher frequency of extreme rainfall events (Rajczak &
Schär, 2017; Hodnebrog et al., 2019). Recent analyses never-
theless showed that regional climate models (RCM, from the
EURO-Coordinated Regional Downscaling Experiment)
could greatly underestimate the warming rate during the
growing season (Schwingshackl et al., 2019; Boé et al., 2020).
This was due to models omitting the plant physiological
CO2 response (Schwingshackl et al., 2019) and underestimat-
ing both the increase in shortwave radiation and changes in
solar radiation connected with cloud cover and aerosols
(Boé et al., 2020). For the same reasons, regional models also
tended to underestimate the decrease in summer precipita-
tion (Boé et al., 2020) as well as the increase in heavy rainfall
events (Borodina, Fischer & Knutti, 2017).
A strong reduction of snow depth and snow cover is
expected to continue at all elevations across the European
Alps during the 21st century (Jasper et al., 2004; Rousselot
et al., 2012; Schmucki et al., 2015; Marty et al., 2017a), partic-
ularly during the spring season (Magnusson et al., 2010; Ste-
ger et al., 2013). Permanent snow, glaciers and permafrost
are expected to decline strongly or disappear, with an overall
melt of the snow cover in summer (Magnusson et al., 2010). At
the end of the 21st century, continuous snow cover in winter
may only be present above 2000 m, while mid-elevations
(1000–1700 m) should experience random and/or discontin-
uous snow cover in about one in two winters (Schmucki
et al., 2017). These future expected changes in snow cover
duration and thickness correspond to an average upward ele- Fig 2. Spring phenological change per decade (A) or per degree
vation shift of 800 m of the snow cover by the end of the cen- (B) for different plant and animal groups studied in the
European Alps region. Values correspond to the estimated
tury, while snow cover seasons may be reduced by 2 or
marginal mean of the mixed-effect model with study as a
3 months, depending on the scenario (Bavay, Grünewald & random factor; error bars are 95% confidence intervals. The
Lehning, 2013; Marty et al., 2017a; Beniston et al., 2018). period of time varied among studies but was always more than
Due to these rapid changes in air temperature and snow- 10 years within the period 1980–2020. Only groups with more
pack, the European Alps will undergo marked changes in than five species are shown (all studies are reported in
the phenology and distribution of plants, animals and fungi, Table 1). ldm, long-distance migrants; sdm, short-distance
which are synthetized in the following sections. migrants; res., resident; semi-aq., semi-aquatic. Different
letters among groups indicate significant differences (post-hoc
Tukey tests at α = 0.05).
(2) Phenological shifts
Our review reveals an advance in spring phenological events yearly observation, with a significantly earlier
for most of the studied taxa, i.e. leaf-out and flowering for −5.7 ± 3.8 days decade−1 for reptiles (estimated marginal
plants, singing activity, laying dates, arrival and hatching mean ± CI; linear mixed-effects model) and
dates for birds, and the first yearly observation for insects, −6.0 ± 1.0 days decade−1 for terrestrial insects, whereas a
amphibians and reptiles although these were statistically sig- non-significant trend towards a slight delay was found for
nificant only for reptiles and insects. There were also signifi- the peak of singing activity, laying dates or hatching dates
cant differences among these taxonomic groups (Fig. 2A). of resident birds (+1.3 ± 4.5 days decade−1) and first yearly
Reptiles and terrestrial flying insects such as Lepidoptera observation of amphibians (+0.2 ± 3.6 days decade−1;
and Orthoptera showed the largest advance in their first Fig. 2A). Insects with aquatic life stages (Odonata) showed
Biological Reviews (2021) 000–000 © 2021 Cambridge Philosophical Society.10 Yann Vitasse et al. non-significant trends for an earlier first yearly observation of et al., 2008; Vitasse et al., 2013; Asse et al., 2018; Bison the adult stage (−1.0 ± 2.2 days decade−1, Fig. 2A). Plants et al., 2019). also showed non-significant trends for an advance in leaf- For animals, phenological changes are less documented out or flowering of −2.8 ± 6.3 and −2.4 ± 2.7 days decade−1 and overall less pronounced for large herbivores and birds for herbaceous and woody plants, respectively (Fig. 2A). A that can migrate over long distances to track food availability significant difference was found between semi-aquatic and and quality (i.e. tracking the ‘green wave’, e.g. Bischof et terrestrial insects (Table 1; Fig. 2A). Whereas resident birds al., 2012; Rehnus et al., 2020). In the lowland areas of the showed a tendency for a slight delay in their singing activity Swiss Alps (
Phenological and elevational shifts in the Alps                                                                                          11

                                                                    data. By contrast, ferns, birds and wood-decaying fungi
                                                                    showed small and non-significant changes in optimum eleva-
                                                                    tion, ranging between +4 and +11 m decade−1 (Fig. 3A).
                                                                       For the leading edge (upper elevational range limit),
                                                                    upward shifts were most pronounced for animals (on average
                                                                    +72.3 ± 17.8 m decade−1) than for plants (+28.2 ± 21.8 m
                                                                    decade−1; Fig. 3B), with the exception of semi-aquatic insect
                                                                    species that showed a non-significant trend for the leading
                                                                    edge to shift downward (−4.7 ± 33.8 m decade−1; Fig. 3B
                                                                    and Table 2). Remarkably, only terrestrial insects
                                                                    (+90.5 ± 14.0 m decade−1) and reptiles (+63.7 ± 57.2 m
                                                                    decade−1) showed an upward shift of their leading edge
                                                                    within the range or higher than the pace of climate warming
                                                                    (Fig. 3B), estimated at +62–71 m decade−1 based on a
                                                                    warming rate of 0.36 C decade−1 (Fig. 1) and a temperature
                                                                    lapse rate of +0.51–0.58 m 100 m−1 (Rolland, 2003; Kirch-
                                                                    ner et al., 2013).

                                                                    (a) Terrestrial plants and fungi
                                                                    For plants, our review suggests that there may be substantial
                                                                    differences among the studied taxonomic or functional
                                                                    groups, although these did not reach statistical significance,
                                                                    with insignificant shifts in the optimal elevation of
                                                                    +12.0 ± 26.9 and +4.2 ± 33.7 m decade −1 for ferns and
                                                                    alpine plants and significant upward shifts of +23.1 ± 14.4
                                                                    and +32.7 ± 17.9 m decade−1 for herbaceous and woody
                                                                    species growing below the treeline (Fig. 3A). Notably, this
                                                                    general pattern among the taxonomic groups is the same
                                                                    for changes at the leading edge (Fig. 3B). Lenoir et al. (2008)
                                                                    showed for different mountain areas throughout France,
                                                                    including the western Alps, that the optimum elevation of
                                                                    171 forest plants and trees moved upward in elevation at a
                                                                    mean rate of +29 m decade−1 when comparing vegetation
                                                                    surveys conducted between 1905 and 1985 to surveys con-
                                                                    ducted between 1986 and 2005. However, when splitting
                                                                    the data between short-lived herbaceous species
                                                                    (e.g. grasses and sedges) and long-lived woody species (trees
                                                                    and shrubs), Lenoir et al. (2008) found that only herbaceous
                                                                    plants from the forest understorey have significantly shifted
                                                                    their elevational optimum upslope (mean rate of +38 m dec-
                                                                    ade−1). Similarly, by revisiting historical relevés and species
Fig 3. Empirical evidence for elevational range shifts of (A) the   indicator values, Küchler et al. (2015) found an upward shift
optimum distribution (i.e. elevation of maximum abundance)          of forest plant species in the herbaceous layer of Swiss forests
and (B) the leading edge (i.e. the upper range limit) reported      at +10 m decade−1 since the 1950s, while the elevational
for groups of taxa in the European Alps region. Values
correspond to the estimate of the mixed-effect model with
                                                                    range of species from the shrub and tree layers remained
study as a random factor; error bars are 95% confidence              rather stable over the same time period. By contrast, our
intervals. The period of time investigated varied among studies     quantitative review across the European Alps suggests that
but was always more than 10 years within the period 1980–           the optimum range of long-lived woody plants is shifting
2020, or for diachronic studies comparing historical and            upward at a significant rate, at least at the same rate as
modern surveys, the modern survey was conducted within the          non-alpine herbaceous plants (Fig. 3A). This discrepancy
period 1980–2020, and the median year of the historical             may stem from the fact that we did not constrain our review
survey(s) was after 1950. Only groups with more than five            only to forest systems, unlike the above-mentioned studies
species are shown (all studies are reported in Table 2). ecm,       which specifically focused on range shifts of forest plants
ectomycorrhizal; sapro., saprophytic; semi-aq., semi-aquatic.       (Lenoir et al., 2008; Küchler et al., 2015). Thus, by including
Different letters among groups indicate significant differences
                                                                    data from studies on forest systems with those reporting
(post-hoc Tukey tests at α = 0.05).
                                                                    range shifts for woody plant encroachment beyond the

                                                                    Biological Reviews (2021) 000–000 © 2021 Cambridge Philosophical Society.
12 Yann Vitasse et al.
treeline or following land abandonment below the treeline, et al., 2019; Zellweger et al., 2020). In some studies, a consid-
we have a greater opportunity to detect elevational range erable part of the analysed herbaceous species may also shift
shifts for woody plants. By missing the upper part of the ele- downward (Lenoir et al., 2010; Bodin et al., 2013), potentially
vational gradient beyond the forest limit, studies restricted to explained by more intensive management (disturbance) at
forest systems may have underestimated the true rate at lower elevations compared to forests at higher elevations
which woody plant species are responding to temperature (Lenoir et al., 2010).
increases or abandonment of land in the Alps. The dynamics Interestingly, fungi may also be shifting their elevation.
of recruitment of forest tree species at the upper elevational Although data in the Alps originated from a single study, that
limits seems to be changing at a relatively fast rate, with seed- study assessed the shift in optimum elevation of 118 species
lings and saplings currently occurring well beyond the upper (Diez et al., 2020). They found values ranging between
elevational limit of adult trees (Vitasse et al., 2012). Similarly, +10.7 and +23.6 m decade−1 for wood-decaying and soil-
across several mountain areas in western Europe, including dwelling fungi with an intermediate value for ectomycorrhi-
the western Alps, Lenoir et al. (2009) reported differences in zal fungi (+21.0 m decade−1) (Table 2, Fig. 3A). A slower
elevational distribution between seedlings and adult life response of wood-decaying fungi would be consistent with
stages of trees, suggesting an ongoing upward shift for woody their dependence on wood resources and particularly dead
plants but with quite high heterogeneity among species wood, with the availability of woody plants likely delayed
which could be due to species-specific variability in demo- compared to the rate of climate change.
graphics and competitiveness (Scherrer et al., 2020).
The average rate at which alpine plant species shifted
(b) Terrestrial animals
upslope appears to be lower than for non-alpine plants or
woody species below the treeline for both the optimum range Except for birds, elevational range shifts of animal species in
and the upper elevational limits (Fig. 3), although note that the Alps have been less documented than for plants, with
these values did not differ statistically significantly. This direct evidence available only for some groups. Our review
slower rate at which alpine plants may be shifting upslope reveals that terrestrial insects have moved significantly
could be due to lower dispersal ability, biotic interactions or upslope in terms of both the optimum and the leading edge
possibly to the methods employed to assess such trends. For (Fig. 3). In an analysis of four orders of insects, a significant
alpine plants, resurveys are often compared with historical upslope movement is seen for each of the groups Lepidop-
surveys conducted before 1950, i.e. during a period with tera, Coleoptera and to a lesser extent Orthoptera in both
lower warming rates than at present, but these studies were measures of elevational range (Fig. 4). For semi-aquatic
not included in our analysis, making this unlikely to explain insects from the group Odonata, neither range measure has
the lower rate of upslope migration for alpine plants. While changed significantly (Fig. 4). Insects, like most ectotherms,
climate warming plays an undeniable role in the recent redis- are very sensitive to changes in air temperature and conse-
tribution of plants in mountain ecosystems (Steinbauer quently are likely to track climate warming closely. Accord-
et al., 2018), it might not be the only driver behind the ingly, numerous upward range shifts have been
upslope shifts along elevational gradients: precipitation documented for terrestrial insects, especially for pests which
(Rapacciuolo et al., 2014), land use (Gehrig-Fasel, Guisan & receive much more attention. For example, upward shifts in
Zimmermann, 2007; Guo, Lenoir & Bonebrake, 2018) or the elevational range of outbreaks of the European spruce
ongoing recolonization after the ‘Little Ice Age’ (Kammer, bark beetle (I. typographus) were related to the increased fre-
Schöb & Choler, 2007) might be additional drivers, either quency of drier summers in the Italian Alps (Marini
accelerating or slowing down the rate of elevational range et al., 2012). The pine processionary moth (Thaumetopoea pityo-
shifts. For example, the treeline ecotone has been influenced campa) shifted its distribution upward between 1975 and 2004
by farming activities for several thousand years in the Alps at average rates of +70 m decade−1 and +29 m decade−1 on
(Tinner & Theurillat, 2003), and a large part of this recent the southern and northern slopes of the Italian Alps, respec-
upward shift has been attributed to substantial changes in tively, with this shift related to the increase in minimum win-
land use, including: (i) land abandonment in the Swiss and ter air temperature (Battisti et al., 2005). As ectotherms,
Austrian Alps (Gehrig-Fasel et al., 2007; Gellrich insects do not regulate their body temperature, and thus cli-
et al., 2007; Tasser et al., 2007), which seems to explain the matic variation in temperature will have a direct effect on
large upward shift of Abies alba observed since the 1950s in their physiology. For example, warmer air temperatures in
the west central Alps (Chauchard et al., 2010), and (ii) a summer generally reduce European bark beetle develop-
reduction of cattle grazing, especially in the Italian Alps ment time (i.e. increased voltinism) (Jakoby, Lischke &
(Piotti et al., 2007). By excluding open habitats in their ana- Wermelinger, 2019), and therefore are likely to increase
lyses, Bodin et al. (2013) showed that the upward shift they ini- infestation pressure (Marini et al., 2012; Jakoby et al., 2019).
tially found for understorey forest plants became The reproductive cycle of insects is expected to be faster
insignificant, a result that may be related to forest microcli- under warmer air temperatures, potentially allowing an
mate dynamics potentially buffering the effects of warming extra generation per growing season at all elevations by the
for understorey plants compared with plant communities end of the century for European spruce bark beetle (Jakoby
from more open habitats (von Arx et al., 2013; De Frenne et al., 2019). Even though molluscs have a relatively low
Biological Reviews (2021) 000–000 © 2021 Cambridge Philosophical Society.Phenological and elevational shifts in the Alps 13
reached natural barriers (vertical rock walls with no soil), that
prevent further upward shifts.
The mean elevation of reptiles has also changed consider-
ably showing a non-significant shift in optimum elevation of
+24.2 ± 25.4 m decade−1 (Fig. 3A) and a significant shift in
their leading edge elevation of +63.7 ± 22.3 m decade−1;
Fig. 3B). Nevertheless, more investigation should be con-
ducted for this group as this result originates from a single
network of citizen observations in the Alps. An increase in
air temperature will allow reptiles to colonise higher eleva-
tions, although the extent to which this is possible may be lim-
ited by oxygen availability (Jacobsen, 2020).
Interestingly, we found no significant differences in the
upwards shift of optimum elevation between plants, fungi
and animals (Fig. 3A), whereas animals appear to be
responding fastest in terms of the leading edge, especially
for terrestrial insects (Fig. 3B). The distribution of mammals
and birds is mainly driven by habitat and food availability,
and a change in temperature may not affect their distribution
directly if features of their habitat remain stable or depend
more on the micro- than the macroclimate (Jähnig
et al., 2020) and on plant phenology (Pelaez et al., 2020).
For instance, two studies conducted on European roe deer
(Capreolus capreolus) identified a strong dependence on the
quality of food resources, with individuals performing long-
distance seasonal movements upward and downward to
locate food resources within their home range and thus track-
ing plant phenology (Gaudry et al., 2015; Pelaez et al., 2020).
Another study revealed an upward shift of about
+37.5 ± 10.3 m decade−1 of four mountain ungulate species
in the Swiss Alps based on hunting records, attributing this
upward shift to the lengthening of the snow-free period
(Büntgen et al., 2017, Table 2).
The effects of climate warming on animal distribution are
likely to be complex, and will include indirect effects. A good
example is the Alpine chough (Pyrrhocorax graculus) that nests
at high elevations in cavities and fissures on inaccessible rock
Fig 4. Mean elevational shift per decade for four different faces and forages in open alpine meadows (Delestrade &
orders of insects in terms of (A) the optimum elevation Stoyanov, 1995). Climate and land use are affecting the dis-
(i.e. elevation of maximum abundance) and (B) the leading- tribution of plants and forests but obviously not the distribu-
edge elevation (i.e. the upper range limit). Values correspond tion of the cliffs it uses for nesting. While upward shifts in
to the estimate of the mixed-effect model with study as a distribution of birds have been detected in some areas
random factor; error bars are 95% confidence intervals. The in the Alps such as the central Swiss Alps (Maggini
period of time investigated varied among studies but was et al., 2011; Knaus, 2018), several other studies documented
always higher than 10 years within the period 1980–2020. only marginal changes or no change in spite of significant
Different letters among groups indicate significant differences
(post-hoc Tukey tests at α = 0.05).
air temperature increases during the study period
(Archaux, 2004; Popy, Bordignon & Prodon, 2010). Consis-
tently, our results revealed rather low and insignificant rates
capacity to move over large distances, an upward shift of the of optimum elevational range shift for birds in general, on
land snail Arianta arbustorum of about 164 m has been reported average +10.3 ± 17.5 m decade−1, but Table 2 shows that
in a comparison of its distribution in 1916–1917 with its dis- there was much variation in the calculated values, with a
tribution in 2011–2012 in the eastern Alps, and this upward trend for higher values in the Eastern and Southern Alps.
shift was most pronounced (around 233 m) on south-facing This may be partly a result of human-induced land-use
slopes (Baur & Baur, 2013). Both habitat and microclimate changes (Knaus, 2018) as in these regions a strong upward
are important factors for these organisms and the authors shift of the treeline and reforestation of formerly cut or unfor-
stressed that, on some mountain slopes, snails have already ested areas has taken place, moving up the habitat of special-
ized alpine birds such as the rock ptarmigan (Lagopus muta)
Biological Reviews (2021) 000–000 © 2021 Cambridge Philosophical Society.You can also read