SIESTA Spatial Indicators for a 'Europe 2020 Strategy' Territorial Analysis - Annex E - ESPON
←
→
Page content transcription
If your browser does not render page correctly, please read the page content below

SIESTA
Spatial Indicators for a ‘Europe 2020
   Strategy’ Territorial Analysis

                   Applied Research 2013/1/18
               Scientific Report | Version 24/12/2012

                           Annex E

                        Digital Society

  ESPON 2013                                            1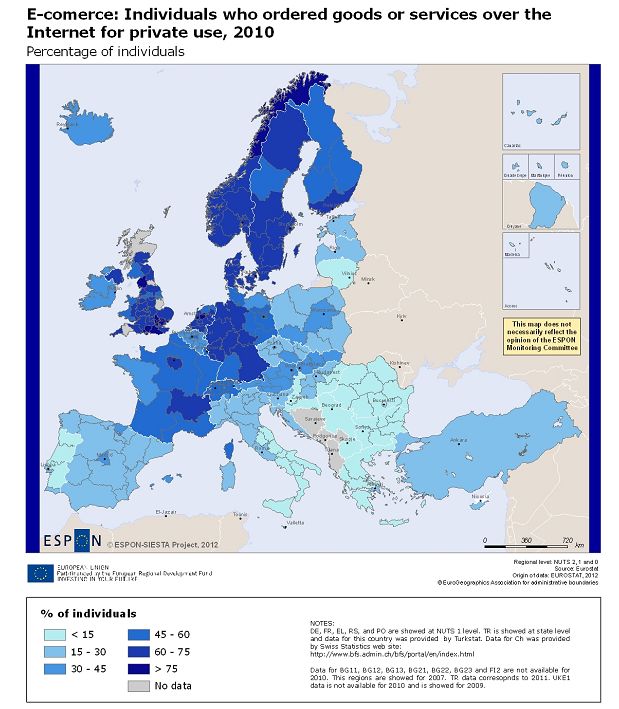
This report presents the final results of an

      Applied Research Project conducted within the

      framework of the ESPON 2013 Programme,

      partly financed by the European Regional

      Development Fund.

      The partnership behind the ESPON Programme

      consists of the EU Commission and the Member

      States of the EU27, plus Iceland, Liechtenstein,

      Norway and Switzerland. Each partner is

      represented      in    the   ESPON        Monitoring

      Committee.

      This report does not necessarily reflect the

      opinion of the members of the Monitoring

      Committee.

      Information on the ESPON Programme and

      projects can be found on www.espon.eu

      The    web    site    provides   the   possibility   to
      download      and     examine    the   most    recent

      documents produced by finalised and ongoing

      ESPON projects.

      This basic report exists only in an electronic

      version.

      © ESPON & Universidade de Santiago de

      Compostela, 2012.

      Printing, reproduction or quotation is authorised

      provided the source is acknowledged and a

      copy is forwarded to the ESPON Coordination

      Unit in Luxembourg.

ESPON 2013                                                      2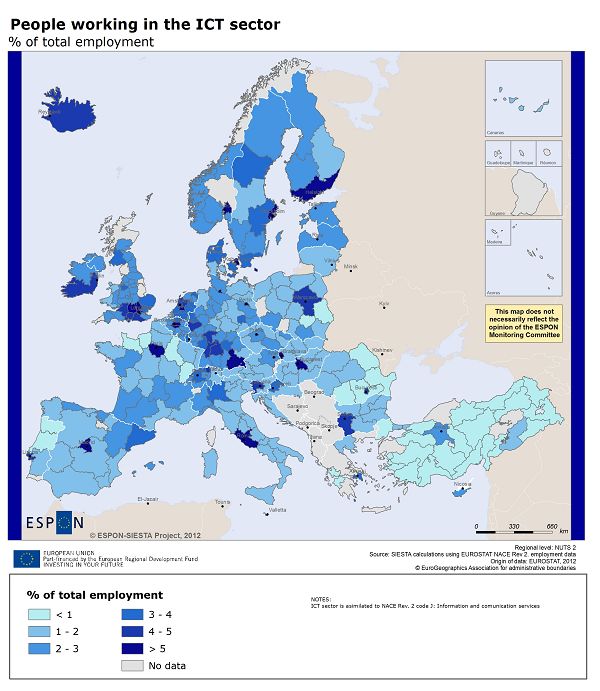
List of authors

Lila Leontidou, Stelios Gialis and Anastasia Stringli.

Lila Leontidou coordinated this and wrote the section “EU2020S Digital
Society - Systematisation and policy guidelines related to 4 maps”; S.
Gialis wrote sections on Maps 21, 22 and 24; and Anastasia Stringli on
Maps 23 and 25. The authors wish to thank Alex Afouxenidis for
theoretical insertions, especially concerning territorial convergence and
interactive media, and help with Maps 23 and 25; and Anastasia Vatsou
for empirical work on the Balkans.

ESPON 2013                                                             3

Table of contents

1.    Text of description of each of 5 maps ................................ 5

  1.1.  Map 21: People working in the ICT sector (% of total
  employment) ....................................................................... 5

  1.2.   Map 22: ICT patent applications to the EPO (% of total
  patent applications, 2008) ................................................... 16

  1.3. Map 23: Βroadband penetration rate 2006-2009 .............. 26

  1.4.   Map 24: E-commerce: individuals who ordered goods or
  services over the Internet for private use (percentage of
  individuals) ....................................................................... 32

  1.5.     Map 25: Individuals who have never used a computer ... 41

2.   EU2020S Digital Societies: Systematization and policy
guidelines related to 5 maps ................................................... 48

  2.1. Regional and urban weaknesses or challenges ................. 49

  2.2. Regional and urban strengths or potentials ...................... 51

  2.3. Policy guidelines for a Digital Europe .............................. 53

  2.4.     Limitations of ESPON-SIESTA Maps ............................. 54

3.    Conclusion on Digital Societies ........................................ 56

4.    References ................................................................... 58

ESPON 2013                                                                             4
PART 1.

    1. Text                 of description of each of 5
            maps

1.1. Map 21: People working in the ICT sector (% of
total employment)
Definition of the indicator

This indicator under discussion is derived from Eurostat’s “Employment by
economic activity” (Labour Force Survey). The survey population for this
consists of enterprises with 10 or more persons employed and the
reference area encompasses EU-Member States, Candidate countries,
Iceland and Norway. Annual time series available from 2002 onwards and
published on a yearly basis are used for the calculation of the indicator.
Since 2008, definition of the ICT sector is based on NACE rev.2
classification and it includes both manufacturing1 and services2 related to
computers, telecommunications, data, web-hosting and similar activities.

The concept of “persons employed”, measured as the yearly average
during the previous calendar year, as it is used by the Structural Business
Statistics (SBS) is therefore applied. What’s important to underline is that
the number of persons employed is something distinct from the number of

1 Specifically computer, electronic and optical products (26.1), computers and peripherals (26.2),
communication equipment (26.3), consumer electronics (26.4) and magnetic and optical media
(26.8), in parentheses the corresponding Nace rev.2 codes of the activities.
2 Specifically repair of computers and communication equipment (95.1), wholesale of computer and
ICT equipment (46.5), software publishing (58.2), telecommunications firms (61), computer
programming and consultancy (62) and data processing and web-hosting (63.1).

ESPON 2013                                                                                      5
employees (that excludes unpaid workers) or the number of employees in full time equivalent units3. Relevance of the indicator People working in the ICT sector is quite an important indicator in terms of the following two aspects: it offers for a direct measure of individuals who are involved in high value-added activities, while it provides an indirect estimation of the diffusion and the socio-economic significance of ICT within and across certain spatial entities. The Lisbon strategy, the eEurope endeavour as well as the EU2020’s Strategy specifies the ICT sector as one of the core activities of the European societies, and decided on the need for quantitatively-substantiated policies for benchmarking and monitoring the expansion, the trends and the ongoing reformation in the sector. Therefore, a set of structural and a set of benchmarking indicators were defined for monitoring of the Lisbon process and the implementation of the eEurope and related policies. The ‘Digital society’ flagship is understood by the EU2020S in terms of enhancement of the activities of the ICT sector and related web-based networking activities. The ‘Digital Agenda’ aims to deliver sustainable economic and social benefits by means of the integration of EU’s regions towards a digital single market based on fast and ultra fast internet. Interoperable applications are also a basic priority of the Agenda. ICT activities are considered as weak aspects of the EU-27, at least as far as relative rates of expansion and exploitation are considered and related to the USA, Japan and other emerging economies. In this frame, the number of people employed in the ICT sector is significant for an account on the current situation as well as for an indicator of the gaps in ICT personnel in EU-27 that will have to be covered for the years to come. Thus, comprehensive and harmonised data on ICT expansion and employment is apparently needed. 3 The number of persons employed is the total number of persons who work in the firm (e.g. working proprietors, partners working in the firm and unpaid family workers) even if they are absent for a short period (e.g. paid leave or special leave, on strike), as well as those who work “outside” but belong and are being paid by it (e.g. sales representatives, delivery personnel, repair and maintenance teams). It also includes flex-workers such as part-time and seasonal and home workers on the payroll. For further details on SBS and a detailed analysis of methodological choices, see: Eurostat, 2012, Methodological Manual for surveys on the ICT Investment / Expenditure, available at http://epp.eurostat.ec.europa.eu/cache/ITY_SDDS/EN/isoc_pi_esms.htm. ESPON 2013 6
the ten regions with the        the ten regions with the lowest     the ten regions with or close to the

        highest share                           share                         median share (i.e. 2,25%)

 MS        Region       people      MS         Region      people as   MS            Region         people as

                        as a %                               a % of                                   a % of

                        of total                              total                                    total

                        employ.                             employ.                                  employ.

CZ01       Praha         8,19      TR33         Izmir         0,34     DE41      Brandenburg -         2,32

                                                                                     N d
SE11     Stockholm       7,67      TR42        Kocaeli        0,40     NL12      Friesland (NL)        2,30

UKJ1     Berkshire       7,51      TR72        Kayseri        0,41     PL63        Pomorskie           2,27

NO01      Oslo og        7,39      TR83       Samsun          0,43     FR24        Centre (FR)         2,26

UKI1       Inner         7,36      TR90       Trabzon         0,45     NO05        Vestlandet          2,26

DK01    Hovedstade       7,01      TR41         Bursa         0,50     UKD5        Merseyside          2,25

           Île de
FR10                     6,71      TR21       Tekirdag        0,53     UKD4        Lancashire          2,25
           France

SK01     Bratislavsk     6,65      TR32         Aydin         0,54     NO04         Agder og           2,22

ES30       Madrid        6,36      TR52        Konya          0,55     FR51      Pays de la Loire      2,20

BE10      Bruxelles      6,12      TR71       Kirikkale       0,55     CZ06        Jihovýchod          2,18

Country codes: BE Belgium, CZ Czech Republic, DE Germany, DK Denmark, ES Spain, FR France, NO Norway, NL

Table 1/ Map 21                This table shows the ten nuts-2 level regions with the
              highest, the lowest and the median share of people working in
              the ICT sector in relation to total employment, in 2010.

Discussion of the geographical pattern of map 21

Introductory notes: the ICT sector has a strong regional dimension

ESPON 2013                                                                                                     7
The ever-increasing utilisation of intelligent systems and the overall technology-intensive character of the sector, coupled with falling prices, global competition and the needs of sustained accumulation in new sectors, as profits in traditional sectors are constantly decreasing, has resulted in the current importance paid on the ICT sector. Relevant ICT literature paid severe attention on issues of relative productivity, on increasing shares found in competitive markets, on employment and labour productivity, on workplace organisation and on the overall effects of ICT activities upon R&D and innovation. The ICT sector produces about 5% of European GDP, with a market value of € 660 billion annually, while it contributes far more to overall growth and productivity as a large amount of investments is (in)directly connected to this sector. Still, development of ICT activities has been considered as a weak aspect of EU’s competitiveness, as major established competitors (e.g. the USA) as well as emerging global players (see China and India) seem to perform quite better in the field. Thus, the need to enhance and promote technological reformation and innovation, in general, and ICT activities and employment more specifically, is a central task that should be accomplished throughout the European area (European Commision, 2010). Yet, as several researchers outline, the sector is in close inter-relationship with its territorial context. In other words, the “ICT phenomenon” can be better conceptualised and empirically tested when studied in accordance to its regional dimension. Such an argument can be better understood when specific cases are brought to light and discussed: Baden- Württemberg in Germany and Silicon-Valley in the States, to name but a few, are spatial entities where innovation, R&D and the ICT are all strongly localised and socio-spatially embedded. This is why such cases are considered as successful and their good-practices are often analysed and discussed in the literature (Barrios et al, 2008; Koski et al, 2002). The findings of the ESPON- SIESTA strongly support this argument. The regional distribution of ICT employment is highly uneven, with certain regions, many of them around capital cities, exhibiting high values and other regions, mostly in the European West and Southern areas, lagging behind. It should be noted that a relatively big area of the EU-27, encompassing candidate countries of the Balkans and Greece cannot be evaluated as no data were found for these countries and their regional settings. Yet, data missing is also an indirect, though insufficient, sign of the low penetration of the ICT sector in these countries. Comparison of existing patterns with macro-regions and ESPON regions ESPON 2013 8
The main divisions that are present in the EU-27 and the candidate
countries in terms of the regional ICT sector employment, as pictured in
map 21, are the following:

    a) the North/ South division

    b) the metropolitan/ non metropolitan areas division

    c) the new/ old members running in parallel to the new/ candidate
       countries division

    d) the technology-intensive and competitive/ less technologically
       advanced and non-competitive regions division

    e) finally, the advanced/ less developed regions divisions

These divisions are not solid and clear-cut and they are not typical of the
whole study area as different patterns may exist, while they should be
interchangeably used in order to have an integrated theoretical
explanation of figures and empirical observations. At first, an arc that
starts from the wider London area and the South UK, runs through certain
regions of the Benelux countries, the South Germany, Milano and the
North of Italy and ends above Ile de France and Paris, is easily
observable. Not surprisingly, all regions contained in this arc are spatial
agglomerations of the North-West Europe, encompassing cities and towns
that are important nodes of the global value chains, of a high-value added
character, and belong to countries that are in the core of the EU’s
structures for decades now4.

Secondly, many regional ‘clusters’ of important ICT employment can be
located in the urban regions of Madrid, Dublin, Oslo, Copenhagen and
Helsinki. These are spatial entities that contain capital cities and wider
areas of established members of the EU-15, holding a relatively dynamic
and externalised economy during the past two decades or so. The
innovative level of Scandinavian countries on a global scale in ICT
development and especially cellphones, is well established. Among the
regions that exhibit the highest figures of ICT employment ‘Bratislavský
kraj’, where Bratislava is located, is the only exception to the above two
geographical entities of high ICT employment. In fact, Bratislava and
Neuchdtel form a zone of important ICT sub-sectors specialisation. All the
other cases are restricted to the metropolitan regions of London, Paris,
Brussels and other agglomerations highlighted above (Barrios et al, 2008;
Koski et al, 2002).

4
    Indicative  well-known    examples     of  ICT    sub-sectors   found   therein   are
telecommunications, photonics, printing, and IT services in Cambridge; design and
manufacturing of electronic systems, chip and, sensors making in Tuscany; and software
firms, mobile phones, medical applications, control systems and in data systems in Kosice
(ESPON KIT, 2012).

ESPON 2013                                                                             9
Put it in terms of ESPON macro-regions, North-West Europe and the Atlantic Axis are well- advanced in terms of ICT employment while the Mediterranean Basin countries are lagging behind. The performance of regions that are within South-East Europe is somewhere in the middle. Theoretically speaking, it seems that agglomeration of economic activities plays an important role in the location of ICT firms although such activities were expected to be relatively independent of the distance factor. It is believed that ICT location choices are better conceptualised when Marshallian externalities together with the famous New Economic Geography concepts, such as ‘input-output’ linkages and ‘increasing’ returns are taken into account. The latter (i.e. increasing returns) give firms an incentive to locate near markets and suppliers in order to save on transport costs, thus self-reproduced market-size effects that strengthen agglomeration do take place (ESPON KIT, 2012). Discussion in the frame of EU2020s targets A discussion of the evolution of the ICT sector helps to explain the unequal geography of the activity across the EU and the candidate countries. A series of multinational companies that were investing in the sector have started to alter their locational decisions since the late 1990s, in favour of newly accessed members such as the Czech Republic and Slovakia. Before that turning point, most of their subsidiaries in Europe where concentrated in urban centres and relatively affluent regions of Germany, UK, Ireland and Netherlands (i.e. North-West Europe). The basic advantages that seem to have attracted these investments in the emerging ‘ICT poles’ where the existing pools of specialised employees and ICT practitioners, existing industrial specialisation in the area (an important factor in the case of the computing-services sub-sector), dense networks of ICT SME’s running in the area (relatively important for ICT manufacturing) and other factors such as growth rates and entrepreneurial climate in the region (ESPON KIT, 2012). For example, tax advantages provided by the Irish administration hold an important role for the concentration of the sector in urban centres of the country. In their recent study and based on the Spanish case Barrios et al (2008) indicate that ICT investment lowers the developmental-gap between the regions of the country, despite the spatial concentration of relative activities and employees in the capital region of Madrid. This finding is in accordance with previous findings that consider regions significantly specialised in ICT producing as those regions that will mostly be favoured by the expansion of the sector. ESPON 2013 10
In parallel to established ICT agglomerations of the EU-15, new regional
growth poles can be identified, especially in regions where employees of
the expanding computing services sub-sector are found (e.g. Dublin,
Bratislava). This sub-sector is of an intensive innovative character, in
need of large amounts of specialised employees, while requires relatively
low investments in the form of fixed capital.

The ICT sector, as many other high-value added activities, is rather
concentrated in diversified regional economies, at least when compared to
traditional industrial sectors which tend to prefer non-diversified regional
settings. SME’s in the ICT sector are in many cases based on intensive
R&D, which is in turn an outcome of, basically informal, knowledge
exchange networks. On the other hand, multinational companies that
have subsidiaries in regional economies of the eastern EU’s newly
accessed members, draw upon formal and internal networks channels,
while their knowledge exchange ramifications frequently expand towards
the European or the global arena.

The regional along with the sectoral are the most important dimensions
that shape employment prospects in the ICT activities in the EU. Some
prominent regions, such as the Île de France region stands, present an
interesting diversification and almost all ICT sub-sectors have large
amounts of employees represented therein. In parallel, features of highly-
skilled and better-educated employees are quite important in all of these
sub-sectors. This trend affects all IC-developed regions of the EU-15, as
well educated ICT personnel in a specific ICT activity is a sign of relative
high shares of such employees in all ICT sub-sectors in the region.

Regions where ICT employment is relatively low or even absent present
certain similarities and disadvantages: in fact they lack of a sufficient
number of SME’s or even bigger firms of an innovative character (e.g.
spin-off firms) which are closely connected and frequently interact to local
universities and centres of research (see Table 2 & Table 3). The latter
connection to research centres and educational institutions is crucial, at
least during the first years of an ICT company.

                     the ten EU-27 regions with the lowest share

         MS       Region    people as a %       MS         Region    people as a %

                                of total                                of total
                             employment,                             employment,

                   Sud –                                 Región de
        RO31                     0,65          ES62                      0,88
                 Muntenia                                  Murcia

ESPON 2013                                                                           11
Basse- Dytiki
FR25 0,75 GR23 0,92
Normandie Ellada
Haute-
RO11 Nord-Vest 0,82 FR23 0,93
Normandie
RO21 Nord-Est 0,86 PT11 Norte 0,94
Franche-
FR43 0,87 RO22 Sud-Est 0,94
Comté
Country codes: ES Spain, FR France, GR Greece, PT Portugal, RO Romania.
Table 2/ Map21 This table shows the ten EU-27 nuts-2 level
regions with the lowest share of people working in the
ICT sector in relation to total employment, in 2010.
For example, in the Greek case and based on previous studies on flexible
specialisation and innovation prospects in the area, many regions with
promising enterprises cannot innovate due to insufficient networking, lack
of a common supply policy, isolated functioning, poor research
dissemination policy and institutional framework etc. Nowadays, regions
with poor ICT employment face two important competitive challenges: the
one that comes from the already established ICT growth poles and the
cumulative causation effect underlined above, and the second that comes
from other global competitors, such as India and China where spatial
concentrations of an innovative character have been recently developed.
Ironically, many of these emerging ICT regions around the globe were
triggered out when EU-based multinationals decided to invest abroad in
search of lower-costs for specialised employment (Barrios et al, 2008).
Conclusion: promoting ICT employment as a means to overcome regional
divergence
Metropolitan regions have historically attracted and at the same time
reproduced specialisation and innovation. Given the high concentration of
the ICT sector and relative employment in such cities and their wider
areas, the full utilisation of their benefits and prospects could enhance
regional innovation, close the gap between wealthy and less privileged
areas, and offer for a diffusion of innovative and skilled employment
towards the less urbanised areas (especially the regions in industrial
transition and the urban-rural regions), the South and the candidate
countries.
ESPON 2013 12This theoretically informed study of map 21 proved that there is a very
uneven distribution of ICT employment across EU regions. This
distribution is determined by certain divisions, such as the metropolitan/
non-metropolitan regions division, which run across the European area
and shapes the identity of its socio-spatial entities. In parallel to
established ICT agglomerations of the EU-15, new regional growth poles
can be identified, especially in regions where employees of the expanding
computing services sub-sector are found. The idea of promoting through a
coherent policy framework new ICT regional growth poles is substantial
and should be incorporated to the EU 2020s Strategy. Such poles could
encompass ICT sub-sectors that demand relatively high investments in
human capital and skilled employment, rather than focusing on fixed-
capital and expensive infrastructures development. The regions of
Bratislava and Kosice in Slovakia, Cork in South Ireland, and similar cases
prove that such a targeted policy could offer for new poles of ICT
development in metropolitan regions of the EU south, such as Attica-
Athens in Greece and the wider Zagreb area, where important though
insufficient ICT employment already exists (see Table 3).
Future European policy and the E2020’s implementation (European
Commision, 2011), would require a promotion of ICT labour skills and the
diffusion of ICT usage throughout micro- and mediums-sized firms. Such
measures, along with the improvement of telecommunication and general
ICT infrastructure will help the EU-27 and the candidate countries regions
to develop and externalise their ICT potential as well as attract
investments from abroad.
the share of EU-15 countries the share of the rest of EU-27 countries
MS Country people as a % of total MS Country people as a % of total
employment, 2010 employment, 2010
AT Austria 2,67 CY Cyprus 2,13
Czech
BE Belgium 3,40 CZ 2,81
Republic
DK Denmark 4,28 EE Estonia 2,17
FI Finland 3,88 HU Hungary 2,53
FR France 2,84 LV Latvia 3,12
DE Germany 3,18 LT Lithuania 1,78
GR Greece 1,95 MT Malta 3,04
IE Ireland 3,93 PL Poland 1,98
IT Italy 2,32 SK Slovakia 2,41
ESPON 2013 13LU Luxembourg 3,94 SI Slovenia 3,34
NL Netherlands 3,51 BG Bulgaria 2,30
PT Portugal 2,12 RO Romania 1,36
ES Spain 2,74
SE Sweden 3,97
United
UK 3,47
Kingdom
EU- EU-12 (27 minus
3,02 2,09
15 15 old members)
EU-27: 2,84
Table 3/ Map 21 - This table compares the EU-15 member states with the
rest of EU-27 countries in terms of people working in the ICT sector in
relation to total employment, in 2010. Note that it does not show a clear
divide across the board.
References
Barrios, S., Mas, M., Navajas E. and Quesada J. (2008), Mapping the ICT
in EU Regions: Location, Employment, Factors of Attractiveness and
Economic Impact. European Commission: Joint Research Centre Institute
for Prospective Technological Studies (available at http://ftp.jrc.es).
ESPON KIT (Knowledge, Innovation, Territory) project (2012), Draft Final
Report (v. 24/2/2012), (available at http://www.espon.eu).
European Commision (2011), The urban and regional dimension of Europe
2020, 7th progress report on economic, social and territorial cohesion.
Luxembourg: Publications Office of the European Union
(doi:10.2776/50938).
European Commision (2010), A Digital Agenda for Europe. COM(2010)
245 final/2 (available at http://www.espon.eu).
European Commission (2010), The Flagship “Youth on the Move” –
COM(2010) 477 final.
European Commission (2010), The Flagship “An Agenda for New Skills and
Jobs” – COM(2010) 682 final.
European Commission (2010), Investing in Europe’s future. Fifth Report
on Economic, Social and Territorial Cohesion. Luxembourg: Publications
Office of the European Union.
Koski H., Rouvinen, P. and Ylä-Anttila, P. (2002), ICT clusters in Europe:
the great central banana and the small Nordic potato. Information
Economics and Policy, v.14.2, pp. 145–165.
ESPON 2013 14ESPON 2013 15
Map 21 People working in the ICT sector

1.2. Map 22: ICT patent applications to the EPO (%
of total patent applications, 2008)

Definition of the indicator

The indicator under discussion is derived from OECD’s Regpat Database,
which is one among the 4 different sets of patent data that the
Organization has developed for research and policy analysis. Most of these
datasets draw upon EPO’s Worldwide Statistical Patent Database
(PATSTAT) which offers an integrated and comparable set of information

ESPON 2013                                                             16
on applications that are submitted in patent offices across the globe. In
parallel to EPO’s data, the Regpat database also encounters patent
applications filed under the Patent Co-operation Treaty (PCT) that
designate the EPO, and are linked to almost 2000 regions across OECD’s
members through the inventors/applicants addresses.
In this frame, the indicator under discussion records ICT patent
applications as a percentage of total applications during a given year. In
other words, it is an indicator of invention as patents are a means of legal
protection of inventions developed by firms, institutions or individuals5. To
be precise, it is an indicator of the relative share of ICT inventions in
relation to the whole patent applications within a specific territorial-unit.
The survey population for this consists of all patent applications and the
reference area encompasses EU-Member States and all other OECD
countries. As for the ICT sector, since 2008 its definition is based on NACE
rev.2 classification and it includes both manufacturing and services
activities that have been thoroughly described in the case of map 21.

Relevance of the indicator

ICT patent applications along with other patent-related indicators is of
relevance as it offers for a direct measure of the relative share of ICT as
compared to total invention activity, while it stands for an indirect
measure of the intensity and the embeddedness of ICT research and
development within and across certain spatial entities. Put in other words,
it is an indicator that reflects a region's inventive activity in ICT, and
reveals the corresponding effort to transform R& D into new ideas and
products, thus gain potential profits and establish future trademarks.

During the past decade or so, Eurostat, OECD and other statistical
agencies had exhibited important effort for developing patent statistics
indicators. This signifies the need to monitor advancements in theoretical
and applied science as well as in technological apparatuses which have
been expanding throughout EU and the globe.

The inherited regional dimension of the indicator under study is of
importance for policy making and decisions, as it provides proper
benchmarking and evaluates regional performance in relation to national
and EU R&D, innovation, and ICT promotion policies. As such, it enables

5
 Patents protect inventions and ensure that the holder holds market exclusivity on its invention. Every
use of the protected invention requires the consent of the patent holder. The patent is usually
submitted to a national patent office, and if successfully awarded it is valid for a maximum of 20 years
and covers a specific area (usually a national or international market area). As soon as the protection
period comes to an end the invention belongs in the public domain (Maraut et al, 2008).

ESPON 2013                                                                                          17
the monitoring of the implementation of the Lisbon strategy, the eEurope
endeavour as well as the EU2020’s Agenda. Thus, comprehensive and
harmonised data on ICT patent helps to reveal disparities and design
harmonised and spatially-sensitive interventions for ICT clusters,
incentives for patent-focused research, and networks of excellence and
university-industry linkages.

ESPON 2013                                                           18
the ten regions with the         the ten regions with the lowest    the ten regions with or close

          highest share                          share                   to the median share (i.e.

  MS         Region         ICT       MS         Region        ICT       MS          Region     ICT

                          patent                             patent                           patent

                          as % of                            as % of                          as % of

                           total                              total                            total

                          applicat                           applicat                         applicat

                           ions                               ions                             ions
            Frankfurt
                                                 Steyr-
 DE411      (Oder),        100,0                               0,0      CH023    Solothurn     16,6
                                                Kirchdorf
                                     AT314
           Kreisfreie

             Regiγo
 PT200                     100,0                Auίerfern      0,0      ITE14     Firenze      16,6
           Autσnoma
                                     AT331
              dos
             Caraş-                                                              Herzogtu
 RO422                     100,0                Габрово        0,0      DEF06                  16,6
            Severin                  BG322                                             m

                                                                                 L       b
 BG412       София         100,0     BG323        Русе         0,0      DE93B        Verden    16,6

                                                                                  Sogn og
 ES421      Albacete       100,0                 Шумен         0,0      NO052                  16,7
                                     BG333                                        Fjordane

            Guadelou                           Appenzell
 FR910                     100,0                               0,0      PL522     Opolski      16,7
               pe                    CH054     Innerrhod

                                                Ansbach,
 FR930      Guyane         100,0                               4,1      FR513    Mayenne       16,7
                                     DE251
                                                Kreisfreie

             Sterea                             Cottbus,                         Freudens
 GR24*                     100,0                               4,3      DE12C                  16,7
             Ellada                  DE422      Kreisfreie                            tadt

           Medimurs                            Bremerha
 HR016                     100,0                               8,2      DE279     Neu-Ulm      16,8
               ka                    DE502        ven,
                   ij                           K i f i
            Splitsko-                           Rostock,
                                                                                 Hohenloh
 HR035     dalmatins       100,0                Kreisfreie     9,5      DE119                  16,8
                                                                                     ekreis
                                     DE803
               ka                                 Stadt

Country codes: AT Austria, BG Bulgaria, CH Switzerland, DE Germany, ES Spain, FR France, HR

Croatia, IT Italy, NO Norway, NL Netherlands, NO Norway, PL Poland, PT Portugal.

Table 2          This table shows the ten nuts-3 level regions with the
highest, the lowest and the median share of ICT patent applications to
the EPO, in 2008.

ESPON 2013                                                                                            19
Discussion of the geographical pattern of map 22 Introductory notes: the spatial dispersion of patent applications reflects, inter-alia, the strong regional dimension of the ICT sector The geography of patent and invention is a coin with two faces: one is the innovation face and the other is the socio-productive agglomerations face. Innovation is inseparable from the spatial entities where it potentially occurs. Innovative activities are unevenly dispersed within countries, as certain regions are of an innovative character while others present little or even no innovation efforts. An invention can flourish and start- up in places where specific mixtures of local/regional capabilities and/ or constraints are of influence. Such local capacities are the institutional framework, local tacit knowledge practices, governance, infrastructure and the general development of productive forces (e.g. skilled and general labour, composition of capital etc). The local effect of national and international policies in the level of market regulation, R& D promotion and legislation around intellectual property rights (IPR) do also matter. The increasing rate of patent applications combined with the intensified competition between major global players in the economic and regulatory effects of inventions has resulted in the current importance paid on the ICT patent activity. The technology and knowledge-intensive character of the sector taken as granted, re-produced capital accumulation demands new patents to be registered as this is a major way to verify secured profits in the markets. Patent applications and rights cannot be theorised without a closer look on the deeper necessities that production and accumulation imposes on the sphere of property and intellectual rights across the globe. A locally stabilised though internationally determined equilibrium between co-operation and competition, the two significant pillars of innovation, is unavoidably required on behalf of local firms and patent- producing experts. Yet, inventions are not solely the outcome of an environment that’s friendy to entrepreneurship and encouraging for new ideas. The local pools of semi-skilled or highly-skilled labour as well as the labourers agency, compromise, and resistance that influences the local labour politics agenda, are also important. Comparison of existing patterns with macro-regions and ESPON regions The main divisions that are present in the EU-27 and the candidate countries in terms of the ICT patent applications to the EPO as a share of total relevant applications, pictured in map 22, are the following: ESPON 2013 20
a) the new/ old members running in parallel to the new/ candidate
       countries division

    b) the industrialised/ non industrialised areas division

    c) the technology-intensive and competitive/ less technologically
       advanced and non-competitive regions division

As expected, following ICT employment which is highly uneven, a map of
the regional distribution of the total absolute number of ICT patent
application would definitely produce a spatial pattern that resembles a lot
to the one of ICT employment.6 There, certain regions, many of them
around capital cities, would exhibit high values and other regions, mostly
in the European West and Southern areas, would lag behind. Yet, map 22
pictures the relative importance of ICT patent activity in relation to total
patent activity and as such, patterns revealed here are quite different. In
this case, the intensity of ICT patent activity is more or less revealed,
independently of how big or narrow the total inventing activity in the area
is. This is why many regions of the European South, including places in
the Southern territories of Italy, Spain, France and Turkey are performing
quite well. Having this in mind, the uneven distribution of ICT applications
to the EPO in relation to total patent activity, which resembles a little with
the typical North/ South distinction that is monotonously repeated in
every indicator that pictures development indicators in the EU regions, can
be better explained.

The total number of ICT patent applications, to a large degree, and the
relative share of ICT to total patent applications, to a lesser extent, is two
good determinants of the economic base and the innovative capacity of a
European country/ region. In 2008, Germany was the leading EU member
in this field, with 4.980 ICT patent applications, followed by France with
2.126 and the United Kingdom with 1.255. The ICT patent shares of these
countries are 22,1%, 29,1% and 29,9% respectively. A comparison
between Germany and the other countries mentioned reveals a slight yet
important widening of the gap among the “leader” and the “followers” in
patent applications7. This is to certify the economic sovereignty of the
German economy throughout the European arena.

6
  See for example “ICT patent applications to the EPO, by NUTS 3 regions, 2006” Map that is available
through Eurostat’s map database (http://epp.eurostat.ec.europa.eu).
7
  Finland is a remarkable case of excellent performance as its ICT patent applications per million
inhabitants value is ranked as first in EU and exceeds 124 applications. The next two countries in the
top three places are Netherlands and Sweden. More than 50% of the Finnish patent applications are
ICT-related, and the majority of them is generated by flousrishing telecommunication industry therein.

ESPON 2013                                                                                        21
Yet, the 7.777 patents filed by USA and the 6.810 filed by Japan during the same year, which in turn correspond to significantly higher levels of ICT patent share to the EPO (34, 4 for USA and 41,3 for Japan) underline the continuing efforts paid by the European Commision in the level of patent applications promotion (European Commision, 2010; Barrios et al, 2008). Seen from a regional point of view, the performance in relation to patent applications is quite diversified, as already implied. Among the top nuts-3 level regions in total number of ICT patents one can locate agglomerations nearby Stockholm in Sweden, Noord-Brabant in Netherlands, and Frankfurt and Oberbayern in Germany. More or less all these regions perform quite well as they usually overpass the level of 300 applications on a total level and their share of ICT patent exceeds 40%. These are the leading regions in the field although many other regions that perform quite better in terms of ICT share do exist (as in Tables 1 & 2). Discussion in the frame of EU2020s targets Santangelo (2002) through his study of a sample of USA patents that were granted to some big electronic firms in the EU, had studied the interaction set forth for patenting between USA and European electronics firms. Specifically, he studied companies of R& D that were located in German, UK and Italian regions and found that patenting is attracted to already existent areas of industrial development and agglomeration, taking a form of cumulative causation. Many different aspects of European regional structures, with specific importance paid to economies of agglomeration, are able to explain the distribution of innovation. Of importance here is the exploitation of human capital and common resources by innovative agents and firms. The role of “clusters” and their interaction with “local externalities” and subsequent effects can also help to explain regional patterns of innovation and invention. Positive local externalities are in turn re-produced due to geographical proximity and the lower costs that are associated to easier communication and transportation, though certain negativities such of concentration, such as congestion, may occur. Local and national incentives for research and development, funded research groups, and other local agents can formate spillovers of knowledge and good-practices diffusion (KIT, 2012). ESPON 2013 22
the ten EU-27 countries with the lowest share

         MS        Region      ICT patent as      MS         Region   ICT patent as

                                 % of total                            % of total

                               applications,                          applications,

                                   2008                                   2008

         IT         Italy          14,9            ES        Spain        21,0

         AT        Austria         19,2           DE        Germany       22,1

         LV        Latvia          20,0           GR         Greece       23,8

                                                             Czech
         DK       Denmark          20,4           CZ                      24,0
                                                              Rep.

         CH      Switzerland        20,           BE        Belgium       25,0

   Table 2/ Map 22 This table shows the ten EU-27 countries with
     the lowest share of ICT patent applications to the EPO, in 2008.

In terms of ICT patent applications, inventors’ companies that are based
in the USA file a higher number of patents than their EU counterparts. The
ICT patent share for different kinds of telecommunication and technology
applications is apparently higher for the USA and the EU 2020’s
implementation has to take serious measures in order to overcome this
obstacle (Turlea et al, 2010).

Conclusion: patent applications as an indicator of unevenness across EU
regions

The uneven distribution of ICT patent applications across EU calls for a re-
theorisation of EU and national policies regarding the legal aspects and
the socio-technical presuppositions of invention. The idea of promoting,
through a coherent policy framework, new ICT patent-promoting growth
centres in certain EU regions and localities should be incorporated to the
EU 2020s Agenda. Potential locations that could welcome such centres are
both i) already existing centres of intensive ICT activity, regional clusters
of innovation and similar technologically advanced agglomerations (see
map 21 for potential locations of this character) and ii) less-favoured
spatial entities that hold a hidden ICT potential. As far as the latter are
concerned, map 22 brought to light a variety of areas dispersed across
EU, many of them in the European South, that though have a narrow
basis of patent applications are still characterised by very intensive ICT
invention efforts. The regions found in Sicily, Greece, South Spain and
similar areas prove that such a targeted policy could offer for new poles of

ESPON 2013                                                                            23
ICT patent applications, not necessarily close to existent metropolitan regions of the EU, where a promising innovative and ICT-focused patent activity could be reproduced. The discussion of regional ICT patent filing distribution revealed that, nowadays, a regionally-sensitive focus is of great importance for the conceptualisation of the determinants of spatial concentration of firms’ and individuals patent activity as well as national and/ or cross-border regional hierarchies regarding inventions. This is so as, glo-calised structures of economic activity and frequent technological advances continuously re-create regional formations that innovate and others that stay behind, thus reproduced over time ‘sticky places on a slippery space’ through a cumulative causation dynamic. Future European policy and the E2020’s implementation (European Commision, 2011), would require a promotion of inventions and patent applications and a wider enhancement of innovative ideas produced by firms, researchers and entrepreneurs. Such measures, along with the improvement of general ICT infrastructure and the update of relevant legislation and the regulatory framework will help the EU-27 and the candidate countries regions to overcome stagnation and develop and externalise their patent potential. References Barrios, S., Mas, M., Navajas E. and Quesada J. (2008), Mapping the ICT in EU Regions: Location, Employment, Factors of Attractiveness and Economic Impact. European Commission: Joint Research Centre Institute for Prospective Technological Studies (available at http://ftp.jrc.es). European Commision (2011), The urban and regional dimension of Europe 2020, 7th progress report on economic, social and territorial cohesion. Luxembourg: Publications Office of the European Union (doi:10.2776/50938). ESPON-KIT (Knowledge, Innovation, Territory) project (2012), Draft Final Report (v. 24/2/2012), (available at http://www.espon.eu). European Commision (2010), A Digital Agenda for Europe. COM(2010) 245 final/2 (available at http://www.espon.eu). Maraut, S., Dernis, H., Webb, C., Spiezia, V. and Guellec, D. (2008), The OECD REGPAT Database: a presentation. STI Working Paper, 2008/2, OECD (available at http://www.oecd.org/dataoecd/22/19/40794372.pdf) Santagelo G.D. (2002) The Regional Geography of Corporate Patenting in Information and Communications Technology (ICT): Domestic and Foreign Dimensions. Regional Studies, v.36.5, pp. 495–514. ESPON 2013 24
Turlea, G., Nepelski, D., de Prato, G., Lindmark, S., de Panizza, A., Picci,
L., Desruelle, P., and Broster, D. (2010) The 2010 report on R&D in ICT in
the European Union. EC: Joint Research Centre- Institute for Prospective
Technological Studies, Luxembourg: Publications Office of the European
Union.
Map 22 ICT patent applications to the EPO
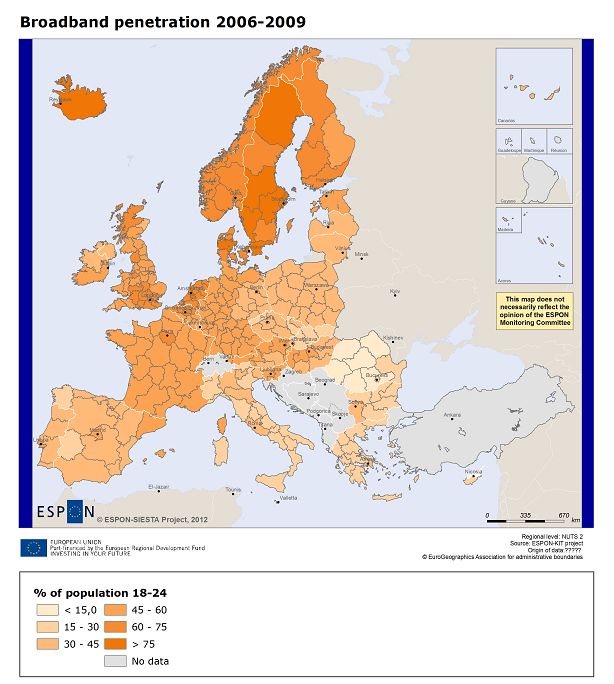
ESPON 2013 251.3. Map 23: Βroadband penetration rate 2006-2009 Definition of the indicator The broadband penetration rate describes the number of dedicated, high- speed connections per 100 inhabitants. This indicator shows how widely broadband access to the internet has spread in the countries on the general level, not specifying by user group. Broadband lines are defined as those with a capacity equal or higher than 144 Kbits/s. This speed is measured in download terms. Various technologies are covered; ADSL, cable modem as well as other types of access lines. Relevance of the indicator This indicator reveals the number of broadband lines contracted as a percentage of the total population. According to the Broadband Policy approved by the Federal Cabinet in 2004 the broadband is defined as ‘always-on internet connection with a minimum download speed of 128 kbps connectivity’. The ‘always-on’ facility means that the user has access to the internet as soon as he/she switches the internet browser on and does not need to dial the ISP number for a connection. The major differences between the traditional narrow-band (dial up) internet access and broadband internet access are in the speed of access and ‘always-on’ capability of broadband due to which a range of applications become available. ESPON 2013 26
Βroadband penetration rate 2006-2009

 the     ten    regions      with   the   the ten regions with the   the ten regions with or close to

 highest percentages                      lowest percentages         the median (i.e. 47)

 MS        Region                         MS       Region            MS         Region

  SE11          Stockholm           84     RO22    Sud-Est     17     AT34        Vorarlberg      48

               Sydsverige                            Ipeiros                    Shropshire and

                                                                                 Staffordshire
  SE22                              80     GR21                17     UKG2                        48

                 Ísland                               Ionia                        Salzburg
  IS00                              80     GR22       Nisia    17     AT32                        48

               Hovedstaden                           Dytiki                       Burgenland
  DK01                              79     GR23      Ellada    17     AT11           (AT)         47

  NL31           Utrecht            79     GR24      Sterea    17     DEC0         Saarland       47

                  Östra                             Peloponn                    Niederösterreic
  SE12     Mellansverige            79     GR25       isos     17     AT12               h        47

               Västsverige                           Centru                      Illes Balears
  SE23                              79     RO12                14     ES53                        47

                  Norra                              Nord-                      Oberösterreich
  SE31     Mellansverige            78     RO11       Vest     13     AT31                        47

                 Noord-                              Sud -                         Nyugat-
  NL32           Holland            76     RO31     Muntenia   12     HU22         Dunántúl       47

  DK04         Midtjylland          76     RO41     Sud-Vest   11     ES64          Ciudad        46

  SE33            Övre              76     RO42       Vest     10      SI01        Vzhodna        46

                                                    Nord-Est                       Zahodna
                                           RO21                9       SI02                       46
                                                                                   Slovenija

Table 1/ Map 23 This table shows the ten nuts-2 level regions with the
highest, the lowest and the median share of broadband penetration rate
2006-2009.

Discussion of the geographical patterns of map 23

Introductory notes
Access to information and communication technologies (ICT) is at the
heart of the digital divide, and geographic location is just one aspect of
that divide. Regional statistical data on access to the internet within

ESPON 2013                                                                                             27
households and the availability of broadband for going online exist at European level. Fast internet access is one specific action area of the Digital Agenda for Europe. New and innovative developments of electronic services rely on fast wired and wireless internet access. It is therefore essential to foster and monitor the development of fast internet access as part of the benchmarking framework. It is assumed that by 2013, all citizens within the EU should have access to broadband. Comparison of existing patterns with macro-regions and ESPON regions By 2020, the minimum bandwidth of the broadband Internet connections should be 30 Mbps, with 50 % of the households having a speed of at least 100 Mbps. In contrast to supply-side statistics, Eurostat indicates the actual uptake of ICT by the population. In 2010, 7 out of 10 (70 %) of households on average in Europe with members aged between 16 and 74 years had access to the internet at home and 6 out of 10 (61 % of households) accessed the internet via broadband. These numbers have grown rapidly in recent years, with an average annual growth of 5 percentage points for internet access and 6 percentage points for broadband access between 2008 and 2010. While access to the internet makes it possible to participate in the information society, broadband connections enable internet users to fully exploit the potential of the net. Many advanced internet services, such as social networking sites, uploading and downloading of media content (video and audio files) or the use of online maps and satellite images, automatically require a broadband connection. Websites are becoming richer in content, and this constantly increases the demand for traffic volumes, even for less advanced services such as e-mail communication. The national differences in internet connections and broadband access of households in 2010 are considerable. They range from 33 % in Bulgaria to 91 % in the Netherlands for internet connections and from 23 % in Romania to 83 % in Norway and Sweden for broadband access. The European Union averages are 70 % for internet connections and 61 % for broadband access, which means that some countries are lagging well behind the EU average (Eurostat, 2011). The EU average for the development of internet connections between 2008 and 2010 is 4.9 percentage points and 6.1 percentage points for broadband access. The best performing countries as regards new internet connections are, the former Yugoslav Republic of Macedonia, Turkey, Poland, Greece and the Czech Republic, with an average annual increase of more than 7.3 percentage points, while the least performing countries are Sweden, Austria, Denmark and Norway, with an average annual increase of less than 3 percentage points. A similar picture can be drawn for broadband access of households. Here, ESPON 2013 28
the best performers are Croatia, Germany, Poland, Greece and Italy, with
an average annual increase of 9 percentage points or more. In Bulgaria
and Denmark the average annual increase was 3 percentage points or
less.

When interpreting these results one has to bear in mind that it is easier to
achieve high growth rates at a lower level, whereas growth rates tend to
decrease when reaching higher levels. In order to maintain high growth,
efforts and investments have to be intensified. This rule is borne out when
one observes the take-up and development of Internet and broadband
connections. Linear regressions between take-up and annual average
growth are significant and yield a decrease in the growth of Internet
connections at higher levels of connected households. It could be
expected that countries like the Netherlands, Denmark, Austria or Sweden
would exhibit low growth, as they have already reached high levels of
Internet access.

Taking these observations into account, countries could be classified
according to levels of Internet and broadband access in below and above
EU average levels which have already been reached. A similar grouping
could be applied to the average annual development of internet and
broadband connections. France and Luxembourg perform above the EU
average as regards the levels and the development of Internet
connections, whereas Estonia, Lithuania, Slovenia, Slovakia, Bulgaria and
Latvia are below average when it comes to the level and growth of
Internet connections. The situation concerning broadband access is more
mixed, i.e. the differences between the countries are more pronounced.
Germany, Malta and Slovenia show an annual growth and take-up above
the EU average between 2008 and 2010, while Turkey, Portugal,
Lithuania, Hungary, Romania and Bulgaria are below the EU average.
(Eurostat:2011). The statistics on internet connections and broadband
access are closely related, as broadband is a type of Internet connection
and efforts are being made at both European and national levels to foster
broadband access to the Internet. However, not all countries and regions
are equally successful in deploying fast Internet connections that enable
users to make full use of the potential of the Internet.

The situation for broadband access is to some extent comparable to the
development of internet connections. The regions with the highest
increase in broadband access are located in the UK (North East, North
West), the Netherlands (Drenthe), the Czech Republic (Severozápad),
Italy (Sardegna), Croatia Središnja i Istočna (Panonska) Hrvatska) and
Germany (Brandenburg, Hessen, Sachsen, Sachsen-Anhalt, Schleswig-
Holstein, Thüringen) with an average annual growth of at least 12
percentage points.

ESPON 2013                                                               29
With respect to growth of net connections, the regions with the lowest
growth (below 1 % point) are located in the Netherlands, Bulgaria,
Norway and the UK. With the exception of Severoiztochen (Bulgaria), the
regions are well above the EU average in broadband take-up. All regions
in Germany, Greece, Croatia, Ireland, Italy and Poland are above the EU
average as regards the average annual growth of broadband access in
percentage points.

Discussion in the frame of EU2020s targets

The Digital Agenda for Europe is one of the seven flagship initiatives of the
Europe 2020 Strategy, set out to define the key enabling role that the use
of Information and Communication Technologies (ICT) will have to play if
Europe wants to succeed in its ambitions for 20208.

The development of high-speed networks today is having the same
revolutionary impact as the development of electricity and transportation
networks had a century ago. With the on-going developments in
consumer electronics, the lines between digital devices are fading away.
Services are converging and moving from the physical into the digital
world, universally accessible on any device, be it a smart-phone, tablet,
personal computer, digital radio or high-definition television. It is
projected that by 2020 digital content and applications will be almost
entirely delivered online.

Broadband penetration grew by leaps and bounds initially after being
widely introduced in the early 2000s. By 2004, in the USA and the UK,
over half of internet users were using broadband at home, at the office, or
in both locations. However, broadband penetration began to decline
rapidly in many Western nations after this point, as early adopters had
already picked up the technology and older Internet users felt that they
either couldn't afford it or didn't need it. This often occurs with new
technology which initially captures the public imagination and then falls off
as it reaches peak saturation in the market.

The area of the world with the highest broadband penetration is Asia,
which bypassed traditional dial-up access to the internet in many locations
and jumped to satellite or DSL broadband services. Europe is next, with

8
  The Digital Agenda is built upon wide consultations, in particular on inputs from the
Digital Competitiveness Report 2009 - COM(2009) 390; the Commission's 2009 public
consultation on future ICT priorities; the Conclusions of the TTE Council of December 2009,
the Europe 2020 consultation and strategy; and the ICT Industry Partnership Contribution
to the Spanish Presidency Digital Europe Strategy:, the own-initiative report of the
European Parliament on 2015.eu and the Declaration agreed at the informal Ministerial
meeting     in    Granada     in     April   2010.     All    these   are     available at:
http://ec.europa.eu/information_society/eeurope/i2010/index_en.htm.

ESPON 2013                                                                              30
the Scandinavian countries having the highest rate of broadband
penetration. North America follows, with South American and Africa slowly
catching up.

In both Europe and Asia, the spread of broadband penetration has been
encouraged by countries who support competition between multiple
companies and the development of better technology. In some cities,
citywide broadband Internet access is provided at low cost, while others
such as San Francisco, California have developed initiatives to provide free
broadband to all citizens.

Conclusion

More needs to be done to ensure the roll-out and take-up of broadband
for all, at increasing speeds, through both fixed and wireless technologies,
and to facilitate investment in the new very fast open and competitive
internet networks that will be the arteries of a future economy. Our action
needs to be focused on providing the right incentives to stimulate private
investment, complemented by carefully targeted public investments,
without re-monopolising our networks, as well as improving spectrum
allocation.

With an increase in affordable technology and competing providers,
broadband Internet is affordable for many consumers, who make the
switch after being frustrated by slow dial up connections. Many
telecommunications companies also try to increase their broadband
penetration by offering it as part of bundled phone, Internet, and/or cable
services. Combining this with low prices makes broadband appeal to low
income subscribers. 70% of Internet subscribers in Western nations were
expected to adopt broadband by 2010.

References

European Commision (2010), A Digital Agenda for Europe. COM(2010)
245 final/2 (available at http://www.espon.eu).

European Commission, (2009), Europe’s Digital Competitiveness Report.
Main achievements of the i2010 strategy 2005‐2009, Brussels

Eurostat (2011), Information Society, Eurostat Regional yearbook 2011.

OECD, (2000), The digital divide:          diffusion   and   use   of   ICTs,
STI/ICCP/IE(2000)9/REV1,OECD,Paris.

ESPON 2013                                                                31
Map 23 Βroadband penetration rate 2006-2009

1.4. Map 24: E-commerce: individuals who ordered
goods or services over the Internet for private use
(percentage of individuals)

Definition of the indicator

The indicator under discussion is derived from Eurostat’s “Individuals who
ordered goods or services over the internet” survey. The survey
population consists of all households having at least one member in the
age group 16 to 74 years and the reference area encompasses EU-
Member States, Candidate countries, Iceland and Norway. Annual time

ESPON 2013                                                             32
You can also read