BIODIVERSITY AND ECOSYSTEM SERVICES FOR THE AMERICAS - The regional assessment report on - IPBES
←
→
Page content transcription
If your browser does not render page correctly, please read the page content below

The regional assessment report on
   BIODIVERSITY AND
ECOSYSTEM SERVICES
 FOR THE AMERICAS
         SUMMARY FOR POLICYMAKERS

                                    1
THE REGIONAL ASSESSMENT REPORT ON BIODIVERSITY AND ECOSYSTEM SERVICES FOR THE AMERICAS

SUMMARY FOR POLICYMAKERS OF THE IPBES REGIONAL ASSESSMENT REPORT ON BIODIVERSITY
AND ECOSYSTEM SERVICES FOR THE AMERICAS
Copyright © 2018, Intergovernmental Science-Policy Platform on Biodiversity and Ecosystem Services (IPBES)

ISBN No: 978-3-947851-01-0

Reproduction                                                                  For further information, please contact:
This publication may be reproduced in whole or in part and in                 Intergovernmental Science-Policy Platform on Biodiversity and
any form for educational or non-profit services without special               Ecosystem Services (IPBES)
permission from the copyright holder, provided acknowledgement                IPBES Secretariat, UN Campus
of the source is made. The IPBES secretariat would appreciate                 Platz der Vereinten Nationen 1, D-53113 Bonn, Germany
receiving a copy of any publication that uses this publication as a           Phone: +49 (0) 228 815 0570
source. No use of this publication may be made for resale or any              Email: secretariat@ipbes.net
other commercial purpose whatsoever without prior permission in               Website: www.ipbes.net
writing from the IPBES secretariat. Applications for such permission,
with a statement of the purpose and extent of the reproduction,               Photo credits
should be addressed to the IPBES secretariat. The use of                      Cover: Shutterstock_L Hoddenbach / Shutterstock_Gooluz /
information from this publication concerning proprietary products for         Shutterstock_M Mecnarowski / IDR_R Matta
publicity or advertising is not permitted.                                    P. 3: IISD_S Wu (Sir R T Watson)
                                                                              P.4-5: UNEP (E Solheim) / UNESCO (A Azoulay) / FAO (J Graziano
Traceable accounts                                                            da Silva) / UNDP (Achim Steiner)
The chapter references enclosed in curly brackets (e.g. {2.3.1,               P.6: INTA GECOM (M E Zaccagnini)
2.3.1.2, 2.3.1.3}) are traceable accounts and refer to sections               P. 8-9: Shutterstock_R De Gustavo
of the chapters of the IPBES Regional Assessment Report on                    P. 11: Mauricio Bedoya-Gaitán
Biodiversity and Ecosystem Services for the Americas. A traceable             P. 13: Mauricio Bedoya-Gaitán
account is a description within the corresponding texts of these              P. 16-17: Mauricio Bedoya-Gaitán
chapters, reflecting the evaluation of the type, amount, quality,             P. 38-39: Mauricio Bedoya-Gaitán
and consistency of evidence and the degree of agreement for that
particular statement or key finding.                                          Technical Support
                                                                              Natalia Valderrama
Disclaimer on maps                                                            Mauricio Bedoya-Gaitán
The designations employed and the presentation of material on the
maps used in this report do not imply the expression of any opinion           Graphic Design
whatsoever on the part of the Intergovernmental Science-Policy                MOABI / Maro Haas, Art direction and layout
Platform on Biodiversity and Ecosystems Services concerning the               Zoo, designers graphiques, Figures design
legal status of any country, territory, city or area or of its authorities,   Yuka Estrada, SPM figures
or concerning the delimitation of its frontiers or boundaries. These
maps have been prepared for the sole purpose of facilitating the
assessment of the broad biogeographical areas represented
therein.

SUGGESTED CITATION:
IPBES (2018): Summary for policymakers of the regional assessment report on biodiversity and ecosystem services for the Americas of
the Intergovernmental Science-Policy Platform on Biodiversity and Ecosystem Services. J. Rice, C.S. Seixas, M.E. Zaccagnini, M. Bedoya-
Gaitán, N. Valderrama, C.B. Anderson, M.T.K. Arroyo, M. Bustamante, J. Cavender-Bares, A. Diaz-de-Leon, S. Fennessy, J. R. García
Márquez, K. Garcia, E.H. Helmer, B. Herrera, B. Klatt, J.P. Ometo, V. Rodríguez Osuna, F.R. Scarano, S. Schill and J. S. Farinaci (eds.).
IPBES secretariat, Bonn, Germany. 41 pages.

MEMBERS OF THE MANAGEMENT COMMITTEE WHO PROVIDED GUIDANCE FOR THE PRODUCTION OF THIS ASSESSMENT:
Brigitte Baptiste, Floyd Homer, Carlos Joly, Rodrigo Medellín (Multidisciplinary Expert Panel), Diego Pacheco, Spencer Thomas, Robert
Watson (Bureau).

This report in the form of a PDF can be viewed and downloaded at www.ipbes.net

2
The regional assessment report on
     BIODIVERSITY AND
 ECOSYSTEM SERVICES
   FOR THE AMERICAS
                                               SUMMARY FOR POLICYMAKERS

                                                                                                           AUTHORS:1
   Jake Rice (co-chair, Canada), Cristiana Simão Seixas (co-chair, Brazil), María Elena Zaccagnini (co-chair, Argentina);
Mauricio Bedoya-Gaitán (IPBES), Natalia Valderrama (IPBES); Christopher B. Anderson (Argentina/USA), Mary
T. K. Arroyo (Chile/New Zealand), Mercedes Bustamante (Brazil), Jeannine Cavender-Bares (USA), Antonio
Diaz-de-Leon (Mexico), Siobhan Fennessy (USA), Jaime Ricardo García Márquez (Colombia/Germany),
Keisha Garcia (Trinidad and Tobago), Eileen H. Helmer (USA), Bernal Herrera (Costa Rica), Brian Klatt (USA),
Jean P. Ometo (Brazil), Vanesa Rodríguez Osuna (Bolivia/USA), Fabio R. Scarano (Brazil), Steven Schill (USA) and
                                                                                       Juliana Sampaio Farinaci (Brazil).

1. Authors are listed with, in parenthesis, their country of citizenship, or countries of citizenship separated by a comma when they
    have several; and, following a slash, their country of affiliation, if different from citizenship, or their organization if they belong to an
    international organization: name of expert (nationality 1, nationality 2/affiliation). The countries or organizations having nominated
                                                                                               these experts are listed on the IPBES website.
FOREWORD

                                                               T
                                                                                he objective of the Intergovernmental
                                                                                Science-Policy Platform on Biodiversity
                                                                                and Ecosystem Services is to provide
                                                                                Governments, the private sector, and
                                                                                civil society with scientifically credible and
                                                                                independent up-to-date assessments of
                                                               available knowledge to make informed decisions at the
                                                               local, regional and international levels.

                                                               This regional and subregional assessment of biodiversity and
                                                               ecosystem services for the Americas has been carried out by
                                                               104 selected experts including 6 early career fellows, assisted
                                                               by 76 contributing authors, primarily from the Americas, who
                                                               have analyzed a large body of knowledge, including about
                                                               4,100 scientific publications. The Report represents the state
The Regional Assessment Report on Biodiversity and             of knowledge on the Americas region and subregions. Its
Ecosystem Services for the Americas produced by the            chapters and their executive summaries were accepted, and
Intergovernmental Science-Policy Platform on Biodiversity      its summary for policymakers was approved, by the Member
and Ecosystem Services (IPBES) provides a critical analysis
                                                               States of IPBES at the sixth session of the IPBES Plenary (18
of the state of knowledge regarding the importance, status,
                                                               to 24 March 2018, Medellín, Colombia).
and trends of biodiversity and nature’s contributions to
people. The assessment analyses the direct and underlying
causes for the observed changes in biodiversity and in         This Report provides a critical assessment of the full range
nature’s contributions to people, and the impact that          of issues facing decision-makers, including the importance,
these changes have on the quality of life of people. The       status, trends and threats to biodiversity and nature’s
assessment, finally, identifies a mix of governance options,   contributions to people, as well as policy and management
policies and management practices that are currently           response options. Establishing the underlying causes of
available to reduce the loss of biodiversity and of nature’s   the loss of biodiversity and of nature’s contributions to
contributions to people in that region.                        people provides policymakers with the information needed
The assessment addresses terrestrial, freshwater, and          to develop appropriate response options, technologies,
coastal biodiversity and covers current status and trends,
                                                               policies, financial incentives and behavior changes. It should
going back in time several decades, and future projections,
                                                               be noted that Greenland as well as the Arctic and sub-
with a focus on the 2020-2050 period.
                                                               Arctic regions were inadequately assessed due to a lack of
The present document, the Summary for Policymakers of          relevant expertise.
the Assessment Report, was approved by the sixth session
of the Plenary of IPBES (Medellín, Colombia, 18-24 March       The Assessment concludes that the Americas are endowed
2018). It is based on a set of chapters which were accepted
                                                               with much greater capacity for nature to contribute to
at this same Plenary session. The chapters are available as
                                                               people’s quality of life than the global average, and that the
document IPBES/6/INF/4/Rev.1 (www.ipbes.net).
                                                               economic value of the terrestrial contributions of nature to
                                                               people is estimated to be at least $24.3 trillion per year,
                                                               equivalent to the region’s gross domestic product. The
                                                               Assessment also concludes that while many aspects of
                                                               the quality of life are improving at regional and subregional

      2
FOREWORD

scales, the majority of the countries in the
Americas are using nature at a rate that exceeds
nature’s ability to renew the contributions it
makes to the quality of life. The Report further
assesses the status of food, water and energy
security. It concludes that while agricultural production,      use of biodiversity in productive sectors. These require
fisheries and aquaculture continue to increase, this is, in     implementation of effective governance processes and
some cases, at the expense of other important aspects           policy instruments.
of nature’s contributions to people; that there is declining
per capita water supply and widespread unsustainable use        We would like to recognize the excellent and dedicated
of surface and groundwater in many parts of the region;         work of the co-chairs, Dr. Jake Rice (Canada), Dr. Cristiana
and that bioenergy production may compete with food             Simão Seixas (Brazil) and Prof. María Elena Zaccagnini
production and natural vegetation, and may have adverse         (Argentina) and of the coordinating lead authors, lead
social, economic and ecological consequences.                   authors, review editors, fellows, contributing authors and
                                                                reviewers, and warmly thank them for their commitment.
The Assessment also found that biodiversity and ecosystem       We would also like to thank Mauricio Bedoya-Gaitan
conditions in the Americas are declining, resulting in a        and Natalia Valderrama, from the technical support unit
reduction of the contributions of nature to the quality         located at the Alexander von Humboldt Institute, Bogota,
of life of people. Indeed, nearly one quarter of species        Colombia, as well as Felice van der Plaat, coordinator of
comprehensively assessed are classified by IUCN as being        the implementation of the regional assessments, because
at high risk of extinction. The indirect drivers of change      without their dedication this Report would not have been
include population and demographic trends, economic             possible. We would also like to thank the Government of
growth and weak governance systems and inequity, while          Colombia for their generous support.
the dominant direct drivers include habitat conversion,
fragmentation and overexploitation/overharvesting. Climate      This Regional Assessment Report provides invaluable
change is recognized as becoming increasingly important,        information for policymakers in the Americas to make
amplifying the other direct drivers.                            informed decisions regarding the conservation and
                                                                sustainable use of biodiversity, the promotion of access to
The Assessment concludes that it is likely that few of the      genetic resources, as well as the fair and equitable sharing
Aichi Biodiversity Targets will be met by the 2020 deadline     of benefits arising from their use. It also provides valuable
for most countries in the Americas, and that continued          information for the ongoing IPBES global assessment, to be
loss of biodiversity could undermine achievement of some        released in May 2019 and is expected to inform discussions
of the Sustainable Development Goals, as well as some           regarding the post-2020 global biodiversity framework under
international climate-related goals, targets and aspirations.   the Convention on Biological Diversity, as well as to inform
                                                                action on implementing the 2030 Agenda for Sustainable
The Report, importantly concludes, that there are options       Development and the Sustainable Development Goals.
and initiatives, some of which ongoing, that can slow
down and reverse ecosystem degradation, and enhance             Sir Robert T. Watson
the provision of nature’s contributions to people, including    Chair of IPBES
an increase in protected areas, ecological restoration,
sustainable land management outside protected areas,            Anne Larigauderie
as well as mainstreaming conservation and sustainable           Executive Secretary of IPBES

                                                                                                                                      3
THE REGIONAL ASSESSMENT REPORT ON BIODIVERSITY AND ECOSYSTEM SERVICES FOR THE AMERICAS

     STATEMENTS FROM
     KEY PARTNERS

                               The Sustainable Development                                      Biodiversity is the living fabric of
                               Goals aim to “leave no one                                       our planet - the source of our
                               behind”. If we don’t protect and                                 present and our future. It is
                     value biodiversity, we will never achieve                       essential to helping us all adapt to the
                     this goal. When we erode biodiversity, we                       changes we face over the coming years.
                     impact food, water, forests and                                 UNESCO, both as a UN partner of IPBES
                     livelihoods. But to tackle any challenge                        and as the host of the IPBES Technical
                     head on, we need to get the science right                       Support Unit on Indigenous and Local
                     and this is why UN Environment is proud                         Knowledge, has always been committed
                     to support this series of assessments.                          to supporting harmony between people
                     Investing in the science of biodiversity                        and nature through its programmes and
                     and indigenous knowledge, means                                 networks. These four regional reports are
                     investing in people and the future we                           critical to understanding the role of
                     want.                                                           human activities in biodiversity loss and
                                                                                     its conservation, and our capacity to
                     Erik Solheim                                                    collectively implementing solutions to
                     Executive Director,
                                                                                     address the challenges ahead.
                     United Nations Environment Programme
                     (UNEP)                                                          Audrey Azoulay
                                                                                     Director-General,
                                                                                     United Nations Educational,
                                                                                     Scientific and Cultural Organization (UNESCO)

4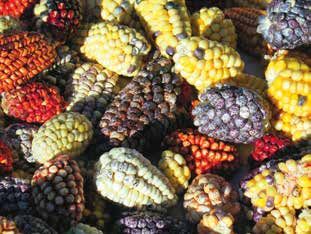
STATEMENTS FROM KEY PARTNERS

          The regional assessments                      Tools like these four regional
          demonstrate once again that                   assessments provide scientific
          biodiversity is among the earth’s             evidence for better decision
most important resources. Biodiversity is     making and a path we can take forward
also key to food security and nutrition.      to achieve the Sustainable Development
The maintenance of biological diversity is    Goals and harness nature’s power for our
important for food production and for the     collective sustainable future. The world
conservation of the ecological                has lost over 130 million hectares of
foundations on which rural livelihoods        rainforests since 1990 and we lose
depend. Biodiversity is under serious         dozens of species every day, pushing the
threat in many regions of the world and it    Earth’s ecological system to its limit.
is time for policy-makers to take action at   Biodiversity and the ecosystem services it
national, regional and global levels.         supports are not only the foundation for
                                              our life on Earth, but critical to the
José Graziano da Silva                        livelihoods and well-being of people
Director-General,
                                              everywhere.
Food and Agriculture Organization of the
United Nations (FAO)                          Achim Steiner
                                              Administrator,
                                              United Nations Development Programme
                                              (UNDP)

                                                                                                               5
THE REGIONAL ASSESSMENT REPORT ON BIODIVERSITY AND ECOSYSTEM SERVICES FOR THE AMERICAS

ACKNOWLEDGEMENTS

T
                 he Americas Assessment would not have
                 been possible without support of many types
                 from numerous sources. The institutional
                 assistance from IPBES was essential
                 for operational and, more importantly,
                 conceptual support leadership. This includes
the Secretariat, particularly Felice van der Plaat, Thomas
Koetz, Hien Ngo, and Anne Larigauderie; our Management
Committee of, Brigitte Baptiste, Marcelo Cabido, Floyd           It is not just Parties that provided enabling support to our
Homer, Carlos Joly, Rodrigo Medellín, Diego Pacheco,             assessment. Every author from Co-Chairs to Coordinating
Spencer Thomas and Bob Watson. Brigitte Baptiste and the         Lead Authors, Lead Authors, Contributing Authors, Fellows
Humboldt Institute deserve special acknowledgement for           and review editors, had time made available for working
providing the facilities and support of the TSU. Our debt to     on this assessment by their “real job”, and the universities,
Brigitte Baptiste and Bob Watson is even greater due to their    government departments, non-governmental groups, and
outstanding leadership while co-chairing the Contact Group       private sector institutions that showed that cooperation are
of IPBES 6. Hein Ngo and Daniela Guarás provided essential       sincerely thanked for their contribution. We received invaluable
technical support for ensuring the contributions of Parties      comments from hundreds of external reviewers. Likewise we
to refining the SMP were accurately captured. Ana María          thank many scientific journals and other publishers for allowing
Hernández, Head of the International Affairs and Policy Office   figures and tables in their publications to be used in the
of the Humboldt Institute was of great support for the TSU.      Americas assessment without paying fees for their use.

The institutional support from IPBES extended well beyond        In the end it is people that made this Assessment possible.
the Secretariat and the Management Committee. IPBES              All the authors took time from family and friends to work on
Task Forces and TSUs provided valuable documents and             this Assessment, and the support of our families and our
led training to help ensure the Assessment could work            communities is sincerely acknowledged. All the authors owe
effectively within the Conceptual Framework. The Values          countless debts to our excellent TSU, Mauricio Bedoya-
Group with Patricia Balvanera and David González; the            Gaitán, Natalia Valderrama and Sergio Andrés Aranguren.
Capacity Building Group with Ivar Baste, Spencer Thomas          Perhaps most of all, however, the Co-Chairs, the CLAs, LAs,
and Carlos Joly; the ILK Group and the organizers of the         CAs, Fellows, RE and TSU members all owe thanks to each
Americas Regional Dialogue, Ingunn Storrø and her team           other. We came to this assessment with different disciplinary
whom developed the Fellows Program; the Scenarios and            expertise, different social and cultural backgrounds, different
Models Group who supported our work continuously. The            worldviews and priorities. This diversity was our greatest
Government of Colombia, as host for the first and third          strength, because the natural diversity, the social and
authors meetings, and the Government of Germany and              economic diversity, and the cultural diversity of the Americas
the IPBES Secretariat, who supported and organized the           all needed to be addressed at an expert level in our work.
second meeting, are all thanked for their assistance.            The diversity was our greatest challenge, as well, because
                                                                 consensus was so often hard to find. We all learned from
IPBES could not function without a broader base of support       each other, and learned in many ways – to integrate both
that its own institutions. The active participation of the       disciplines and knowledge systems that individually we were
Parties to IPBES was essential from the initial nomination of    not used to considering; to accommodate perspectives and
experts to their role in IPBES Plenary 6 and is appreciated,     values with which we were either unfamiliar or distrustful;
with a huge offer of thanks to the disappointingly few Parties   and above all, to appreciate the complexity of the nexus
that have contributed generously to the Trust Fund, without      of equity, justice, human well-being and healthy nature
which none of the regional of Assessments could have             in the 21st century. All of us learned and grew from our
even commenced. We hope that the quality and scope               efforts together – learned new facts but also how to work
of this Assessment and of our other companion Regional           more collaborative and to trust people not just like us. For
Assessments, stimulates many more parties to join them in        this we collectively thank each other for patience and the
giving IPBES the financial support needed to build on the        lessons provided.
foundations we have provided, and allow IPBES to reach its
potential for providing the knowledge foundations without        Jake Rice, Cristiana Simão Seixas
which policies for protecting nature and ensuring the            and María Elena Zaccagnini
contributions of nature to human well-being are realized.        Co-Chairs

6
STATEMENTS FROM KEY PARTNERS

             TABLE OF
            CONTENTS
                                                                                  page 2
                                                                     FOREWORD

                                                                                  page 4
                      STATEMENTS FROM KEY PARTNERS

                                                                                  page 6
                                                 ACKNOWLEDGEMENTS

                                                                                  page 8
                                                              KEY MESSAGES
                                  A. Nature’s contributions to people and quality of life
  B. Trends in biodiversity and nature’s contributions to people affecting quality of life
               C. Drivers of trends in biodiversity and nature’s contributions to people
  D. Future trends in biodiversity and nature’s contributions to people and the global
                                                        goals, targets and aspirations
                                                     E. Management and policy options

                                                                                page 16
                                                                BACKGROUND
                                  A. Nature’s contributions to people and quality of life
  B. Trends in biodiversity and nature’s contributions to people affecting quality of life
               C. Drivers of trends in biodiversity and nature’s contributions to people
D. Future trends in biodiversity and nature’s contributions to people and global goals,
                                                                targets and aspirations
                                      E. Governance, management and policy options

                                                                                page 38
                                                                   APPENDICES
                                                                        APPENDIX 1
                                           Communication of the degree of confidence
                                                                           APPENDIX 2
                                                       Nature’s contributions to people

                                                                                       7
THE REGIONAL ASSESSMENT REPORT ON BIODIVERSITY AND ECOSYSTEM SERVICES FOR THE AMERICAS

8
SUMMARY FOR POLICYMAKERS

     KEY
MESSAGES

                           9
THE REGIONAL ASSESSMENT REPORT ON BIODIVERSITY AND ECOSYSTEM SERVICES FOR THE AMERICAS
KEY
MESSAGES
T
he Americas region is highly biologically and A2 The economic value of terrestrial nature’s
culturally diverse. It hosts 7 out of the 17 most contributions to people in the Americas is estimated
biodiverse countries of the world and spans to be at least $24.3 trillion per year, equivalent to the
from pole to pole, with some of the most region’s gross domestic product. The countries with the
extensive wilderness areas on the planet and greatest land area account for the largest values, while
highly distinctive or irreplaceable species some island States account for the highest values per
composition. The Americas is also a highly culturally and hectare per year. Such differences occur partly because the
socioeconomically diverse region, home to 15 per cent monetary value of specific ecosystem types varies, with
of global languages and a human population density that units of analysis such as coastal areas and rainforests
ranges from 2 per 100 km2 in Greenland to over 9,000 per having particularly high economic values. Difficulties in
km2 in several urban centres. This combination of social, valuation of non-market nature’s contributions to people
economic and ecological heterogeneity makes it challenging make comparative evaluations among subregions or units of
to develop general conclusions that apply uniformly across analysis inconclusive.
all subregions of the Americas.2
A3 The cultural diversity of indigenous peoples and
local communities in the Americas provides a plethora
A. NATURE’S CONTRIBUTIONS TO of knowledge and world views for managing
PEOPLE AND QUALITY OF LIFE3 biodiversity and nature’s contributions to people in a
manner consistent with cultural values promoting the
respectful interaction of people with nature. Major
indigenous and local knowledge systems in the region have
A1 The Americas are endowed with much greater shown their capacity to protect and manage the territories
capacity for nature to contribute to people’s quality of under their particular set of values, technologies and
life than the global average. The Americas contain 40 per practices, even in a globalized world. In addition, the many
cent of the world ecosystems’ capacity to produce cultures that immigrated to the Americas over the past five
nature-based materials consumed by people and to centuries contribute to the diversity of values. This collective
assimilate by-products from their consumption, but only diversity provides many opportunities to develop world
13 per cent of the total global human population. Such views compatible with sustainable uses of and respect for
capacity results in three times more resources provided by nature in a globalized world.
nature per capita in the Americas than are available to an
average global citizen. Those resources contribute in A4 Many aspects of quality of life are improving at
essential ways to food security, water security4 and energy regional and subregional scales. However, the
security, as well as to providing regulating contributions such majority of countries in the Americas are using nature
as pollination, climate regulation and air quality, and more intensively than the global average and
non-material contributions such as physical and mental exceeding nature’s ability to renew the contributions it
health and “cultural continuity”.5 makes to quality of life. The 13 per cent of the global
human population that resides in the Americas produces
22.8 per cent of the global ecological footprint,6 with North
America accounting for 63 per cent of that proportion with
2. See chapters 1 and 3 for more details on where this information was
obtained. only 35.9 per cent of the Americas population. Moreover,
3. See appendix 2 for further information on the concept of nature’s
contributions to people.
6. The definition that follows is for the purpose of this assessment
4. The definition that follows is for the purpose of this assessment only: only: ecological footprint has a variety of definitions, but is defined
water security is used to mean the ability to access sufficient quantities by the Global Footprint Network as “a measure of how much area
of clean water to maintain adequate standards of food and goods of biologically productive land and water an individual, population
production, sanitation and health care and for preserving ecosystems. or activity requires to produce all the resources it consumes and to
5. The definition that follows is for the purpose of this assessment only: absorb the waste it generates, using prevailing technology and resource
cultural continuity is the contribution of nature to the maintenance of management practices”. The ecological footprint indicator is based on
cultures, livelihoods, economies and identities. the Global Footprint Network, unless otherwise specified.
10SUMMARY FOR POLICYMAKERS
the distribution of benefits from the use of many of nature’s widely across subregions and is declining per capita,
contributions to people is uneven among people and and there is widespread unsustainable use of surface
cultures in the Americas such that human well-being, based water and groundwater in many parts of the region.
in whole or in part on nature’s contributions to people, faces Moreover, trends in water quality are decreasing in
threats or shows declines. most watersheds and coastal areas, and dependence
on infrastructure for water provisioning is increasing.
A5 Food security: Agricultural production, fisheries Despite abundance, freshwater supplies can be locally
and aquaculture continue to increase the provision of scarce. This uneven availability, combined with inadequate
food for the region and the planet, but in some cases distribution and waste treatment infrastructure, make water
at the expense of other important aspects of nature’s security a problem for over half the population of the
contributions to people. Unsustainable extensification and Americas, reducing reliable access to a sufficient quality and
intensification to increase food production are causing, quantity of fresh water, with impacts on human health.
respectively, the replacement and degradation of natural
ecosystems that provide multiple material, non-material and A7 Energy security: Energy from nature-based
regulating nature’s contributions to people, sustain many sources, including cultivated biofuels and hydropower,
livelihoods and contribute to many aspects of quality of life, has increased in all the subregions of the Americas.
with less diverse systems producing fewer of nature’s Nevertheless, at the local level, bioenergy production
contributions to people and supporting fewer livelihoods. may compete with food production and natural
Small-scale fisheries, agriculture, livestock husbandry and vegetation and may have social, economic and
agroforestry practised by indigenous peoples and local ecological consequences. Increases in hydropower
communities reflect diversification of sustainable uses of production alter watersheds, with potential consequences
nature and play major roles for food security and health at for aquatic biodiversity, displacement of people, alternative
the local level. Agricultural production builds on a foundation uses of land that is inundated or otherwise altered and for
of the biodiverse American tropics and montane regions, uses of water needed by hydropower facilities.
which are centres of origin for many domesticated plants,
including globally important crops and commodities. A8 Health: The peoples of the Americas benefit from
the availability of food, water, pharmacological
A6 Water security: The Americas are rich in products and interaction with nature for their physical
freshwater resources; however, water supply varies and mental health; nevertheless, many challenges for
11THE REGIONAL ASSESSMENT REPORT ON BIODIVERSITY AND ECOSYSTEM SERVICES FOR THE AMERICAS
health improvement remain. Pharmacological products extinction. The risk of populations or species threatened
from biodiversity hold potential for the development of new with loss or extinction is increasing in terrestrial, coastal,
products with high economic value. Experience with nature marine and freshwater habitats. Of the groups of endemic
contributes to physical and mental health. In tropical areas, species that have been assessed for risk of extinction, more
land-use changes, caused particularly by deforestation, than half of the species in the Caribbean, over 40 per cent in
mining and reservoirs, are among the main causes of Mesoamerica and nearly a quarter in North America and
outbreaks of infectious human diseases and emergence of South America are found to be at high risk. Loss of
new pathogens. Diarrhoea from contaminated water and populations or species can reduce important nature’s
poor sanitation accounts for over 8,000 deaths per year for contributions to water, energy and food security, livelihoods
children under 5 years of age. and economies.
A9 “Cultural continuity”: Indigenous peoples and B3 Biodiversity has increased in some areas through
local communities have created a range of effective management or natural processes in
biodiversity-based systems, such as polyculture and abandoned agricultural areas. Examples include the
agroforestry systems, which has provided livelihoods, increase of Caribbean forest cover and many restored areas
food and health and, through diversification in all subregions and units of analysis.
processes, increased biodiversity and shaped
landscapes. On the other hand, the decoupling of
lifestyles from local habitats and direct degradation of C. DRIVERS OF TRENDS IN
the environment can erode sense of place, language BIODIVERSITY AND NATURE’S
and local ecological knowledge, compromising
CONTRIBUTIONS TO PEOPLE
“cultural continuity”. For example, 61 per cent of the
languages in the Americas, and the cultures associated with
them, are in trouble or dying out. In places throughout the
Americas, indigenous peoples and local communities C1 The most important indirect anthropogenic
continue sustainable agricultural and harvesting practices, drivers of changes in nature, nature’s contributions to
which provide learning opportunities globally. people and quality of life include population and
demographic trends, patterns of economic growth,
weaknesses in the governance systems and inequity.
B. TRENDS IN BIODIVERSITY Economic growth and trade can positively or negatively
AND NATURE’S CONTRIBUTIONS affect biodiversity and nature’s contributions to people.
Currently, on balance, they have an adverse impact on
TO PEOPLE AFFECTING QUALITY
biodiversity and nature’s contributions to people. The
OF LIFE
six-fold increase in gross domestic product since 1960 has
improved many people’s quality of life in a growing
population with increasing wealth and accompanying
B1 Biodiversity and ecosystem conditions in many greater demand for food, water and energy. However,
parts of the Americas are declining, resulting in a meeting these demands has increased pressures on natural
reduction in nature’s contributions to people´s quality resources, with negative consequences for nature, many
of life. In the Americas, 65 per cent of nature’s contributions regulating and non-material nature’s contributions to people,
to people in all units of analysis are declining, with 21 per and quality of life of many people.
cent declining strongly. Wetlands have been highly
transformed in large tracts of the Americas, particularly by C2 In the Americas, ecosystems and biodiversity are
expansion of agriculture, ranching and urbanization. Marine managed under a variety of governance arrangements
biodiversity, especially associated with specific habitats like and social, economic and environmental contexts,
coral reefs and mangroves, has experienced major losses in which makes it complex to disentangle their
recent decades, resulting in declines in the food, livelihoods respective roles in driving past trends in nature and
and “cultural continuity” of coastal people. Alien species, nature’s contributions to people. Although there are
including invasive alien species, are abundant in all major environmental policies and governance approaches
habitats in the Americas, but their impacts on biodiversity, that aim to reduce pressure on nature and nature’s
cultures and economies differ among subregions. contributions to people, they have often not been
effectively coordinated to achieve their objectives.
B2 Close to a quarter of the 14,000 species in Subordination of environment to economics in policy
taxonomic groups comprehensively assessed in the trade-offs and inequities in distribution of benefits from uses
Americas by the International Union for Conservation of nature’s contributions to people continue to be present in
of Nature are classified as being at high risk of all subregions. On average, biodiversity and nature’s
12SUMMARY FOR POLICYMAKERS
contributions to people have been diminishing under the extreme precipitation, causing changes in species
current governance systems in the Americas; however, local distributions and interactions and in ecosystem boundaries.
instances of successful protection or reversal of degradation
of biodiversity show that progress is possible. C5 Many human activities, including the production
and combustion of fossil fuels, are a major source of
C3 Habitat conversion, fragmentation and the pollution that adversely impacts most terrestrial
overexploitation/overharvesting are the greatest direct and marine ecosystems. Air pollution may cause
drivers of loss of biodiversity, loss of ecosystem significant adverse effects on biodiversity. Ocean
functions and decrease of nature’s contributions to acidification from increased atmospheric carbon dioxide is
people from local to regional scales in all biomes. increasing, affecting key marine species and major
Habitat degradation due to land conversion and components of ocean food webs, and with other stressors
agricultural intensification; wetland drainage and (e.g., deoxygenation in the upper water column due to
conversion; urbanization and other new infrastructure; nutrient run-off, and warmer temperatures) likely contributing
and resource extraction are the largest direct threats to a Caribbean-wide flattening of coral reefs.
to nature’s contributions to people and biodiversity in
the Americas. The resulting changes in terrestrial,
freshwater and marine environments may be interrelated D. FUTURE TRENDS IN
and often lead to changes in biogeochemical cycles, BIODIVERSITY AND NATURE’S
pollution and eutrophication of ecosystems, and biological
CONTRIBUTIONS TO PEOPLE AND
invasions. Intensified, high-input agricultural production
THE GLOBAL GOALS, TARGETS
contributes to food and energy security, but in many cases,
has resulted in nutrient imbalances and introduced pesticide
AND ASPIRATIONS
residues and other agrochemicals into ecosystems,
threatening biodiversity and nature’s contributions to people
and health in all subregions. D1 Key drivers of trends in biodiversity and nature’s
contributions to people are expected to intensify into
C4 Human-induced climate change is becoming an the future, increasing the need for improved policy
increasingly important direct driver, amplifying the and governance effectiveness if biodiversity and
impacts of other drivers (i.e., habitat degradation, nature’s contributions to people are to be maintained.
pollution, invasive species and overexploitation)
through changes in temperature, precipitation and the By 2050, the population of the Americas is projected
nature of some extreme events. Regional changes in to increase by 20 per cent to 1.2 billion and the gross
temperature of the atmosphere and the ocean will be domestic product to nearly double, with concomitant
accompanied by changes in glacial extent, rainfall, river increases in consumption.
discharge, wind and ocean currents and sea level, among
many other environmental features, which, on balance, have Unsustainable agricultural practices and climate change
had adverse impacts on biodiversity and nature’s are projected to be major drivers of further degradation
contributions to people. The majority of ecosystems in the of most terrestrial, freshwater and coastal ecosystems.
Americas have already experienced increased mean and
extreme temperatures and/or, in some places, mean and
13THE REGIONAL ASSESSMENT REPORT ON BIODIVERSITY AND ECOSYSTEM SERVICES FOR THE AMERICAS
Multiple drivers are projected to intensify and interact, Protected and restored areas contribute to
often in synergistic ways, further increasing biodiversity nature’s contributions to people but are likely
loss, reducing ecosystems’ resilience and the provision to continue to comprise a minority of the land
of present levels of nature’s contributions to people. and sea of the Americas, so sustainable use and
management outside protected areas remains a
D2 Pressure on nature is projected to increase more priority. Diverse, more integrative strategies, from the
slowly, or even be reduced in some subregions, under holistic approaches of many indigenous peoples and
the transition pathways to sustainability scenarios by local communities to the ecosystem-based approaches
2050 (Box SPM.1), while it is projected to increase developed for sectorial management, can be effective
under the business-as-usual scenario. Of many possible when appropriately implemented. Strategies for making
pathways, the three examined in this report project a human-dominated landscapes (e.g., agricultural
reduction of biodiversity loss in all the subregions compared landscapes and cities) supportive of biodiversity and
to the projected loss under the business-as-usual scenario. nature’s contributions to people (e.g., multifunctional,
diversified landscapes and agroecological systems) are
D3 For most countries, global environmental goals, essential if biodiversity and nature’s contributions to
targets and aspirations are uncoupled from national people are to be protected and enhanced where they
policies. Biodiversity and nature’s contributions to have been degraded.
people are diminishing in many regions of the
Americas. It is likely that few of the Aichi Biodiversity E2 Policy interventions can be more effective when
Targets will be met by the 2020 deadline for most countries they take into account causal interactions between
in the Americas, in part because of policy choices and distant places and leakage and spillover effects7 at
trade-offs with negative impacts on aspects of biodiversity. many levels and scales across the region. Additionally,
Continued loss of biodiversity could undermine the the causes of many threats to biodiversity and nature’s
achievement of some of the Sustainable Development contributions to people are inherently beyond national
Goals, as well as some international climate-related goals, borders and may be most effectively addressed through
targets and aspirations. bilateral and multilateral agreements.
E3 Mainstreaming conservation and sustainable use
E. MANAGEMENT AND POLICY of biodiversity in productive sectors is extremely
OPTIONS important for the enhancement of nature’s
contributions to people. However, for most countries of
the region, the environment has been mostly dealt with as a
separate sector in national planning, and has not been
E1 There are options and initiatives that can slow effectively mainstreamed across development sectors.
down and reverse ecosystem degradation in the Mechanisms for integrating biodiversity policies into
Americas; however, most ecosystems in the Americas agencies with jurisdiction over pressures on biodiversity
continue to be degraded. would promote better policies. Policies and measures to
achieve conservation and sustainable use outcomes are
An increase in protected areas by most countries most effective when coherent and integrated across sectors.
is contributing to maintaining options for the A broad array of policy instruments, such as payment for
future. Protection of key biodiversity areas increased ecosystem services, rights-based instruments and voluntary
17 per cent from 1970 to 2010, yet fewer than 20 per eco-certification, can be used by a range of actors to better
cent of key biodiversity areas are protected. Coverage mainstream biodiversity and nature’s contributions to people
of marine protected areas is smaller than for their into policy and management.
terrestrial counterparts in all the subregions except
North America. Sustainable land use systems of E4 Implementation of effective governance
indigenous peoples and local communities has proven a processes and policy instruments can address
powerful instrument for protecting nature. biodiversity conservation and enhanced provision for
nature’s contributions to people. However, the
Ecological restoration is having positive effects increasingly broad array of policy instruments used by a
at local scales, often speeding up ecosystem range of actors to support the management of biodiversity
recovery and improving the ability of such areas to and nature’s contributions to people and to avoid or mitigate
provide nature’s contributions to people. However, impacts on the different ecosystems have not added up to
initial costs can be significant, and non-material
7. The definition that follows is for the purpose of this assessment
contributions may not be restored for some people. only: leakage and spillover effects can be defined as environmentally
damaging activities relocated elsewhere after being stopped locally.
14SUMMARY FOR POLICYMAKERS
overall effectiveness at the national or subregional scales,
although they are often effective locally. Implementation of
public policies is most effective with, inter alia, appropriate
combinations of behavioural change, improved technology,
effective governance arrangements, education and
awareness programmes, scientific research, monitoring and
evaluation, adequate finance arrangements, and supporting
documentation and capacity-building. Behavioural changes
may be needed from individuals, communities, business and
governments. Factors to promote conservation and
sustainable use of biodiversity and nature’s contributions to
people can be aided by enabling governance arrangements,
including partnerships and participatory deliberative
processes, and recognition of the rights of indigenous
peoples, local communities and people in vulnerable
situations, in accordance with national legislation.
E5 Knowledge gaps were identified in all chapters.
The assessment was hampered by the limited information
(a) on the impact of nature’s contributions to people to
quality of life, in particular because there is a mismatch
between social data related to quality of life produced at the
political scale and ecological data produced at a biome
scale; (b) on nature’s non-material contributions to people
that contribute to quality of life; (c) for assessing the linkages
between indirect and direct drivers and between the drivers
and specific changes in biodiversity and nature’s
contributions to people; and (d) on the factors that affect the
ability to generalize and scale the results of individual studies
up or down.
15THE REGIONAL ASSESSMENT REPORT ON BIODIVERSITY AND ECOSYSTEM SERVICES FOR THE AMERICAS 16
SUMMARY FOR POLICYMAKERS

 BACK-
GROUND

                       17
THE REGIONAL ASSESSMENT REPORT ON BIODIVERSITY AND ECOSYSTEM SERVICES FOR THE AMERICAS
BACKGROUND
Figure SPM 1 Subregions of the Americas assessment. Source: Adapted from a map available
at Natural Earth, http://www.naturalearthdata.com/
Caribbean
Mesoamerica
North America
South America
The Americas
Subregions region (Figure SPM.1)
of Americas is highly
assessment (established but incomplete) {3.2.2.2; Table 3.1}, in addition
biologically diverse, hosts 7 out of the 17 most to over one third of the world´s freshwater fish fauna,
Caribbean
biodiverse countries of the world and encompasses consisting of over 5,000 species (well established) {3.2.3.1}.
Mesoamerica
14 units of analysis (Figure SPM.2) across 140 Conservatively, 33 per cent of the plants used by humans
North America
degrees of latitude (well established) {1.1, 1.6.1}. The are found in the Americas (well established) {3.2.2.2}.
Americas include
South55 of the 195 terrestrial and freshwater
America
world ecoregions with highly distinctive or irreplaceable The Americas is a highly culturally and socioeconomically
species composition. The region hosts 20 per cent of diverse region (well established). It is populated by over
globally identified key biodiversity areas, 26 per cent of 66 million indigenous people whose cultures have persisted
globally identified terrestrial biodiversity conservation in all subregions and, in addition, by an exceptionally
hotspots and three of the six longest coral reefs. In large proportion of new immigrants and descendants of
addition, the Gulf of California and the Western Caribbean immigrants, mainly from Europe, Asia and Africa (established
are included in the top 18 key marine biodiversity but incomplete) {2.1.1, 2.1.2, 2.3.5, 2.5}. The Americas
conservation hotspots {1.1, 3.2}. The region has some of are home to 15 per cent of global languages {2.1.1}. The
the most extensive wilderness areas on the planet, such human population density in the Americas ranges from 2
as the Pacific Northwest, the Amazon and Patagonia. per 100 km2 in Greenland to over 9,000 per km2 in several
The Páramo and Amazonian forests, respectively, are the urban centres {1.6.3}. Socioeconomically, the region
richest tropical alpine area and tropical wet forests in the contains 2 of the 10 countries with the highest Human
world (well established) {3.4.1.1, 3.4.1.5}. Around 29 per Development Index, as well as 1 of the 30 countries with the
cent of the world´s seed plants, 35 per cent of mammals, lowest Human Development Index (well established) {1.6.3}.
35 per cent of reptiles, 41 per cent of birds and 51 per Such heterogeneity makes it difficult to develop general
cent of amphibians are found in the Americas, totalling conclusions that apply uniformly across all subregions.
over 122,000 species for those species groups alone
18SUMMARY FOR POLICYMAKERS
A. Nature’s contributions
to people and quality of life
Figure SPM 2 Units of Analysis of the Americas assessment. Source: Adapted from Olson et
al. (2001), World Wildlife Fund (2004 and 2012), and Marine Regions (2016).9
UNITS OF ANALYSIS
Tundra and high moutain habitats
Cryosphere
Drylands and deserts
Mediterranean forests,
woodlands and scrub
Temperate and boreal forests and
woodlands
Temperate grasslands
Tropical and subtropical
dry forests
Tropical and subtropical
moist forests
Tropical and subtropical savannas
and grasslands
Inland surface waters and water
bodies / freshwater
Marine / deepwater / offshore
systems
Coastal habitats / coastal
and near shore marine / inshore
ecosystems
Although the high “biocapacity”8 of the Americas have been net gains in North America (0.4 per cent) and
means that nature has an exceptional ability to the Caribbean (43.4 per cent) {4.4.1} (Figure SPM.3). The
contribute to people’s quality of life (well established) ecological footprint of the Americas has increased two- to
{2.6; Table 2.24}, the links between “biocapacity” and threefold in each subregion since the 1960s. This trend has
the real availability of individual nature’s contributions become attenuated in recent decades for North America,
to people are not fully established (see appendix 2). Mesoamerica and the Caribbean, but continues to increase
The relatively high average per capita availability of natural in South America (Figure SPM.4), and the patterns vary
biological resources does not ensure their equitable significantly among subregions {2.6; Table 2.24} and units
availability or prevent resource shortages at a given time or of analysis {4.3.2} (well established). In all subregions, there
place or within a given socioeconomic stratum {2.5, 2.6; are cultures and lifestyles that are achieving sustainable
Figure 2.36; Table 2.24}. management of natural resources towards a good quality of
life {5.4.7, 5.4.11}. However, the aggregate ecological footprint
The disproportionate and unsustainable use of of the Americas remains unsustainable and continues to grow
“biocapacity” in the Americas has increased steadily in (established but incomplete) {2.1.1, 2.6, 5.5}.
recent decades (well established) {2.6; Table 2.25}. Since
the 1960s, renewable fresh water available per person has Differences in economic development attained
decreased by 50 per cent {2.2.10; Figure 2.19}, land devoted within and among countries of the Americas and
to agriculture has increased by 13 per cent {4.4.1}. Since
9. Olson, D. M., E. Dinerstein, E.D. Wikramanayake, N.D. Burgess, G.V.
1990, forest areas have continued to be lost in South America Powell, E.C. Underwood, J.A. D’Amico, I. Itoua, H.E. Strand, and J.C.
(9.5 per cent) and Mesoamerica (25 per cent), although there Morrison (2001). Terrestrial Ecoregions of the World: A New Map of
Life on Earth: A new global map of terrestrial ecoregions provides an
innovative tool for conserving biodiversity. BioScience, 51, 933-938.
8. The definition that follows is for the purpose of this assessment only: https://doi.org/10.1641/0006-3568(2001)051[0933:TEOTWA]2.0.CO;2.
“biocapacity” has a variety of definitions, but is defined by the Global World Wildlife Fund (2004). Global Lakes and Wetlands Database.
Footprint Network as “the ecosystem’s capacity to produce biological Retrieved from https://www.worldwildlife.org/pages/global-lakes-and-
materials used by people and to absorb waste material generated wetlands-database. World Wildlife Fund (2012) Terrestrial Ecoregions of
by humans, under current management schemes and extraction the World. Retrieved from https://www.worldwildlife.org/publications/
technologies”. The “biocapacity” indicator used in the present report is terrestrial-ecoregions-of-the-world. Marine Regions (2016). Marine
based on the Global Footprint Network, unless otherwise specified. Regions. Retrieved from http://www.marineregions.org.
19THE REGIONAL ASSESSMENT REPORT ON BIODIVERSITY AND ECOSYSTEM SERVICES FOR THE AMERICAS
Figure SPM 3 Total forest cover trends by subregions. Source: Food and Agriculture Organization
of the United Nations (2015).10
60
FOREST AREA AS A PROPORTION OF TOTAL
50 SUBREGION
Caribbean
40 Mesoamerica
LAND AREA (%)
North America
30 South America
20
10
0
1990 1995 2000 2005 2010 2015
YEAR
variation in countries’ ecological footprint associated replacement of natural ecosystems. This has resulted in the
with their pursuit of development pose challenges reduction of many types of nature’s contributions to people
to an equitable and sustainable use of nature (well and in changes to the distribution of economic benefits and
established). In some areas of all subregions, social livelihoods (well established) {2.5, 2.7}. In places throughout
inequity in distribution of benefits from uses of and access the Americas, indigenous peoples and local communities
to nature’s contributions to people continues to be an continue sustainable agricultural and harvesting practices,
important concern (established but incomplete) {2.5, which provide learning opportunities globally. While this
4.3}. Although overall poverty rates have decreased in contributes a small volume to the Americas’ share of global
the last 20 years, large numbers of people, particularly trade, it can be critical for local and national food security
in Mesoamerica, the Caribbean and South America, are and livelihoods {2.2.1, 2.3.1, 2.4, 2.5, 2.6}. All scales of
still vulnerable {4.3}. The increasing global demand for agriculture have benefited from domestication of plants
food, water and energy security increases consumption from tropical and montane areas of the Americas (well
and intensifies the ecological footprint of the Americas established) {1.1, 2.2.1, 2.4, 3.3.3}. Marine fish harvests
{2.3.2, 2.3.5, 4.3.2} (Figure SPM.4). This intensification, have peaked in all subregions and are decreasing as stocks
when based on unsustainable practices, has had negative decline11 or management reduces harvest rates, while
consequences for nature, with adverse implications for freshwater-capture fish production has increased slightly
nature’s contributions to people (Figure SPM.5) and quality and the contribution of aquaculture grew from 3 per cent of
of life, and for availability of future options (well established) total fish production in 1990 to 17 per cent in 2014 {4.4.5}.
{2.3.5, 3.2.3, 3.3.5, 3.4, 4.4.1, 4.4.2, 5.5}.
In addition to export of food commodities, the
In the Americas, increases in the uses of nature have Americas have a large commerce of timber and fibre
resulted in the region being the largest global exporter from plants and animals (well established). Although
of food and one of the largest traders in bioenergy timber and fibre production have increased significantly
(well established). Agricultural and livestock production in over the last several decades, they have begun to slow and
the Americas, which is critical to providing food for both the are expected to continue to decrease as new technologies
region and the rest of the world, continues to increase, albeit and production substitutes emerge and supplies of
with subregional differences {1.2.3, 3.2.1, 3.3.5}. Except in timber continue to decrease (well established) {2.2.2,
the Caribbean, crop production in the Americas more than 4.3.4}. However, there are cases where overall reduction
doubled between 1961 and 2013 due to extensification and in hardwood harvest has not reduced pressure on some
intensification of large-scale agriculture {2.2.2.1, 2.3.5} and valuable species {4.4.5}, and since 2000, coniferous
production has increased in South America {2.2.2}.
10. Food and Agriculture Organization of the United Nations (2015). Global
Forest Resources Assessment 2015. Retrieved from www.fao.org/
forest-resources-assessment/en. Visual prepared on November 21,
2017, by the IPBES task group on indicators and the technical support 11. Stocks may decline for many reasons, including overfishing, climate
unit based on raw data provided by indicator holder. change, pollution and disturbance of habitats.
20You can also read