Air pollution and its effects on lichens, bryophytes, and lichen-feeding Lepidoptera: review and evidence from biological records
←
→
Page content transcription
If your browser does not render page correctly, please read the page content below
Biological Journal of the Linnean Society, 2015, 115, 611–635. With 9 figures.

Air pollution and its effects on lichens, bryophytes, and
lichen-feeding Lepidoptera: review and evidence from
biological records
OLIVER L. PESCOTT1*, JANET M. SIMKIN2, TOM A. AUGUST1, ZOE RANDLE3,
ANTHONY J. DORE4 and MARC S. BOTHAM1
1
 Centre for Ecology & Hydrology, Maclean Building, Benson Lane, Crowmarsh Gifford, Wallingford,
Oxfordshire OX10 8BB, UK
2
 Department of Life Sciences, Natural History Museum, The British Lichen Society, c/o Lichen
Herbarium, Cromwell Road, London SW7 5BD, UK
3
 Butterfly Conservation, Wareham, Dorset BH20 5QP, UK
4
 Centre for Ecology & Hydrology, Bush Estate, Penicuik, Midlothian EH26 0QB, UK

Received 12 January 2015; revised 24 February 2015; accepted for publication 27 February 2015

Changing air quality has been one of the most important drivers of change for bryophytes and lichens in Britain
and Ireland over the 20th Century, with acidic pollutants such as sulphur dioxide having large effects on the ranges
and abundances of many species. At the same time, expert amateur and professional naturalists have put
enormous efforts into recording the distributions of species within these groups. These efforts have provided much
evidence for declines and recoveries within the bryophytes and lichens, with species distribution data being linked
to airborne pollutants in many different ways. We provide a broad overview of some of the changes that have
occurred in affected species, using biological records collected by national recording schemes to illustrate the
various effects of air pollution; we also review the direct and indirect impacts of air pollutants on these groups.
Environmental change affecting one group of species is also likely to cascade to other groups where trophic or other
relationships exist between them. Using data from the volunteer-based National Moth Recording Scheme, we
provide the first evidence for an indirect association between reductions in air pollution and increases in
lichenivorous moths. © 2015 The Linnean Society of London, Biological Journal of the Linnean Society, 2015, 115,
611–635.
ADDITIONAL KEYWORDS: acidification – ammonia – bioindicators – citizen science – cryptogam –
environmental change – nitrogen oxides – sulphur dioxide.

      AIR POLLUTION: A SHORT REVIEW                               on human health, particularly in the poorest areas of
                                                                  the world (Hill, 2010; UNEP, 2012); others, including
Across the globe, both the extent and the impacts of
                                                                  nitrogen and sulphur deposition, impact ecosystem
air pollution are highly variable (Hill, 2010). For some
                                                                  functioning, and may interact with physical changes,
pollutants in some areas, the outlook is not positive,
                                                                  such as the warming of the Earth’s climate, to exac-
and many currently detrimental trends are predicted
                                                                  erbate these effects (Millennium Ecosystem Assess-
to continue or worsen (UNEP, 2007, 2012). These
                                                                  ment, 2005). The present review focuses on the
impacts are also spread unevenly across species and
                                                                  impacts of a subset of air pollutants that have had, or
ecosystems. Many pollutants, such as particulate
                                                                  are having, large impacts on the populations of liche-
matter, heavy metals, and ozone, have severe impacts
                                                                  nized fungi, bryophytes, and associated Lepidoptera
                                                                  in Britain since the Industrial Revolution.
                                                                    The air pollutants that are addressed in the present
*Corresponding author. E-mail: olipes@ceh.ac.uk                   review are sulphur dioxide (SO2), nitrogen oxides

© 2015 The Linnean Society of London, Biological Journal of the Linnean Society, 2015, 115, 611–635                 611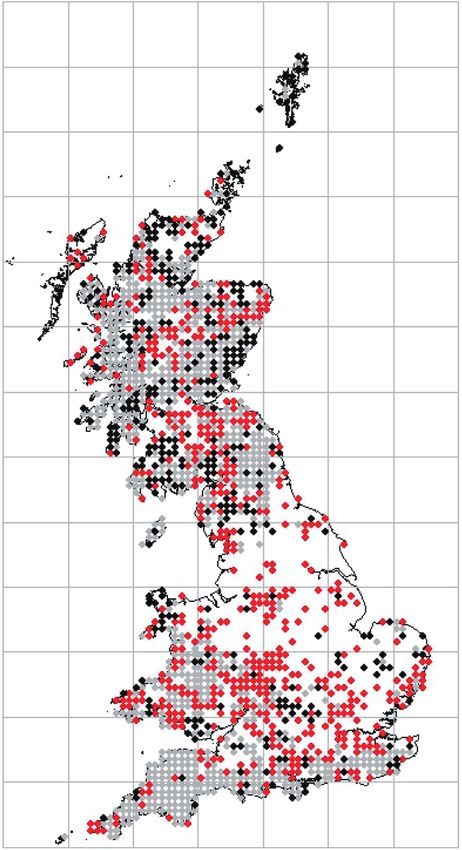
612    O. L. PESCOTT ET AL.

(NOx) and ammonia (NH3); the UK has committed to               of pollutants such as SO2 in the UK, and the ongoing
reducing its emissions of all these pollutants under           recovery from these, may therefore be of use for the
the European Union (EU) National Emissions Ceiling             development of biological indicators of air pollution in
Directive (Directive 2001/81/EC) and the 1999                  the developing world (Nimis, Scheidegger & Wolseley,
‘Gothenburg Protocol’, which also currently includes           2002), and for a more general understanding of the
several European non-EU member states, Canada                  changes that naturalists and ecologists in those coun-
and the USA (http://www.unece.org/env/lrtap/). In the          tries may be seeing in their natural environment, as
UK, emissions of these pollutants have been declining          well as being a fascinating and positive story of envi-
(Fig. 1), although this is not the case for most devel-        ronmental improvement in the UK. To more thor-
oping countries (UNEP, 2012). The historical impacts           oughly understand the past and future biological

                            A)

                             B)

Figure 1. A, relative national trends in three air pollutants; data from Defra (2013). NOx and SO2 trends are relative to
1970; the NH3 trend is relative to 1980. B, historic SO2 trend in an urban centre (Westminster, London), redrawn from
data presented in Rose & Hawksworth (1981).

                         © 2015 The Linnean Society of London, Biological Journal of the Linnean Society, 2015, 115, 611–635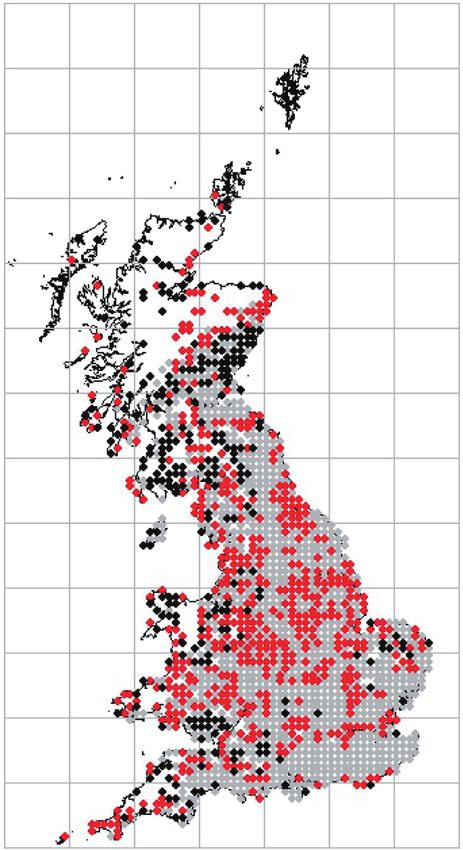
LICHENS, BRYOPHYTES, MOTHS AND AIR QUALITY                     613

impacts of the air pollutants under scrutiny, a brief           were road transport (350 000 tonnes; approximately
review of their physical forms, atmospheric chemistry,          34%) and energy production (315 000 tonnes; approxi-
and emission sources is provided.                               mately 30%) (Defra, 2013). As will be noted from the
                                                                above, many of the biological impacts of NOx are
                                                                shared with SO2 (Hill, 2010), a point that should be
                           SO2                                  borne in mind when using information on their preva-
An acidic, corrosive gas that is a major air pollutant          lence in correlative ecological analyses. Despite a
around the world; historically, it has been, along with         large decline in NOx emissions in the UK overall
particulate matter, the main component of air pollu-            (Fig. 1A) (Defra, 2013), roadside monitoring of the
tion as a result of the burning of fossil fuels (WHO,           levels of NO2 in London and other cities indicates that
2006). In the atmosphere, the gas SO2 is oxidized,              there has been little decline in the emissions in the
through the intermediate sulphite ion stage (SO3−2), to         urban environment over the recent past (UNEP, 2007;
produce liquid sulphuric acid (H2SO4) and solid sul-            Stedman & Grice, 2009; GLA, 2010). For example, the
phate (SO4−2) aerosols, the latter often through reac-          World Health Organization’s limit value for harmful
tion with ammonia gas (NH3). It is these compounds              effects on human health (40 μg m−3; WHO, 2006) is
that produce the acidifying effects of SO2; these may           still regularly exceeded in these environments in the
be realized through washout in rain (wet deposition),           UK (RoTAP, 2012).
or through direct, dry deposition onto surfaces (Hill,
2010). The aerial lifetime of the gas SO2 is estimated
to be only of the order of a day; however, sulphuric                                        NH3
acid and sulphate have much longer residence times              Gaseous ammonia has a relatively short residence
in the atmosphere, and it is these compounds that               time in the atmosphere of the order of days (UNEP,
produce many of the impacts on ecosystems and                   2007) but, as with SO2 and NOx, it undergoes reac-
species through acidic deposition (Hill, 2010).                 tions yielding a more stable ion (ammonium, NH4+)
Sulphites can also be highly toxic to many                      that can form an aerosol. Reduced nitrogen can be
cryptogamic (i.e. nonflowering) species (Lee &                  deposited in wet or dry forms, although the dry depo-
Studholme, 1992), although these ions may largely be            sition of reduced nitrogen is mostly in the gaseous
generated on or within plants or lichens from depos-            form, with ammonium aerosol deposition making a
ited SO2. The main sources of SO2 in the UK in 2012             smaller contribution. Emissions of ammonia are
were from burning in energy production and trans-               dominated by the agricultural sector in the UK, par-
formation (66%), followed by combustion in manufac-             ticularly the management of manure (RoTAP, 2012);
turing industries (14%; Defra, 2013; Salisbury et al.,          however, the contribution of agriculture to total emis-
2014; http://naei.defra.gov.uk/reports); the massive            sions of NH3 has fallen slightly in recent years, from
reduction in UK emissions from 1970 (6.37 million               89% in 2010 to 82% in 2012 (Fig. 1A) (RoTAP, 2012;
tonnes) to 2012 (0.43 million tonnes; displayed in              Defra, 2013). This is reported to be a result of reduc-
relative terms in Fig. 1A) has mainly been driven by            tions in cattle numbers and more efficient fertilizer
a change in fuel use from coal to gas, and by the               use (Defra, 2013). Because NH3 is primarily emitted
fitting of flue gas desulphurization units in the power         from diffuse sources, there is typically more uncer-
industry (Defra, 2013).                                         tainty around the measurement of emissions than for
                                                                SO2 or NOx; however, the available data indicate that
                                                                UK emissions peaked in the early 1980s, and have
                           NOx                                  decreased by approximately 20% subsequently
The chemical symbol NOx represents the nitrogen                 (RoTAP, 2012; Defra, 2013). Point sources from pig
oxides, a group of gases of which the most important            and poultry farms can still have considerable impacts
here are nitric oxide (NO) and nitrogen dioxide (NO2);          on biodiversity locally (Leith et al., 2005) and, at the
NO is converted rapidly into NO2 on exposure to air.            landscape scale, there is much concern that many
Nitrogen oxides can also be converted into nitrate              ecosystems continue to be adversely affected across
(NO3−) and nitric acid (HNO3) in the atmosphere,                the UK (Leith et al., 2005).
again forming aerosols that are significant compo-                 Other air pollutants of high importance globally
nents of acid deposition (RoTAP, 2012). Both nitrate            include ground-level (tropospheric) ozone and fine
and nitric acid can also contribute to the eutrophica-          particulate matter (Hill, 2010). Aerosols of all of the
tion of certain sensitive habitats (RoTAP, 2012). As            pollutants described above can contribute to particu-
with oxides of sulphur, these derived aerosols of NOx           late matter pollution of different sizes, which often
have longer residence times in the atmosphere than              present severe problems for human health (WHO,
their precursor gases (UNEP, 2007). The two major               2006). However, from a biodiversity impacts point
sources of nitrogen oxides in the UK in 2011 and 2012           of view, large particles of the air pollutants under

© 2015 The Linnean Society of London, Biological Journal of the Linnean Society, 2015, 115, 611–635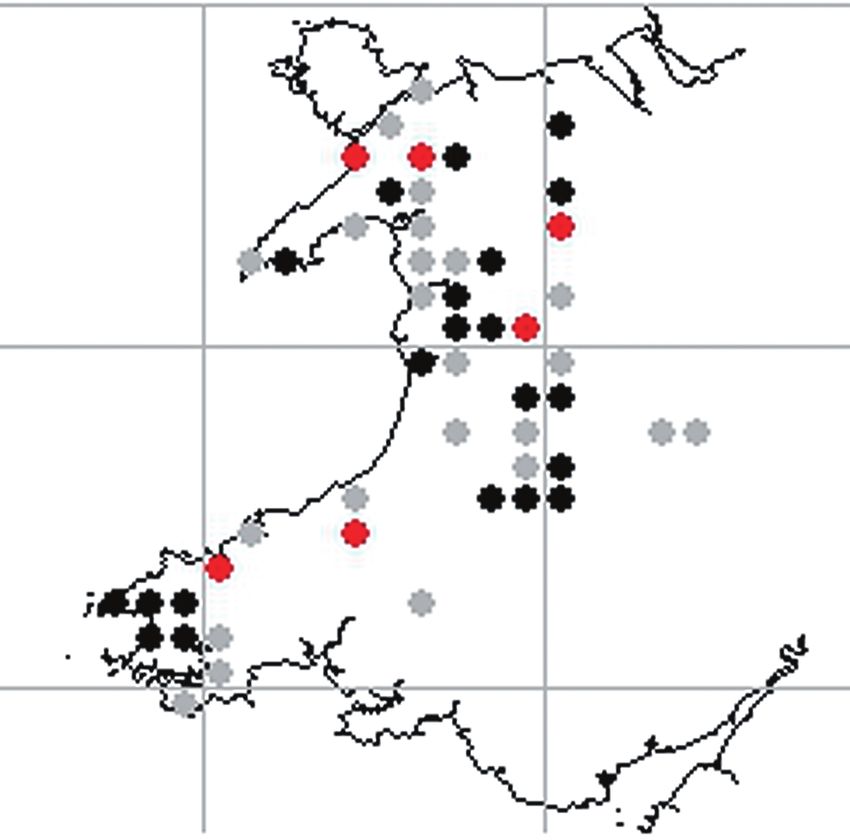
614    O. L. PESCOTT ET AL.

discussion in the present review are typically                these remind us of the pervasive presence of heavy air
included as part of the phenomenon of dry deposition.         pollution in parts of Britain at that time.
Other pollutants not discussed here, such as metals              Forty years later, the accumulation of historic
or organic chemicals, can also contribute to particu-         and contemporary species’ distributional data from
late matter pollution, and these may also have                amateur and professional naturalists is yielding
their own impacts on specific taxa (e.g. Bargagli &           many new opportunities for the study of trends in the
Mikhailova, 2002). Ground-level ozone is another              abundance and frequency of species in different
serious component of air pollution with considerable          groups, and allowing us to relate these to changes in
effects on human health (WHO, 2006); the impacts of           the wider environment (Roy et al., 2014; Pocock et al.,
this pollutant on crop yields are well understood (van        2015). This legacy of ‘citizen scientist’-led natural
Dingenen et al., 2009) but wider biodiversity impacts         history in Britain and Ireland, and the wealth of
have not been as well investigated as they have               resulting data, has been complemented by a long
for sulphur and nitrogen compounds (Davison &                 tradition of inference from maps (Preston, 2013),
Barnes, 1998; Ashmore, 2005), although some evi-              with, older, largely descriptive approaches to environ-
dence for impacts on lichens and bryophytes has been          mental change being supplemented over the past 20
reported (Bates, 2000; Bell & Treshow, 2002). Nitro-          years with new methods designed to model potential
gen oxides are important precursors of ground-level           biases in biological records datasets (Prendergast
ozone (Hill, 2010), which may make it hard to sepa-           et al., 1993; Isaac et al., 2014). The present review
rate NOx impacts from ozone impacts in some study             provides a broad overview of the evidence for air
systems.                                                      pollutant effects on lichens, bryophytes, and lichen-
                                                              feeding Lepidoptera contained within biological
                                                              records, presents original supporting analyses, and
ENVIRONMENTAL     POLLUTION, NATURAL HISTORY, AND             brings this information together with experimental
                PUBLIC ENGAGEMENT                             findings on direct and indirect impacts for lichens and
Alongside the increasing monitoring and knowledge             bryophytes. Although it is recognized that lichens and
of pollutants and their impacts during the 20th               bryophytes are very different types of cryptogamic
Century, the early public face of ecology was coloured        organisms, we treat them here together because they
strongly by pollution-related issues (Carson, 1962;           comprise ‘pocket-sized autotrophs that occupy similar
Mabey, 1974). The hugely influential advocacy of              habitats’ (Bates, 2002), following the lead of many
Carson’s Silent Spring (1962) was followed in Britain         other studies (During, 1992).
by Mellanby’s New Naturalist title Pesticides and
Pollution, which was also aimed at raising the aware-
ness of the wider reading public (Mellanby, 1967).                    EFFECTS OF AIR POLLUTION ON
Kenneth Mellanby was subsequently instrumental in
                                                                        LICHENS, BRYOPHYTES, AND
the organization of a successful citizen science initia-
                                                                      LICHEN-FEEDING LEPIDOPTERA
tive, a survey of water pollution in Britain conducted
by approximately 8000 school children (Mellanby,                                  LICHENS
1974). This project was part of a larger initiative           Evidence from biological records over time
organized by the Cambridge-based Advisory Centre              Lichens are perhaps best known amongst ecologists
for Education, the Nature Conservancy, and the                and naturalists for their value as indicators of various
Sunday Times newspaper (Mabey, 1974). As well as              types of pollution (Nimis et al., 2002). This indicator
water pollution, the project featured several surveys         value will be species and pollutant dependent (Nash,
of air pollution. This included a lichen-mapping exer-        2008), and a very large amount of research effort
cise, again carried out by young people, resulting in         amongst lichenologists has been dedicated to explor-
an impressive national map of SO2 pollution levels            ing these relationships (Bates, 2002). The first obser-
(Gilbert, 1974). The writings of Mellanby (1967) and          vation of air pollution impacts on lichens has been
Mabey (1974) recall a time when heavy pollution of            attributed on several occasions to Erasmus Darwin
several types was a commonplace in the British land-          (Brightman, 1982; Hawksworth, 2002; Kricke &
scape: with descriptions of black to grey pollution-          Loppi, 2002), and this historical starting point often
sullied sheep as ‘ready-reckoners’ of air pollution           features at the beginning of reviews of this topic.
(Mellanby, 1967); of neat privet hedges becoming              Erasmus Darwin wrote the following lines in his
deciduous as a result of the depositions of soot on           educational poem The Botanic Garden: ‘No grassy
their leaves (Mabey, 1974); and of growers of chry-           mantle hides the sable hills,/No flowery chaplet
santhemums having to concern themselves with pro-             crowns the trickling rills,/Nor tufted moss nor leath-
tecting blooms from spotting by air pollutants, using         ery lichen creeps/In russet tapestry o’er the crumbling
bags and polythene sheets (Bennett, 1968); all of             steeps’ (Darwin, 1791). These lines have been inter-

                        © 2015 The Linnean Society of London, Biological Journal of the Linnean Society, 2015, 115, 611–635
LICHENS, BRYOPHYTES, MOTHS AND AIR QUALITY 615 preted by Brightman (1982) as referring to the local quantifiable relationship between assemblages of impacts of the copper mines at Parys Mountain in lichens and zones of pollution, was first put forward Anglesey (North Wales), both on the strength of the by the Scandinavian Sernander (Sernander, 1912), scientist and writer Arthur Aikin’s use of the lines and subsequently developed by numerous other con- above to describe the scenery on Parys during a visit tinental lichenologists, before being taken up by there in the late 18th Century (Aikin, 1797), and on Eustace Jones in Britain (Hawksworth, 1973). The a reference to a footnote in The Botanic Garden work of Jones (1952) is perhaps most notable for the stating that Darwin’s lines did also in fact refer to the thorough attempt at finding the best ‘indicator’ metric landscape of Parys Mountain (Brightman, 1982). of changes in lichen assemblages along pollution gra- Unfortunately, this footnote does not appear to exist dients (at this time, the emphasis was still on smoke in copies of The Botanic Garden that one of us (OLP) pollution, the link with SO2 not having been fully has examined, and, on reading the relevant section of elucidated; Adams & Preston, 1992); different meas- the poem and the accompanying notes, it is clear that ures such as overall lichen cover, lichen overall fre- the lines quoted above actually describe a ‘Traveller’s quency, and species richness were all investigated for Tale’ concerning the purported results of a poisonous different functional groups. The transects of Jones miasma emitted by the Upas tree (Antiaris toxicaria, (1952) clearly demonstrated gradients of lichen rich- Moraceae), a species found in Indonesia and through- ness and cover around SO2 pollution sources in the out the Old World tropics. It is not disputed here that British landscape for the first time (Fig. 2), an inno- Aikin (1797) uses Darwin’s lines on the Upas tree vation that was soon to take off in lichenology to describe the landscape at Parys Mountain (Hawksworth, 2002). However, rather unexpectedly (Brightman, 1982; Purvis, 2010); however, attributing given the long-standing emphasis on mapping lichens the first observation of air pollution impacts on in relation to air quality, vascular plants actually lichens to a fragment of poetry describing a generi- appear to furnish the first example of national, hectad cally desolate scene from a romantic standpoint is not (10 × 10 km) species distribution maps being using to very satisfactory. With interests spanning botany, interpret potential air pollution impacts: Bowen chemistry, and mineralogy (Torrens, 2004), one might (1965) used maps of juniper (Juniperus communis) to expect Aikin to have made more of an apparently infer impacts of SO2 on that species, a hypothesis that original observation. Of course, given that the pollu- does not appear to have been followed up with experi- tion on Parys was reportedly so bad that ‘not a single mental work. However, Hedgcock (1912) reported shrub or hardly a blade of grass [was] . . . able to live J. communis as the most resistant of eight conifer in the sulphurous atmosphere’ (Aikin, 1797), it is species in the proximity of the Washoe Anaconda likely that Aikin did not feel that he had to spell out copper smelter in Montana, USA, with the species the parallel loss of the lower plants. The resulting showing ‘little or essentially no injury from smelter quality of the observation, however, is of a rather fumes’, an observation no doubt unavailable to Bowen different type to that of later observers, such as (1965). William Borrer (Laundon & Waterfield, 2007), who Numerous authors have subsequently used hectad explicitly described the loss of lichens under ‘smoky’ maps of biological records in reviews to demonstrate urban conditions. The first clear observation of pollu- the thesis that particular lichen species or genera tion impacts on lichens, therefore, shifts to Borrer, have declined, or declined and then recovered, over who, with Dawson Turner in his Specimen of a the 20th Century (Seaward & Hitch, 1982; Brown, Lichenographia Britannica (Turner & Borrer, 1839), 1996; Seaward, 1998; Coppins, Hawksworth & Rose, clearly comments on the prevalence of ‘Lepraria 2001; Bates, 2002; Nash, 2008; Purvis, 2010). In all viridis’ (almost certainly the alga Desmococcus these cases, however, the commentaries have been olivaceus) where ‘the air is so impure that scarcely based on largely subjective estimates of distribution any other Lichen can exist’. This observation was limits under SO2 pollution, or on the visual compari- apparently first penned sometime around 1807 son of maps made at different time points. This (Laundon & Waterfield, 2007). approach can be more flexible than indicated by these Histories of the impacts of the Industrial Revolu- reviews: depending on the temporal and spatial reso- tion on both bryophytes and lichens have, however, lution of the biological records in question, such data been reviewed or overviewed elsewhere on numerous are used in increasingly creative ways (Isaac et al., occasions (Hawksworth, 1971, 1973, 2002; Gilbert, 2014). For example, here, using the British Lichen 1973; Seaward & Letrouit-Galinou, 1991; Adams & Society’s (BLS) Mapping Scheme and Lichen Data- Preston, 1992; Bates, 2002) and we do not repeat base datasets, we make a comparison of hectad them again here. The development of a conceptual records for the periods 1900–1979 and 1980–2013, framework under which to organize the observations and relate this to an index of peak SO2 concentra- of earlier naturalists, namely the idea of a clear and tions. For a given species in this analysis, each hectad © 2015 The Linnean Society of London, Biological Journal of the Linnean Society, 2015, 115, 611–635
616 O. L. PESCOTT ET AL.
Figure 2. The results of a transect from Ludlow (Site I), on the left hand side of the graph, via Walsall (Site VII; ‘no
conifers thrive here, and even many deciduous trees are not prosperous’ Jones, 1952), to Wootton Wawen (Site XIII) near
Stratford-upon-Avon [‘about 13 miles (21 km.) from the nearest sources of smoke’]. Adapted from Jones (1952).
was classified into one of three classes: gain (hectad tivities to acidic pollution (Hawksworth & Rose,
gained between the two time periods); loss (hectad 1970). These species have been chosen not only to
lost between time periods); and stable (hectad pres- demonstrate the uses of a simple hectad mapping
ence maintained between time periods); note that approach to distributional change, but also to high-
maintained hectad absences were excluded. The light its limitations.
resulting categorizations were used in a multinomial Usnea, a genus of epiphytic fructicose lichens, has
logistic model (Agresti, 2002). Annual mean SO2 con- often been used as an example of the large effects of
centrations for the year 1970 were calculated with the SO2 on the national distribution of sensitive species
FRAME atmospheric chemical transport model (Dore (Hawksworth, Rose & Coppins, 1973; Seaward, 1998).
et al., 2007; Matejko et al., 2009). This model uses The map presented here (Fig. 3A) clearly demon-
emissions estimates of SO2, NOx, and NH3 from the strates the partial infilling of the range between the
UK National Atmospheric Emissions Inventory two periods examined; the losses in the north and
(http://naei.defra.gov.uk/reports/) to simulate dry and west of Britain may be more likely to be the result of
aqueous phase atmospheric chemical reactions and to uneven recording between periods. The predicted
subsequently calculate the dry and wet deposition of probability graph for Usnea, showing the probability
sulphur and nitrogen compounds using transport that a hectad was lost, gained, or stable as a function
models. The resulting SO2 concentrations (Fig. 6A) of SO2 concentration, demonstrates that gain was the
were used as a covariate (aggregated to 10 × 10 km) most likely state above 26 μg m−3; hectads with this
in species’ multinomial logistic models. The modelled average level of pollution are most likely to have been
relationships give the probabilities of category mem- without Usnea spp. in the period 1900–1979, and to
bership as a function of the SO2 concentration in have been recolonized subsequently. This value is
1970, which we use as an index of historic pollution close to the 35–40 μg m−3 SO2 concentration given by
load per hectad (Fig. 3). An SO2 sensitive species that British field scales as the tolerance level for this
has subsequently recolonized large areas of previ- genus (Hawksworth & Rose, 1970). Comparison with
ously polluted territory should show an increasing the less SO2-sensitive foliose lichen Hypogymnia
relationship for ‘gain’ versus SO2 concentration physodes (Fig. 3B), a species that is given an approxi-
because it is those areas that are most likely to have mate tolerance of approximately 70 μg m−3 on the
been recolonized after pollution-inflicted losses. Hawksworth–Rose scale, shows a higher crossing
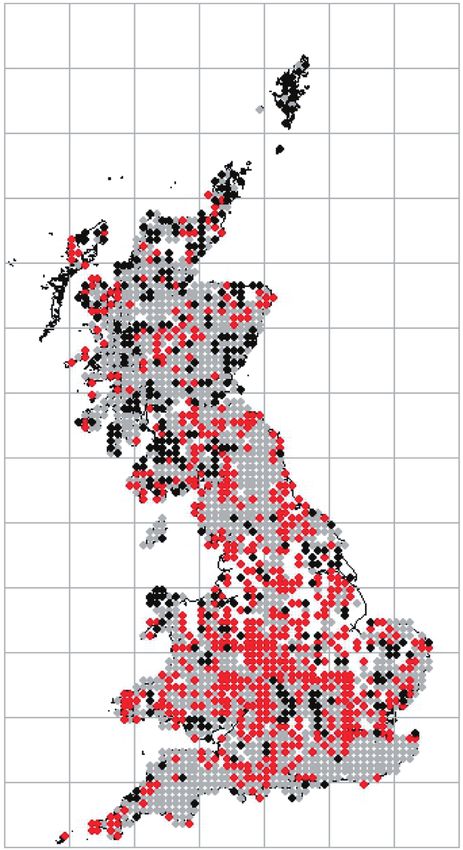
Figure 3 demonstrates this for one genus (Usnea) point at which the probability of gain over the other
and two species (Hypogymnia physodes, Lecanora two categories becomes most likely (approximately
conizaeoides) long known to exhibit differing sensi- 60 μg m−3). Indeed, for the set of common, variously
© 2015 The Linnean Society of London, Biological Journal of the Linnean Society, 2015, 115, 611–635LICHENS, BRYOPHYTES, MOTHS AND AIR QUALITY 617
A)
B)
C)
Figure 3. Predicted probability graphs and the hectad distributional data modelled for Usnea spp. (A), Hypogymnia
physodes (B), and Lecanora conizaeoides (C). For the distribution maps: grey, stable; red, gain; black, loss between the
time periods 1900–1979 and 1980–2013. The graphs were derived by solving the multinomial logistic regression equation
for each species for unit increases (1–200 μg m−3) in SO2 concentration per hectad.
© 2015 The Linnean Society of London, Biological Journal of the Linnean Society, 2015, 115, 611–635618 O. L. PESCOTT ET AL.
Table 1. Modelled SO2 concentrations at which the gain of a species became more likely than either loss or stability,
between the periods 1900–1979 and 1980–2013
SO2 concentration (μg m−3) where First appears on Hawksworth & Rose
Species P(gain) > P(loss OR stable) (1970) scale (scale point and concentration)
Hypogymnia physodes 58 4: ∼70 μg m−3
Parmelia sulcata 56 4: ∼70 μg m−3
Parmelia saxatilis 42 4: ∼70 μg m−3
Evernia prunastri 37 5: ∼60 μg m−3
Ramalina farinacea 30 5: ∼60 μg m−3
Lecanora chlarotera 25 5: ∼60 μg m−3
Usnea spp. 26 7: ∼40 μg m−3
sensitive species listed in Table 1, the predicted SO2
extinction/recolonization point derived from the com-
parison of the two broad hectad date classes puts the
species into almost exactly the order given by the
Hawksworth–Rose scale; the estimates given here are
lower than the Hawksworth–Rose scale (Table 1),
although other correlative work has also indicated
that this scale generally overestimates a species’
SO2 tolerance (van Dobben & ter Braak, 1999). The
model of hectad distribution change for Lecanora
conizaeoides (Fig. 3C), a highly SO2 tolerant species
that spread under acidic pollution (Bates, 2002), sug-
gests that this species has generally remained stable
between the two periods analyzed, except in histori-
cally unpolluted areas, where loss is the most likely
condition; however, this may be a result of under-
recording in the Scottish Highlands (Fig. 3C). In this
case, the model may be less accurate given that field
lichenologists have typically reported severe declines
of Lecanora conizaeoides in previously highly polluted
areas (Gilbert, 1992; Purvis, 2010; Hauck et al., 2011), Figure 4. Changes in the distribution of Lobaria spp.
and that analyses of biological records using different (Lobaria amplissima, Lobaria pulmonaria, Lobaria
time periods have indicated recent declines at the scrobiculata, and Lobaria virens) in Wales between the
hectad scale (Simkin, 2012). time periods 1900–1979 and 1980–2013 (BLS data); grey,
The impacts of pollutants on the uplands should stable; red, gain; black, loss.
also be highlighted here: despite the separation of the
uplands from the main historic sources of heavy Lobaria spp. from a number of locations across Wales
industrial pollution in Britain (Fig. 6B), clean-air leg- (Fig. 4). Although the effects of acidification in the
islation in the 1950s and 1960s led to the introduction uplands have lessened in recent years (RoTAP, 2012),
of taller chimneys in an attempt to reduce local pol- some field lichenologists consider that the long-range
lution impacts. Unfortunately, these tall stacks effi- transport of acidifying pollutants is still affecting
ciently exported pollutants as aerosols to areas, such sensitive lichen communities (Sanderson, 2014). The
as the uplands, that had not previously experienced BLS are currently running a Lobarion survey, where
the effects of SO2 or NOx deposition (Farmer, Bates & biological recorders are encouraged to visit previously
Bell, 1992). The resulting acidic wet deposition has known locations of key species, and it will be of great
been linked to the declines of lichens in upland interest to see whether additional recoveries, or new
Lobarion communities on several occasions (Day, locations, are reported in the coming years.
1985; Gilbert, 1986). Parts of Wales (e.g. the Cam- Future work on the use of biological records for this
brian Mountains) have been amongst the worst type of analysis would ideally capture information on
affected places in Britain (Gee & Stoner, 1989), and the recorder effort that went into producing the
the BLS datasets referred to above indicate the loss of records analyzed (Hill, 2012; Isaac et al., 2014), and
© 2015 The Linnean Society of London, Biological Journal of the Linnean Society, 2015, 115, 611–635LICHENS, BRYOPHYTES, MOTHS AND AIR QUALITY 619
would also benefit from analysis at finer temporal and 1993); correspondingly, several studies have now
spatial scales where records allow. However, a historic demonstrated an association between superoxide
focus on summarizing data at the hectad-broad date- dismutase (a free oxygen radical scavenging enzyme)
class level (i.e. a lack of separation between the act of activity and SO2 tolerance or sensitivity in several
biological recording and the use of data for hectad species (Silberstein et al., 1996a, b; Deltoro et al.,
mapping) has meant that much lichen data may not 1999; Kong et al., 1999). Regardless of the particular
be suitable for the types of more detailed trend analy- mechanisms underlying lichen sensitivities to SO2, it
ses that have recently been applied to bryophytes (see is worth noting that the ordering of particular lichen
below). Additional covariates can be incorporated into species sensitivities, as deduced from field studies
logistic models, and partial responses to particular calibrated using SO2 gauges (Hawksworth & Rose,
covariates calculated (Hames et al., 2002); this could 1970), has been largely supported by laboratory
potentially allow for changes in SO2 to be modelled fumigations, validating the use of lichens as
alongside changes in other pollutants. Stevens et al. bioindicators of SO2 (Nash, 1988; van Dobben & ter
(2012) used a similar approach to analyze terricolous Braak, 1999).
lichen hectad occurrences for all records within a The indirect effects of pollutants on lichens are also
single date class, incorporating indicators of SO2 well studied. Considerable effort has been spent on
and total nitrogen-deposition into a single model. investigating the relationships between bark pH and
Although Stevens et al. (2012) reported the existence epiphytic lichen presence and abundance. Early work
of numerous species showing negative relationships demonstrated an association between the amount of
with nitrogen-deposition at this scale, the complexi- pH buffering provided by a host species’ bark, SO2
ties of the changing pollution environment experi- levels and lichen community composition (Skye,
enced by lichens over the past half-century, exerting 1968); in recent years, as acidification has become less
its influence at different scales and with largely of a problem, research interest has shifted to deter-
unknown interactive effects, may mean that, in some mining the indirect effects of nitrogenous pollution on
cases, finer scale investigations will be more success- lichen communities (Wolseley et al., 2006; Davies
ful at characterizing reliable pollutant–species rela- et al., 2007). One general theme arising from this
tionships. For example, recent work on NH3 and NOx work is the widespread shift from acidophyte (or
has used detailed studies across smaller scale pollu- ‘nitrogen-sensitive’) dominated communities to
tion gradients to infer such indicator relationships for nitrophyte (or ‘nitrogen-tolerant’) dominated ones,
epiphytic species (Wolseley et al., 2006; Davies et al., particularly near to point sources of ammonia pollu-
2007). tion, which are generally animal husbandry-related
(Wolseley et al., 2006). As discussed earlier, nitrogen
Direct and indirect effects of air pollutants pollution exists in various forms, and effort has also
on lichens been spent on attempting to determine the relative
Much of the research into the direct impacts of air importance of NH3, NH4+ and NOx to the observed
pollutants on lichens has investigated effects on pho- changes in lichen communities. Although conclusions
tosynthesis and respiration, as well as the methods of have varied between studies, no doubt as a result of
detoxification in apparently tolerant species; much of the number of additional factors that can also control
this work has focused on SO2 (Nash, 2008). One study lichen communities, and because of differences in how
investigating multiple species and SO2 concentrations pollutant concentrations were quantified, the current
has indicated that the oxidation of toxic bisulphite to evidence suggests that NH3-driven increases in bark
sulphate, which is subsequently leached, can account pH can be a significant local driver of community
for as much as 70% of the sulphur uptake of lichens change (Wolseley et al., 2006) but SO2 declines may be
(Gries et al., 1997). Nash (2008) suggests that under- a stronger national factor determining recent general
standing how lichens deal with the remaining increases in nitrophytes (van Dobben & ter Braak,
sulphur is the key factor determining species differ- 1998, 1999). Ammonium (NH4+) deposition has been
ential sensitivities. Gries et al. (1997) documented associated with acidification where it has been quan-
differences in H2S emissions between species, which tified from individual tree stemflows (Mitchell et al.,
were interpreted as indicating differential bisulphite 2005), although this relationship has often not been
detoxification abilities because H2S is the product of clear in studies using broader, modelled estimates
the reduction of sulphite by enzymes; however, this of atmospheric pollutants, with high collinearity
mechanism is only considered to be a minor part of between predictors (van Herk, Mathijssen-Spiekman
SO2 resistance (Nash, 2008). There is also evidence & de Zwart, 2003). As with most correlative studies of
suggesting that peroxidase activity is an important complex, multivariable systems, where issues of scale,
part of SO2 resistance in lichens because SO2 uptake accuracy of measurements, collinearity between vari-
results in the production of free radicals (Modenesi, ables, and nonlinear relationships may all be present,
© 2015 The Linnean Society of London, Biological Journal of the Linnean Society, 2015, 115, 611–635620 O. L. PESCOTT ET AL.
careful modelling and interpretation of results is Table 2. Epiphytic bryophytes that significantly
always required (Smart et al., 2012). increased between the periods 1960–1989 and 1990–2013
(Hill & Preston, 2014)
BRYOPHYTES L: Cololejeunea minutissima M: Orthotrichum
Evidence from biological records over time pulchellum
The recent publication of a new bryophyte atlas of L: Colura calyptrifolia M: Orthotrichum pumilum
Britain and Ireland (Blockeel et al., 2014) has allowed L: Frullania dilatata M: Orthotrichum
stramineum
a much clearer insight into the changes that have
L: Metzgeria fruticulosa s.l. M: Orthotrichum striatum
taken place over the past half century. The first
L: Metzgeria furcata M: Orthotrichum tenellum
national bryophyte atlas (Hill, Preston & Smith,
L: Microlejeunea ulicina M: Platygyrium repens
1991) already revealed the beginnings of a recovery in
L: Radula complanata M: Pylaisia polyantha
the populations of some epiphytes (Proctor, 1991; M: Cryphaea heteromalla M: Syntrichia latifolia
Adams & Preston, 1992), now, the considerable M: Daltonia splachnoides M: Syntrichia papillosa
increase in the number of records collected, and better M: Dicranum tauricum M: Syntrichia virescens
geographical coverage (Preston, 2014; Preston & M: Orthotrichum affine M: Ulota calvescens
Rorke, 2014), has allowed a comprehensive and M: Orthotrichum diaphanum M: Ulota crispa s.l.
robust analysis of change in the new atlas (Hill & M: Orthotrichum lyellii M: Ulota phyllantha
Preston, 2014). Hill & Preston (2014) applied a new M: Orthotrichum M: Zygodon conoideus
model to the new atlas dataset, Frescalo (‘FREquency obtusifolium
SCAling LOcal’), formulated to deal with geographical
variation in recorder effort (Hill, 2012), and also L, liverwort; M, moss.
analyzed the relative change in the proportion of
species-hectad occurrences out of all such occurrences
for individual species between 1960–1989 and 1990– Cryphaea heteromalla, Orthotrichum lyellii, Ulota
2013 using chi-squared goodness-of-fit tests. This phyllantha and Frullania dilatata, which fifteen
latter test is essentially a simple measure of a species years ago were exciting finds, are now almost com-
relative change between periods: if a species has monplace’ (Sanford & Fisk, 2010); whereas, in the
neither increased nor decreased its distribution, it Sheffield area, ‘[o]ne very good indicator of the
can be assumed that the number of hectad-level improvement in conditions for epiphytes is the moss
occurrences accounted for by a species will be a fixed Orthotrichum affine which was seen in the South
proportion of all such records made, even if the abso- Yorkshire region only on rare occasions in the late
lute number of species-hectad occurrences increases 1990’s and then mostly in the damp areas of
or decreases (i.e. even if there is an overall shift in the river valleys. Some six or seven years later there
recording effort; Ball et al., 2011; Hill & Preston, are now records for this species in over 120 tetrads
2014; Isaac et al., 2014). These analyses showed that [2 × 2 km squares] and it is recorded, seemingly,
epiphytes as an ecological group had, by a consider- almost every time a new tetrad is visited, given that
able margin, undergone the most dramatic change out a suitable habitat is available’ (Lake & Egan, 2007).
of any of the groups analyzed. Overall, 28 species of Perhaps most encouragingly, the highly sensitive
epiphyte were found to have significantly increased moss Antitrichia curtipendula (Adams & Preston,
between the two time periods (Table 2) (Hill & 1992) is also beginning to show signs of a recovery
Preston, 2014). Figure 5 provides a coincidence map (Preston & Blockeel, 2014).
of richness for these species, strikingly demonstrating Finally, we review two examples where interesting
the result of the late 20th Century recovery in epi- trends have been displayed at the hectad level over
phyte diversity. Studies focusing on reviewing or dem- the past 55 years; these are species for which air
onstrating the recovery of epiphytes for more pollution drivers of change are considered to be highly
restricted localities have also increased in frequency likely. In these examples, the hectad occurrence infor-
[Epping Forest and nationally: Adams & Preston mation has been separated into high SO2 and low SO2
(1992); Sheffield area: Lake & Egan (2007); London: regions; Frescalo time trends were then generated
Duckett & Pressel (2009); Lancashire: Lowell (2009)]; separately for these two regions (Hill & Preston,
all of these discuss increases and recoveries in their 2014). The high SO2 zone was defined as that where
areas. A number of bryophyte Floras have also pro- the mean atmospheric concentration of SO2 exceeded
vided commentary on the effects of air pollution on a 3.3 p.p.b. (∼8.8 μg m−3 according to current Defra
variety of taxa (Adams, 1974; Gardiner, 1981; Jones, equivalence guidelines) in 1986 (Fowler et al., 2007),
1991; Bates, 2005; Sanford & Fisk, 2010; Boon & and is mapped in Figure 6B. The first example is for
Outen, 2011). For example, in Suffolk, ‘[s]pecies like two common and widespread epiphytes: O. affine and
© 2015 The Linnean Society of London, Biological Journal of the Linnean Society, 2015, 115, 611–635LICHENS, BRYOPHYTES, MOTHS AND AIR QUALITY 621 Figure 5. Coincidence map for 28 epiphytic bryophytes for 1960–1980 (A) and 1990–2010 (B). These are species that were found to have significantly increased in abundance, after adjustments for estimated local recorder effort, between 1960–2013 (Hill & Preston, 2014). Dots of increasing density indicate species per hectad counts of 1–5, 6–10, 11–15, 16–20, 21–25, and > 25. © 2015 The Linnean Society of London, Biological Journal of the Linnean Society, 2015, 115, 611–635
622    O. L. PESCOTT ET AL.

   A                                                     B

Figure 6. A, modelled SO2 pollution levels for Britain in 1970 (Dore et al., 2007; Matejko et al., 2009). B, high (black) and
low (white) SO2 pollution zones for Great Britain for the bryophyte and Lepidoptera analyses of change.

its congener Orthotrichum diaphanum. These two                  avoids the effects of pollution, with its broader niche
epiphytes have overlapping niches, with O. affine               allowing it to penetrate inside sulphur polluted areas
generally restricted to trees and shrubs but with               by growing on basic substrata such as asbestos
rare occurrences on walls and stones, whereas                   (Gilbert, 1970). The most recent evidence from the
O. diaphanum is equally at home on either organic or            recorder-effort adjusted national trends produced by
inorganic surfaces (Hill et al., 1991). Both of these           Hill & Preston (2014) suggests that O. diaphanum
species have been affected by acidic air pollution,             may have recovered more quickly under decreasing
although their distinct ecologies have led to different         sulphur pollution than O. affine (GB high sulphur
patterns of change. As early as 1968, Oliver Gilbert            zone) (Fig. 7). Although O. diaphanum was more
demonstrated a difference in the distributions of               common under polluted conditions as a result of its
these species in the Newcastle area, showing that,              relatively catholic niche (Gilbert, 1970), the fact that
although the epiphytic O. affine was restricted to the          it has also undergone a considerable recovery (albeit
cleanest environments, O. diaphanum was able to                 a weaker one than O. affine) (Fig. 7), clearly indicates
survive on asbestos roofs some distance along the               that it too suffered as an epiphyte (Gilbert, 1970).
pollution gradient studied (Gilbert, 1968, 1970). This          Orthotrichum diaphanum initially appears to have
has led some authors to describe O. diaphanum as                increased more rapidly than O. affine, this may be at
pollution tolerant (Stevenson, 1999); however, it               least partly a result of its existing populations on
would be more accurate to state that the species                basic, inorganic substrata providing it with a head-

                          © 2015 The Linnean Society of London, Biological Journal of the Linnean Society, 2015, 115, 611–635
LICHENS, BRYOPHYTES, MOTHS AND AIR QUALITY 623 Figure 7. Frescalo time-trends for Orthotrichum affine and Orthotrichum diaphanum in Great Britain, calculated separately for high and low sulphur zones (see text); smoothers are local regression (‘loess’) lines. Frequencies are relative to the average local occupancy of a set of ‘benchmark species’ (Hill, 2012); frequencies above 1 indicate that a taxon has become commoner than the average benchmark species. start from increased propagule pressure over other (Rose & Wallace, 1974). Although the connection expanding epiphytes, as well as its broader niche between SO2 and substrate acidification was not (Fig. 7). Before the national analysis undertaken for explicitly made by Rose & Wallace (1974), it was the new bryophyte atlas, few studies appear to have suggested that these species were tolerant of ‘moder- commented on the increases in O. diaphanum in com- ate air pollution and possibly . . . selectively favoured parison to other sensitive taxa (but see Adams & by this in competition with other species’ (Rose & Preston, 1992 and Boon & Outen, 2011). This may be Wallace, 1974). Jones (1991) provided a thorough mainly result from its continued existence in review of the increasing acidophilic element in the calcicolous inorganic refugia during the worst period Oxfordshire flora in the 20th Century, and also drew of acidic pollution. However, it is now clear that on much additional evidence from across Britain. The O. affine has overtaken O. diaphanum by some new bryophyte atlas (Blockeel et al., 2014) now sug- margin, and that it is also increasing in the low gests that the late 1980s and early 1990s were a sulphur, mainly upland, zone; whether this is a result turning point for many of these species, with the of other environmental drivers, such as climate available evidence demonstrating a subsequent change, or merely a return to pre-pollution era decline in many acidophilic species (Hill & Preston, biogeographical zones [Hill et al. (2007) classify 2014). The Frescalo-generated (Hill, 2012) 5-yearly O. affine as a member of the Boreo-temperate element time trends shown in Figure 8 demonstrate compared to the Southern-temperate diaphanum] this phenomenon for four species. The rise and remains to be seen. fall (Aulacomnium androgynum, D. montanum, The second example of recent change in the British Lophocolea heterophylla), or drop off from high levels and Irish bryophyte flora concerns acidophilic species. (Pohlia nutans), are clearer, or larger in magnitude, Rose & Wallace (1974) included examples of these in the high SO2 region compared to the low region, as species in their review of the changing bryophyte would be expected for a set of species that are con- flora of Britain, highlighting Dicranum montanum, sidered to have been favoured by acidic air pollution Dicranum tauricum (syn. Dicranum strictum), in the mid 20th Century. Strikingly, a very clear Dicranoweisia cirrata, and Orthodontium lineare as distinction between continued stability (low SO2), and acidophile species that had increased their ranges increase followed by decline (high SO2), was also © 2015 The Linnean Society of London, Biological Journal of the Linnean Society, 2015, 115, 611–635
624    O. L. PESCOTT ET AL.

  A                                                           B

  C                                                           D

Figure 8. Frescalo time-trends for four acidophyte species in Great Britain, calculated separately for high and low
sulphur zones (see text); note the different scales. A, Aulacomnium androgynum; B, Lophocolea heterophylla; C, Dicranum
montanum; D, Pohlia nutans. Frequencies are relative to the average local occupancy of a set of ‘benchmark species’ (Hill,
2012); frequencies above 1 indicate that a taxon has become commoner than the average benchmark species.

found for an ecological grouping of bryophytes char-           significant effects of reduced nitrogen deposition on
acteristic of lowland acid woodlands by Hill & Preston         the growth and cover of Racomitrium lanuginosum
(2014). Unfortunately, experimental evidence for the           were demonstrated by Pearce, Woodin & Van Der Wal
colonization of trees and shrubs by acidophytic                (2003). The historic effects of sulphur and nitrogen
bryophytes under increasing SO2 does not appear to             pollution on ombrotrophic Sphagnum spp. on the
exist for bryophytes as it does for lichens (Bates,            southern Pennines are also well known (Lee &
McNee & McLeod, 1996), although the common pat-                Studholme, 1992) and, encouragingly, recent surveys
terns found across species of similar ecology, coupled         of experimental transplants and transects established
with much anecdotal evidence for increases in                  during the 1980s are now revealing improvements in
acidophiles up to the early 1990s (Jones, 1991), as            these habitats (Caporn et al., 2006). The acidification
well as evidence for acidophytic lichen increases and          and ongoing recovery of upland streams (Murphy
declines under experimental SO2 fumigation (Bates              et al., 2014) is also likely to have had effects on
et al., 1996) and increasing pH respectively (Hauck            aquatic bryophytes: the early developmental stages
et al., 2011) lend strong support to the national              of species such as Chiloscyphus polyanthus and
picture of increase followed by decline deduced from           Platyhypnidium riparioides, which are characteristic
the analysis of relative hectad occurrences over time          of more neutral waters, are not able to tolerate acidity
(Fig. 8; Hill & Preston, 2014).                                (Vanderpoorten & Goffinet, 2009), whereas species
   As for lichens, we should not ignore the specific           characteristic of acid waters, such as Scapania
effects of pollutants in the uplands. For example,             undulata, might be expected to have benefitted.

                         © 2015 The Linnean Society of London, Biological Journal of the Linnean Society, 2015, 115, 611–635
LICHENS, BRYOPHYTES, MOTHS AND AIR QUALITY 625
Indeed, it has been suggested that the abundance of and photosynthesis (Ferguson, Lee & Bell, 1978).
Nardia compressa in the streams of mid-west Wales Investigations into the biochemical processes under-
may be an indication of acidification (J. W. Bates, pinning these effects have suggested that the acid-
pers. comm.). Focused monitoring has provided some driven phaeophytinization (i.e. the replacement of
evidence for recoveries in upland acidic streams, gen- Mg2+ with 2H+) of chlorophyll could be the main
erally relating to increased occurrences of the more mechanism behind SO2 toxicity, although other
acid-sensitive mosses Hygrohypnum ochraceum and studies have suggested that this may be misleading
Fontinalis spp. (Monteith & Shilland, 2007). Despite because of the unrealistically high levels of SO2 used
all of the above evidence for the upland impacts of in these early experiments (Bates, 2002). A particu-
acidic pollutants, none of the species noted above larly fascinating experiment, using the bog-pool moss
showed significant trends in the national hectad-scale Sphagnum cuspidatum, revealed evidence for inter-
analyses of Hill & Preston (2014). This is perhaps not population variation for tolerance to SO2 effects on
surprising, given the abundance of these species photosynthesis and dark respiration (Baxter, Emes &
across the British uplands. Lee, 1991). This was revealed through the comparison
of plants from a polluted area (the South Pennines)
Direct and indirect effects of air pollutants with those from a relatively unpolluted area (North
on bryophytes Wales): the plants from the polluted mire were more
Bryophytes are mostly poikilohydric, relying on their tolerant to SO2 than those from the cleaner area. This
environment at any moment for moisture, and having difference was found to be mediated by metal ions
no mechanism for the regulation of water loss oxidizing phytotoxic bisulphite ions; the tolerance
(Proctor, 2011). Existing thus in an equilibrium with conferring metal ions were themselves present in the
their water environment makes them particularly South Pennine mires as a result of industrial pollu-
susceptible to atmospheric pollution, which can arrive tion. The increased SO2 tolerance could be induced in
in the form of dry, wet or occult (i.e. in cloud or fog the population from North Wales through the experi-
aerosols) deposition (Bates, 2002). However, as Nash mental addition of metal cations (Baxter et al., 1991);
(2008) has pointed out in the context of lichen sensi- an additional genetic contribution to the observed
tivities to pollution, this is ‘a generalisation that differences between populations cannot be ruled out
requires cautious interpretation and limited extrapo- but was not revealed by isozyme analyses (Lee &
lation’. Clearly all bryophytes are not equally sensi- Studholme, 1992). Experimental evidence for differ-
tive to all pollutants, and it is the combination of ential SO2 tolerance between species also exists:
physiological sensitivity to the direct effects of a pol- Winner & Bewley (1983) revealed differences in SO2
lutant, the actual exposure to a pollutant, as well as sensitivity between the pleurocarps Pleurozium
indirect effects, such as changes to a plant’s interac- schreberi, Hylocomium splendens, and Ptilium crista-
tions with other plants or animals, or pollution-driven castrensis, despite finding no difference in SO2 uptake
changes to a substrate, that ultimately determine the between species. Fertility may also be affected: for
risk of weakening or death. Many naturalists, and example, fruiting in P. schreberi has been shown to
probably all bryologists, will be familiar with the be reduced around a copper smelter in Finland
particular susceptibility of epiphytic bryophytes to air (Huttunen, 2003), and effects on the fertility of
pollution, although we may ask whether epiphytes several species has been previously inferred from
are uniquely susceptible as a group, or whether the historic observations (Rose & Wallace, 1974). The
emphasis on this group has been a result of other physiological basis of SO2 tolerance in two terricolous
factors, such as a bias in research interests because of mosses has recently been investigated in greater
the discrete nature of epiphyte habitats, or to more detail by Bharali & Bates (2006). It was shown that
general aspects of their ecological life strategies or the process of detoxification has both metabolically
physiology; for example, the fact that many epiphytes passive and active components. The passive oxidation
have been categorized as ‘shuttle’ species (During, of phytotoxic bisulphite is enabled by the uptake
1992) with relatively short life-cycles and dynamic of Fe3+, as shown by Baxter et al. (1991) for
populations; this point is returned to below. S. cuspidatum, whereas evidence was also found
Although there are many challenges to overcome in for active processes such as metabolically-driven
experimentally assessing the impacts of different extracellular oxidation and internal metabolic
types of atmospheric pollution on bryophyte species, detoxification.
much interesting work has been carried out using The direct effects of the dry deposition of nitrogen
field or laboratory fumigations, or immersion tech- oxides on bryophytes have been studied very little
niques with aqueous solutions of pollutants in (Lee et al., 1998), despite their being among the most
their ionic forms (Bates, 2002). A focus of several important pollutants of urban environments. In what
experiments has been the effects of SO2 on growth appears to be the only study utilizing experimental
© 2015 The Linnean Society of London, Biological Journal of the Linnean Society, 2015, 115, 611–635626 O. L. PESCOTT ET AL.
fumigations of NO and NO2, Morgan, Lee & Ashenden effects of SO2, NOx, and NH3 on bryophytes has
(1992) found effects of NOx on nitrate assimilation focused on the pH of species’ substrates, particularly
but no effects on photosynthesis, suggesting that, bark. As noted above, early on in cryptogam-air pol-
although NO and NO2 have direct effects on the lution research Gilbert (1968, 1970) examined a
nitrogen metabolism of bryophytes at realistic atmos- variety of habitats along a pollution gradient, and
pheric concentrations, they do not strongly disrupt showed that an epiphyte’s substrate was crucially
the growth of plants. Many experimental studies of important for tolerance to acidic pollutants. Other
nitrogen impacts have mimicked wet deposition of studies, including Coker (1967) and Skye (1968), have
nitrogen pollution through the addition of NO3− or directly demonstrated how SO2 can acidify bark and
NH4+, and it is now well known that the addition of reduce its buffering capacity. Another well-researched
nitrogen in this way results in the induction of nitrate indirect impact of air pollution on bryophytes is the
reductase, and in an increase in bryophyte tissue increased competition from vascular plants resulting
nitrogen concentrations (Lee et al., 1998). Experimen- from the eutrophication caused by nitrogen deposi-
tal additions to semi-natural communities have tion. Both experimental work and national-scale
also demonstrated effects on the abundances correlative studies have demonstrated negative rela-
of two common pleurocarps, P. schreberi and tionships between nitrogen and bryophyte cover (Lee
Rhytidiadelphus squarrosus (Morecroft, Sellers & & Caporn, 1998; Carroll et al., 2000) and species
Lee, 1994); however, more recent research has shown richness (Duprè et al., 2010; Edmondson et al., 2010).
that physiological measurements, such as phospho- The question of why epiphytic bryophytes are
rous metabolism enzymes and tissue nitrogen : phos- so sensitive remains to be definitively answered:
phorous ratios, may be better indicators of nitrogen terricolous species have clearly also been impacted by
deposition impacts and recovery in bryophytes the direct and indirect effects of atmospheric pollut-
(Arróniz-Crespo et al., 2008). Arróniz-Crespo et al. ants (Bates, 1993), although the evidence for change
(2008) suggested that Pseudoscleropodium purum at the national scale over the recent past has not been
would be a good indicator of nitrogen deposition as striking as it has for epiphytes (Hill & Preston,
impacts and subsequent recovery as a result of its 2014). Given that the epiphytic bryophytes so
ability to withstand the phosphorous limitation stress impacted are from a number of different families, the
resulting from high levels of nitrogen uptake, and impacts cannot solely be the result of any particular
thereby respond to the changes in nitrogen supply phylogenetic tendency towards pollutant sensitivity
resulting from air pollution. Bryophyte transplant but must result from some more general physio-
studies along nitrogen deposition gradients have ecological constraint. The answer may lay in part
also found significant effects of nitrogen pollution on with the typical life strategy of epiphytic bryophytes:
bryophyte growth, tissue nitrogen, and community most are classified as long- or short-lived ‘shuttle’
composition (Mitchell et al., 2004, 2005), although species in ecological life-strategy schemes created for
different metrics of nitrogen pollution severity corre- bryophytes (During, 1992). It is generally assumed
lated with different responses in different species, that these species ‘track’ habitat patches across the
suggesting many complexities waiting to be uncov- landscape, with extinction at one patch offset by the
ered (Mitchell et al., 2005). Broader surveys of species regular production of propagules allowing them to
richness across modelled nitrogen deposition gradi- locate new habitat (Rydin, 2008). Such a strategy
ents have shown significant declines in species rich- clearly relies on the availability of suitable regenera-
ness associated with either reduced or oxidized forms tion niches (Grubb, 1977), and it can be postulated
of nitrogen deposition. For example, Field et al. (2014) that the acidification of bark as a result of SO2 (and
surveyed five broad habitat types across the UK, and, NOx) may have resulted in a catastrophic loss of these
using multiple regression, found significant negative niches for a suite of species that rely on the continual
relationships with forms of nitrogen deposition for extinction and colonization processes of a meta-
moss (liverworts were excluded from survey) species populational existence (Wiklund & Rydin, 2004).
richness in acid grassland and sand dune communi-
ties, and in bogs and upland heaths for lichens
(although spatial autocorrelation was not accounted LICHEN-FEEDING LEPIDOPTERA
for in the statistical models used, suggesting that the Evidence from biological records over time
marginal P-values reported for the lichen species rich- Approximately 2500 species of Lepidoptera have been
ness responses may be less reliable). recorded in Great Britain (Waring & Townsend,
The results from surveys of species richness across 2009). These are split, for convenience rather than by
pollution gradients are likely to be the cumulative phylogeny, into micro- and macro-moths. The micro-
outcome of both the direct and indirect effects of moths are the most speciose with over 1500 species,
pollutants. Much of the research on the indirect the majority of which, as their name suggests, are
© 2015 The Linnean Society of London, Biological Journal of the Linnean Society, 2015, 115, 611–635You can also read