CROSS ASSET Investment Strategy - Amundi Research center
←
→
Page content transcription
If your browser does not render page correctly, please read the page content below

# 02
February                 CROSS ASSET
2021                     Investment Strategy
CIO VIEWS
Choppy markets in a moment of truth for rates
THIS MONTH’S TOPIC
2021 investment case in equities
and how Japan fits into it

Document for the exclusive attention of professional clients, investment services providers and any other professional of the financial industry

CROSS ASSET                                              #02
                                                                                                INVESTMENT STRATEGY

#02 - February 2021
Table of contents
                     Global Investment Views

CIO Views                                                                          Multi-asset
Choppy markets in a moment of truth for rates                           p. 3      Carefully stabilise portfolios with a ‘risk-on’ tilt                    p. 5
Markets are questioning the no inflation forever narrative                         A reduction in headwinds in the form of a US stimulus, a Euro-China
as breakeven inflation expectations rose in the US, amid an                        deal and Brexit enable us to keep our sectoral tilt towards cyclicality
accelerating economy and hopes of additional fiscal stimulus. This                 with some adjustments, coupled with strong hedging.
warrants a cautious and active stance on duration so that investors
closely watch movements of yields and consider exposure to
inflation-linked bonds. On equities, cyclical, value and quality stocks            Fixed income
offer an attractive way to play the improving economic environment,                Inflation dichotomy between the US and Europe p. 6
but being selective and valuation-conscious is key. Overall, investors             Investors should note that credit markets are expensive, but
should remain agile and flexible in their allocation, and consider less            selection, research and relative value should allow them to generate
correlated investment strategies to enhance diversification.                       decent returns without compromising on quality.

Macro                                                                             Equity
Looking beyond the recent surge in yields                              p. 4       Relative value game to continue: Value vs Growth p. 7
The US yield curve may steepen mildly but the Fed’s resolve to                     We believe this is the year of recovery but the timing of
maintain easy financial conditions and support a recovery indicate                 normalisation is not clear. Investors should look for non-disrupted
that the central bank would prevent any sharp upward movements                     business models, leaving the lowest parts (in terms of quality)
in yields.                                                                         untouched.

                      Thematic Global views
Taper or not taper: a key issue for markets                                                                                                                p. 8
The Fed is committed to maintaining very accommodative monetary conditions and unchanged interest rates until the economy has returned to full
employment and inflation has stabilised above its 2.0% target. But the Fed has so far been vague on what determines the pace of its asset purchases. It is
clear that these will have to decline long before it raises its key rates. But when and on what basis? Tapering has its risks but also its benefits. The challenge
for the Fed will be to steer a gradual steepening as history shows that steepening episodes can be quite abrupt and generate volatility on markets.

                         This Month’s Topic
2021 investment case in equities and how Japan fits into it                                                                                               p. 10
Although the global recovery began to be priced in last year, the current pro-cyclical rotation is likely to continue. Because of the dollar’s weakness, we
prefer emerging markets, but Japan has other things going for it that, at the very least, can help balance out the portfolio..

                                Thematic
Why we don’t expect the Fed to taper its bond buying programme this year                                                                                  p. 14
In a world where sovereign bond yields are in the hand of central banks, the recent upward revisions of growth expectations for the US economy raised
questions about the outlook for the Fed’s monetary policy. Growth is expected to rebound in H2 and very accommodative monetary policy is not a free
lunch. The difficulty for the Fed is estimating how sustainable this expected improvement in growth and inflation will be in H2 2021. We expect the Fed to
keep a cautious approach and we believe tapering is more likely in 2022 when the core PCE index will have made significant progress towards the objective
of a sustainable increase to an average of 2% or higher.

                                Thematic
Supply vs demand of EMU EGB in 2021                                                                                                                       p. 16
Euro area sovereign debt issuance vs. ECB purchase dynamics look favourable in 2021. On the supply side, net issuance should decrease vs 2020, thanks
to lower aggregated numbers of budget deficits, incoming support from EU funds, and for some countries, the use of increased cash accounts and higher
bond redemptions. On the demand side, following December PEPP increase ECB potential purchases look more than adequate to cover for new debt and
to provide as well a cushion for eventual additional funding needs.

                                Thematic
New money and maybe new powers too: Central Bank Digital Currencies are coming                                                                            p. 19
The CBDC (Central Bank Digital Currency) theme is likely to grow in importance in 2021, as central banks are accelerating their studies and tests. As an
instrument for helping economies adapt to digitalisation, CBDCs are also intended to bolster a state’s monetary sovereignty in the face of new challenges.
However, their implementation raises complex issues. In terms of monetary policy, they could open new possibilities.

                     Market scenarios & risks                                                            Macroeconomic picture
> Central & alternative scenarios                                      p. 21      > Developed countries                                                   p. 26
> Top risks                                                            p. 22         Macroeconomic outlook - Market forecasts
> Cross asset dispatch:                                                           > Emerging countries                                                    p. 27
   Detecting markets turning points                                    p. 23         Macroeconomic outlook - Market forecasts
> Global research clips                                                p. 24      > M acro and market forecasts                                          p. 28
> Amundi asset class views                                            p. 25      > Disclaimer to our forecasts / Methodology                            p. 29
                                                                                   > Publications highlights                                              p. 30

2-      Document for the exclusive attention of professional clients, investment services providers and any other professional of the financial industry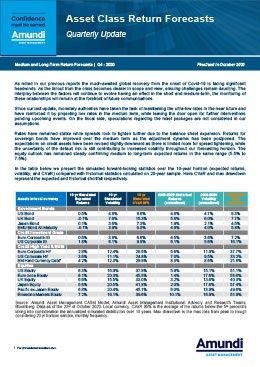
CROSS ASSET                                         #02
                                                                                           INVESTMENT STRATEGY

 CIO VIEWS                                    Choppy markets in a moment of truth for
                                              rates

                                              Markets closed 2020 on strong footing and the recent Democratic sweep in the US makes
                                              a greater fiscal push more likely, leading us to lift our 2021 GDP growth forecast for the US
                                              to 5.2-5.7%, 1% above previous estimates. This marks a great divergence between the US
                                              and the rest of DM, where we have been lowering our forecasts.
                                              Markets are suddenly questioning the no inflation forever narrative, especially in the US,
                                              amid an accelerating economy. UST yields have been rising and the US curve steepening
                                              further at a very fast rate in just a few days. Market inflation expectations have also risen
                                              to two-year highs. While bond markets have been adjusting to this acceleration in the
                                              possible return of inflation narrative, equities have remained resilient. The adjustment
                                              has instead been felt in some areas of excess, such as cryptocurrency. President Biden’s
Pascal BLANQUÉ,                               proposed Covid-19 relief package, of $1.9tn, is further supporting this trend, which has
Group Chief Investment Officer                also been felt on the currency side. The USD has paused in its weakening trend since the
                                              beginning of the year, after strong moves in 2020. For investors, the reinforced reflation
                                              narrative calls for some adjustments:
                                              • Move towards a more cautious stance on duration. CBs will remain dovish, but markets
                                                are starting to price in a possible reduction in asset purchases. For the first time,
                                                discussions about potential tapering by the Fed have been making the news. This debate
                                                was kick-started by the acceleration in economic growth and the progress regarding
                                                Covid-19 vaccine programmes. But many members of the Fed consider such discussions
                                                to be premature. Chairman Powell recently reiterated the importance of not exiting too
                                                early and being careful in terms of communication on this front. A more cautious stance
                                                on duration is also recommended in the EM space, where bonds still offer valuable
                                                opportunities in the hunt for yield, though duration must be carefully managed.
Vincent MORTIER,                              • Include forms of inflation protection with liquid and illiquid assets in a year when
Deputy Group Chief Investment                   a resurgence of inflation in the US will likely be one of the key themes. The prospects
Officer                                         of a larger-than-expected fiscal boost, an acceleration in economic growth, an
                                                unleashing of pent-up demand, supply chain relocations and energy price rebounds are
                                                all elements that could further drive inflation expectations higher and lead to relative
                                                market adjustments. Inflation-linked bonds will become increasingly appealing (inflation
                                                breakeven and TIPS) as well as some real assets.
                                              • From a cross-asset perspective, equities continue to be favoured over bonds.
                                                However, investors should seek opportunities in areas supported by reflation, starting
                                                with value and more cyclical markets, such as Japan and EM, where commodity trends
                                                are also supportive. When it comes to any adjustment of expectations on rates, we see
                                                little space for strong directional moves of indices, but for leadership rotation within
                                                the indices to continue, with value stocks and interest rate and energy-sensitive stocks
                                                recovering vs high/hyper growth stocks. This rotation could see a temporary slowdown
                                                in Q1 with the activity deceleration and stricter lockdowns, especially in Europe, but the
                                                recovery trend in the medium term looks to be intact, as is the value rotation theme.
                                              • It’s important to be watchful on equities as absolute valuations are far from
  Overall risk sentiment                        appealing. In particular, should 10Y yields rise further, equity market performance will
                                                be challenged. A 1.3% level for the UST 10Y would, in our view, test the market. However,
Risk off	                       Risk on        we don’t believe we will reach this level any time soon, and instead see the most likely
                                                scenario as one of a sideways market movement cleaning up some of the excesses that
                                                the year-end rally brought. Overall, this calls for some hedging on equity exposure to
                                                mitigate downside risks.
                                              So far, the monetary factor narrative of low rates, low growth, and low inflation has been
Amid high inflation expectations,             dominant, but a different narrative, of a faster real growth catch-up, is gaining ground.
high valuations and economic                  Obviously the monetary narrative remains dominant and seems firmly grounded, but even
recovery hopes, explore relative
value across asset classes
                                              a small change would cause big noises in both bonds and, at some point, in equities. To
                                              avoid being trapped in a lose-lose game, it is important to be highly selective in the equity
Changes vs. previous month                    space by looking at attractive names able to benefit from the cyclical recovery but also
 Adjustments in equities, with               prompt longer-term earnings growth. In bonds, investors should stay active in duration
  downgrade in DM and upgrade in              management and play relative value trades (at curve and regional levels). In an era during
  EM equities and FX                          which traditional asset diversification may be challenged by rising inflation expectations,
  Cautious on US duration, from a            investors should remain agile and flexible in their allocation, and consider less
   multi-asset view                           correlated investment strategies to enhance diversification and make portfolios more
   Positive on inflation in the US           resilient to a possible regime shift.
Overall risk sentiment is a qualitative
view of the overall risk assessment
of the most recent global investment
committee.

Document for the exclusive attention of professional clients, investment services providers and any other professional of the financial industry   -3
CROSS ASSET                                                   #02
                                                                                               INVESTMENT STRATEGY

 MACRO                                     Looking beyond the recent surge in yields

                                           • As long as the 10Y UST reflects reflationary  would maintain easy conditions so as to not
                                              expectations, it could move higher.          undermine the recovery. Having said that, we
                                              However, the relative valuations case for    expect tapering in 2022, when productivity
                                              Treasuries with respect to risk assets,      gains and real growth should prove
                                              coupled with the debt-servicing cost         sustainable. But, the Fed will be careful and
                                              (given the growing debt pile), sets a cap    gradual so market dynamics and financial
                                              on the extent to which yields could rise.    stability are not negatively affected.
                                           • Based on our current macro financial          Is 1.30% a tipping point? It is difficult to
                                              forecasts, our 2021 target for the 10Y UST   say, given that unpredictable behaviour
                                              is 1.30%.                                    and investor psychology play key roles. We
Monica DEFEND,                             The Fed is committed to maintaining             therefore anchor this expectation to our
Global Head of Research                    accommodative financial conditions, but         findings on the relative attraction of equities
                                           in January, this commitment was tested as       vs bonds. The protracted unconventional
                                           markets began pricing in a larger US fiscal     monetary policy has changed the relative
                                           stimulus. As we enter 2021, markets remain      valuation pivots. Based on more than 13 years
                                           highly policy-driven and therefore vulnerable   of historical evidence, we observe a structural
                                           to any policy reversals. This explains our      break in the average of the S&P500 equity
                                           vigilant stance on risk assets and also         risk premium (ERP), lifting the average
                                           underscores the ‘market-mover’ role of          from 2% to 4% (see chart). Separately, if
                                           10Y Treasuries. In addition, the steepening     we plot historical ERPs at different levels of
                                           of the US yield curve in January shows that     10Y UST yields, we notice that the current
                                           the Fed controls the short end, where rates     yield pertains to fourth quintile of historical
                                           are close to zero. On the other hand, the       distribution of ERPs. This analysis also
                                           rise in US 30Y breakeven above 2% explains      confirms the importance of interest rate
                                           the recent increase in nominal yields: the      movements with regard to relative attraction
                                           repricing of long-term inflation breakeven      of equities vs bonds. Therefore, the move
                                           and of the inflation premium warrant some       of the 10Y yield above 1% has significantly
                                           fine-tuning of the ‘cyclical trades’ position.  reduced the valuation gap.
                                           Looking ahead, in 2021, we forecast the         The 2008 GFC introduced a different
                                           rise in long-term nominal yields to be          monetary policy framework, with CBs
                                           driven by real rates as growth rebounds in      largely expanding their balance sheets.
                                           H2. However, according to our projections,      The persistent recourse to asset purchases
                                           the Fed still has a long way to go to achieve   turned      this    ‘unconventionality’    into
                                           its inflation target. Therefore, the Fed’s      ‘conventionality,’ with market participants
                                           significant accommodations would remain,        buying-in this approach. Consequently, we
                                           with an aim to amplify fiscal boosters and the  believe, the relative valuation framework
The US yield curve                         ‘vaccine-effect’ (on economic normalisation)    must be reconsidered and investors should
may steepen mildly but                     to eventually help the CB get closer to its     accordingly adjust the discount rate of
                                           year-end inflation target. Notwithstanding      future cash flows. To conclude, in our base
the Fed’s resolve to                       the bold Asset purchase Programme (APP),        scenario, we set a cap on the US curve
                                           10Y yields continue to drift higher, even       steepening: in the short term, higher yields
maintain easy financial                                                                    might hurt the appetite for risk assets, whose
                                           though the curve-steepening remains far off
conditions and support                     previous cyclical highs. Given this context,    volatility might hamper a recovery. Long
                                           we believe there is space for only temporary    term, deeply leveraged public and private
a recovery indicate that                                                                   sectors are vulnerable to shifts in interest
                                           overshoots. Medium term, the Fed would
the central bank would                       Impact
                                           temper         ofvolatility
                                                     yields  unconventional
                                                                       on the long endmonetary
                                                                                       and rates.policy on equity risk premium
prevent any sharp
                                           Impact of unconventional monetary policy on equity risk premium
upward movements                               8%
in yields
                                               4%
                                           %

                                               0%

                                              -4%
                                                May-90 Sep-92 Jan-95 May-97 Sep-99 Jan-02 May-04 Sep-06 Jan-09 May-11 Sep-13 Jan-16 May-18 Sep-20
                                                         S&P 500 Equity Risk Premium                 Structural break average               Historical Average
                                             Source: Amundi Cross Asset Research, as on 25 January 2021. Structural break average is calculated after taking into
                                             account the Fed’s unconventional monetary policy. Chart shows historical Equity Risk Premium of S&P 500 = Earnings
                                             yield-10Y UST yield.

4-    Document for the exclusive attention of professional clients, investment services providers and any other professional of the financial industry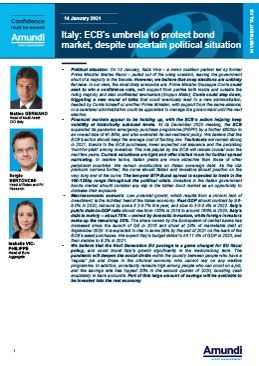
CROSS ASSET #02
INVESTMENT STRATEGY
MULTI-ASSET Carefully stabilise portfolios with
a ‘risk-on’ tilt
We believe a pro-risk stance will persist, the deficit, causing curve-steepening and
driven by expectations of a cyclical short-term increases in yields. Even from a
improvement in the economy, supported by relative standpoint vs core Europe, USTs don’t
the vaccine rollout and stimulus measures. look attractive, given the lower potential for
However, we recommend that investors additional stimulus and inflation in Europe.
be active so as to not lose sight of the However, President Biden’s measures would
big picture, as we believe it is extremely be supportive of US inflation – hence, our
crucial to monitor the US yield curve. If the optimistic view remains. We stay positive
speed and quantum of the pick-up in yield on Euro peripherals and believe investors
is not as benign as we expect, we could see could find relative value in the 30Y BTP-Bund
a material tightening in financial conditions segment in light of the ECB’s massive bond-
Matteo GERMANO, that would negatively affect risk assets. buying programme, but there is a strong need
Head of Multi-Asset Having said that, we must not forget the to monitor recent developments. Demand for
role of the Fed with respect to more QE or carry continues to support credit, but investors
even yield curve control. Overall, investors should be flexible to adjust EUR and US HY
should be selective, carefully fine-tuning exposure, according to changing conditions,
portfolios, exploring efficient hedges and without altering their overall stance. We prefer
staying vigilant with respect to lockdowns. EUR over US in IG and HY, but now believe
improving commodity prices may remove
High conviction ideas some headwinds in US HY. The search for
Earnings revisions and cyclical income allows us to keep our optimistic view
improvements in the global economy on EM debt, even though we believe the room
support our overall constructive stance on for further spread compression is limited.
equities. In DM, while we remain neutral on Importantly, investors should partially hedge
the US, we downgraded Europe and the UK US rates exposure, which could negatively
A reduction in to neutral due to a change in our stance affect returns from EM debt, due to growth/
on UK domestic stocks amid valuation inflation dynamics in the US. On EM FX, we
headwinds in the form concerns, recent lockdowns, and their slightly upgraded our positive stance, through
the Brazilian real and Mexican peso, which
of a US stimulus, a potential impact on the country’s economic
offer good carry and should benefit from US
growth. However, we remain optimistic
Euro-China deal and on Japan and Australia as both markets growth. On DM FX, however, we maintain our
view – positive the CAD/USD and NOK/EUR
Brexit enable us to keep should benefit from a rebound in the global
as commodity FX should benefit from a global
economy, and, investors should stay active.
our sectoral tilt towards These countries would also benefit from a recovery scenario.
cyclicality with some V-shaped recovery in China, on which we
Risks and hedging
upgraded our constructive view, leading to
adjustments, coupled an improvement in our positive stance on Resurgence and mutations of the virus, US-
EM overall. The current environment also China and US-EU relationships, and policy
with strong hedging mistakes could alter the reflation view. All
allows investors to readjust portfolios: Hong
Kong-listed shares provide an opportunity this, collectively, presents an opportunity
to gain exposure to China’s consumer to review portfolio protection and, where
discretionary sector, particularly because possible, remove inefficient hedges that don’t
these stocks have lagged behind some of offer a robust cost/benefit profile. However,
the mainland names. On duration, we are we believe that the case to protect equity
now cautious on the US. A Democratic exposure through gold, and derivatives and
Senate will allow President Biden to push credit exposure is well in place.
for a higher fiscal stimulus and a rise in
Amundi Cross Asset Convictions
1 month change --- -- - 0 + ++ +++
Equities
Credit
Duration
Oil
Gold
Source: Amundi. The table represents a cross-asset assessment on a 3- to 6-month horizon based on views expressed at the most recent global investment committee. The outlook, changes in outlook and opinions on the asset class
assessment reflect the expected direction (+/-) and the strength of the conviction (+/++/+++). This assessment is subject to change.
UST = US Treasury, DM = Developed markets, EM/GEM = Emerging markets, FX = Foreign exchange, FI = Fixed income, IG = Investment grade, HY = High yield, CBs = central banks, BTP = Italian government bonds, EMBI = EM Bonds Index.
Document for the exclusive attention of professional clients, investment services providers and any other professional of the financial industry -5
CROSS ASSET #02
INVESTMENT STRATEGY
FIXED INCOME Inflation dichotomy between the US
and Europe
Democrats’ thin majority in the US Congress US fixed income
has increased prospects for an expansionary
Ongoing vaccine programmes underpin a
budget, which could potentially cause a
gradual economic recovery, which doesn’t
higher deficit and debt, putting upward
bode well for USTs. On the one hand,
pressure on rates and yields. However, this
inflation expectations are rising; on the
is where we believe the Fed should step in
other, real rates are negative and the yield
to limit the steepening through its massive
curve is steepening, putting price pressure
asset purchase programmes in order to
on USTs. As a result, we remain cautious
not hamper economic growth. Hence, it is
on Treasuries, preferring TIPS, which act as
imperative today to be very active across
a diversifier and should benefit from rising
Éric BRARD, the fixed income universe, in rates, credit
inflation. However, investors should watch
and EM debt, to generate sustainable real
Head of Fixed Income out for higher taxes and regulation under
returns.
the new administration. We believe the US
Global and European fixed income consumer remains strong and highly liquid
and could unleash pent-up demand for
On duration, we remain cautious overall, services. We like agency-backed mortgages
with a negative stance in core Europe and and subordinated and esoteric ABS. Search
a neutral/slightly long position in US as a for yield remains a key story in credit –
safeguard. In addition, we are proactively more so in HY – but investors should be
managing our stance on rates and yield curve selective to safeguard against default risks
(direction, speed, quantum), particularly and defend excess income in HY. While we
the US 5Y and 10Y and the 5Y, 15Y and 30Y are positive overall on credit, we are cautious
Euro curves. We are positive on peripherals on long duration IG, as spreads have already
Yerlan SYZDYKOV, primarily through Italy BTPs, due to higher compressed to post-GFC levels.
Global Head of Emerging Markets
Impact
spread of unconventional
tightening potential vs peersmonetary in policy on equity risk premium
light of ECB support, but are mindful of the EM bonds
fluid political situation. On the other hand,
While the Biden administration’s stance
higher inflation expectations have led us to
8% towards China has yet to be assessed,
upgrade our view on US breakevens, 10Y
we stay positive on HC debt, with a skew
and 30Y even though inflation in Europe
towards HY, as it is in a better position to
remains
4% subdued.
cushion the widening effect of UST yields,
Credit remains the engine of returns in whereas this presents a risk to IG. We
this0%low-yield world. We recommend
%
are constructive on FX, and in LC, prefer
investors focus on spread compression high yielders. Importantly, Asia’s growth
instead of increasing their overall market continues to outperform, with China
risk-4%(beta), particularly in HY vs IG, BBB- and India in the lead. We now favour oil
Kenneth J. TAUBES, May-90 Sep-92
vs A-rated, andJan-95 May-97 Sep-99vs
subordinated Jan-02 May-04 Sep-06 Jan-09 May-11 Sep-13 Jan-16 May-18 Sep-20
senior exporters amid recent OPEC discussions
CIO of US Investment debt. Secondly,S&P 500 weEquity Risk Premium
believe a deterioration Structural
and break
Saudi average
Arabia’s productionHistoricalcut.
Average
Management in Source:
the quality
Amundi Crossof Asset
issuers in as
Research, Europe has 2021. Structural break average is calculated after taking into
on 25 January
been mitigated
account by government
the Fed’s unconventional and Chart
monetary policy. ECBshowsFX historical Equity Risk Premium of S&P 500 = Earnings
measures.
yield-10Y USTIn
yield.addition, a recovery in
In light of an improving environment for
companies’ financial metrics will show
cyclical assets, we are cautious USD/JPY
strong divergences, with a strong case for
and USD/CNY, and positive on the NOK vs
selection.
the EUR and CHF
Investors should note
Market’s inflation expectations in US have been rising
that credit markets
3.0 Yellen's confirmation 2.0
are expensive, but
2.0
selection, research and 1.0
Breakeven, %
Real Rate, %
relative value should 1.0
0.0
allow them to generate 0.0
-1.0
decent returns without -1.0
compromising on -2.0 -2.0
Jan-15 Jan-16 Jan-17 Jan-18 Jan-19 Jan-20 Jan-21
quality
US 10y Breakeven (L) US 10y Real Rates EUR 10y Breakeven (L) EUR 10y Real Rates
Source: Amundi, Bloomberg as on 19 January 2021
GFI= Global Fixed Income, GEMs/EM FX = Global emerging markets foreign exchange, HY = High yield, IG = Investment grade, EUR = Euro, UST = US Treasuries, RMBS
= Residential mortgage-backed securities, ABS = Asset-backed securities, HC = Hard currency, LC = Local currency, CRE = Commercial real estate, CEE = Central and
Eastern Europe, JBGs = Japanese government bonds, EZ = Eurozone. BoP = Balance of Payments.
6- Document for the exclusive attention of professional clients, investment services providers and any other professional of the financial industry
CROSS ASSET #02
INVESTMENT STRATEGY
EQUITY Relative value game to continue:
Value vs Growth
Overall assessment US equities
The resurgence of coronavirus infections We expect supportive economic policies
and subsequent lockdowns in Europe from the Biden administration, but believe
present near- term headwinds, but vaccine investors should be cautious with respect
rollouts, progress on the stimulus front, to potentially higher taxes and higher
and Impact of unconventional monetary
pent-up consumer demand offer interest policy
rates. Weon equity
continue risk premium
to believe that
some solace. For investors, the interesting a sustained rotation out of Growth/high
debates are the movement of rates/inflation momentum stocks into Value is likely in
and effect of these on the pro-cyclical and light of strong earnings improvements in
pro-value
8% tilt. Although the last two are 2021 and the vaccine rollouts. As a result,
Kasper ELMGREEN, structural stories, not all components in we are cautious on the former group and
Head of Equities these are attractive. As a result, investors are more balanced. This is because we
4%
must be very selective and agile and realise there are some downside risks, ie,
should focus on balance sheet strength. lower economic growth, policy mistakes,
%
0% spread of the virus. On a positive note, we
European equities like quality Value/cyclicals and reasonable
While we maintain a bias towards Growth stocks but think investors should
-4% be mindful of sectors/companies in which
normalisation, we realise that consensus is
May-90 Sep-92 Jan-95 May-97 Sep-99 Jan-02 May-04 Sep-06 Jan-09 May-11 Sep-13 Jan-16 May-18 Sep-20
moving towards a pro-cyclical/pro-value margins could be affected by higher input
S&P 500 Equity Risk Premium Structural
prices.break
In average
addition, the crisis Historical Average
is presenting
tilt and alarm bells are ringing in some parts
of Source: Amundi Cross
the market. Assetwe
Hence, Research,
remainasextremely stock selection opportunities as companies
on 25 January 2021. Structural break average is calculated after taking into
account the Fed’s unconventional
valuation-conscious, monetary
bottom-up, policy.
and aimChart with
to shows strong
historical business
Equity models
Risk Premium of S&Pare
500 =available
Earnings
yield-10Y
find UST yield.
cyclical value compartments offering at reasonable prices and companies
Yerlan SYZDYKOV, attractive risk/reward profiles. We stay without the ability to withstand the slow
Global Head of Emerging Markets positive on materials and have raised recovery have been left impaired. We prefer
our constructive view on financials, industrials, given they are not challenged by
primarily through high-quality insurers and the current low-rate environment, and also
exchange operators. We are optimistic on like financials as having withstood the worst
infrastructure, which we believe is a by- part of the crisis, they should benefit from
product3.0 of all the fiscal stimulus measures. potentially higher
Yellen's rates.
confirmation 2.0
Having said that, we are mindful of the need
2.0 EM equities
to remain defensive due to the uncertainty 1.0
Breakeven, %
Real Rate, %
over 1.0
the virus. We are now more constructive We are optimistic on equities, particularly
towards defensive areas, such as healthcare. on Value/cyclicals over Growth and 0.0 remain
On the 0.0 other hand, we also seek to identify positive on discretionary, industrials, and
areas where there are worrying signs and no IT and internet. In the last segment, -1.0 we
Kenneth J. TAUBES, -1.0
one knows when the music may stop. We are strongly prefer regions with attractive
CIO of US Investment cautious
-2.0 on discretionary and technology valuations, ie, Korea over China. -2.0
Management (valuation
Jan-15concerns). Finally, weJan-17
Jan-16 believe ESGJan-18We alsoJan-19 like India, Jan-20 Jan-21
Russia and Greece, but
is the single most important
US 10y Breakeven (L) trend in asset
US 10y Real Rates remain
EUR 10y very selective
Breakeven (L) and continue
EUR 10y Real Ratesto
management and the crisis has only made differentiate on the basis of valuation and
Source: Amundi, Bloomberg as on 19 January 2021
this more relevant. We are likely to see an business model strength. On the other
acceleration in investor demand, company end, we are cautious on healthcare, staples
adoption, and asset manager integration. and Chinese financials (although we like
insurers).
We believe this is the
Value vs growth performance
year of recovery but the
170
timing of normalisation
150
is not clear. Investors
Base 100 at 31 Dec 1995
130
should look for non- 110
disrupted business 90
models, leaving the 70
lowest parts (in terms 50
of quality) untouched 30
1996 1998 2000 2002 2004 2006 2008 2010 2012 2014 2016 2018 2020
World Value/Growth Europe Value/Growth US Value/Growth
Source: Amundi, Bloomberg as on 19 January 2021
Document for the exclusive attention of professional clients, investment services providers and any other professional of the financial industry -7
CROSS ASSET                                                #02
                                                                                             INVESTMENT STRATEGY

 THEMATIC                                  Taper or not taper: a key issue for markets
 GLOBAL VIEWS                              The Fed is committed to maintaining very accommodative monetary
                                           conditions and unchanged interest rates until the economy has returned
                                           to full employment and inflation has stabilised above its 2.0% target. But
                                           the Fed has so far been vague on what determines the pace of its asset
                                           purchases. It is clear that these will have to decline long before it raises its
                                           key rates. But when and on what basis? Tapering has its risks but also its
                                           benefits. The challenge for the Fed will be to steer a gradual steepening as
                                           history shows that steepening episodes can be quite abrupt and generate
                                           volatility on markets.

                                           The recent upward movement in US long-                         sooner than expected on the back of fiscal
                                           term interest rates is mainly linked to the rise               stimulus and pent-up demand, the Fed may
                                           in inflation expectations and not to the rise in               want to revisit its policy. After all, the Fed
                                           real rates. In a scenario where US GDP growth                  never pre-committed to keeping the pace
Didier BOROWSKI,
                                           is expected to accelerate (5.2 to 5.7% in our                  of its asset purchases unchanged. And it is
Head of Global Views
                                           central scenario in 2021, followed by +2.6 to                  clear that the asset purchase program must
                                           3.2% in 2022), real rates could adjust, as well.               be reduced well before the Fed increases its
                                           In this context, the Federal Reserve’s strategy                policy rates. As a result, the expected level
                                           will become a key parameter to watch, with                     of asset purchases will ultimately define the
                                           implications on portfolio construction.                        path for long-term Treasury yields this year.
                                           Since its strategic review, the Fed’s reaction                 Hence, the fear of a “taper tantrum 2.0” in
                                           function has changed. By targeting 2%                          reference to the one that occurred in April
                                           inflation on average over a cycle, the Fed aims                2013 (the 10-year yield had then risen by
                                           to anchor short-term interest rates at their                   120bp in four months on the back of Ben
                                           current level. The FOMC has also committed                     Bernanke’s announcement).
                                           not to tighten monetary conditions until the                   It is clear that it is not in the Fed’s interest to
Pierre BLANCHET,                           economy has returned to full employment                        destabilise the US bond market and the US
Head of Investment Intelligence            (defined on the basis of multiple criteria,                    financial system with it. The main argument
                                           such as minority, woman or age group                           is that there is still too much leverage in
                                           employment), and inflation prints are above                    the economy for that (federal government,
                                           target. Since June 2020, the Fed has bought                    corporations, and households). A soaring
                                           $120bn of eligible assets each month ($80bn                    debt burden would not be “sustainable” and
                                           in Treasuries and $40bn in MBS). Its balance                   could jeopardise the recovery. However, it
                                           sheet is therefore growing at a rate of nearly                 is equally clear that the Fed might consider
                                           $1500bn per year (7.5% of GDP). This balance                   it is time to reduce the degree of monetary
                                           sheet expansion is necessary to maintain                       accommodation if nominal GDP growth
                                           very accommodative monetary and credit                         accelerates and the pandemic ends. The
                                           conditions via low long-term bond yields in                    Fed never committed itself to keeping long-
                                           the recovery phase.                                            term bond yields stable. Several arguments
                                                                                                          may play in favour of “early” tapering: (i)
The Fed never                              Taper tantrum 2.0                                              avoid a decline in real rates in a recovery
committed itself to                        As the US economy emerges from the crisis,                     phase; (ii) restore a role for markets in
                                           and if inflationary pressures materialise                      anchoring inflation expectations; (iii)
keeping long-term
bond yields stable                          1/ U S Treasury 10Y - 2Y yield steepening phases
                                              3.50

                                              3.00
                                                                                                                            4
                                              2.50                       2                                3
                                              2.00

                                              1.50

                                              1.00                                                                                                      5?
                                              0.50

                                              0.00
                                                  1982    1985    1988    1991    1994     1997    2000       2003   2006       2009   2012   2015   2018    2021
                                             -0.50
                                                         1
                                             -1.00
                                             Source: Federal Reserve Bank of St Louis, Amundi Research - Data as of January 25, 2021

8-    Document for the exclusive attention of professional clients, investment services providers and any other professional of the financial industry
CROSS ASSET                                                  #02
                                                                                              INVESTMENT STRATEGY

 THEMATIC                                      Steepening phases since 1989
 GLOBAL VIEWS
                                                                               UST 10y-2y Steepening Phases

                                                      Steepening                   Steepening                     Steepening                     Today
                                                   03/1989 to 09/1992           04/2000 to 07/2003             11/2006 to 2/2010            08/2019 to 01/2021

                                                         1277                             1208                1191                                506
                                                         days                             days                days                                days

The UST yield                                       Overall steepening           Overall steepening           Overall steepening             Overall steepening
                                                            3.08                          3.27                        3.08                            1.03
curve (10y-2y) has
steepened by 300bp
over 3 years                                                2019-? Potential                          Days*                        Overall steepening
on average                                                  Average                                   1225                                3.14
                                                            Remaining                                  719                                2.11
                                                        * Calculation including market closed days
                                                                                                                       Source: Refinitiv, Amundi Research

                                              smooth out the rise in bond yields; and                  1980s witnessed a gradual transition from
                                              (iv) restore some policy space, should the               a high-inflation to a low-inflation regime,
                                              situation deteriorate again. Some FOMC                   leading to high volatility in yield-curve
                                              members have begun to discuss this                       steepness (see chart).
                                              option for 2021. The Fed needs to clarify its            During the last three episodes (89-92, 00-
                                              strategy sooner than later, since this ‘taper            03, 06-10), the YC (10y-2y) steepened with
                                              tantrum’ thematic is likely to gain ground               astonishing regularity. Indeed, the average
                                              as the GDP returns to its pre-crisis level.              length of steepening was 3.3 years with only
                                                                                                       a few months of difference for an average
                                              UST 10y-2y curve has 200bp further to                    rise of 310bp in a tight range, too. Excluding
                                              go over the next two years                               periods where the yield curve was inverted
                                              One of the many consequences of a shift of               does not change the outcome (275bp over
                                              investor’s expectations regarding a Fed’s                around three years).
                                              tapering, would be further steepness in                  The ongoing UST steepening phase started
                                              the Treasury yield curve. Therefore, the                 in September 2019. It is already a year and
                                              challenge for the Fed will be to steer a                 a half old with a 100bp move so far. Should
                                              gradual steepening of the Treasury curve,                history repeat itself, we can expect the UST
                                              as history shows that steepening episodes                YC (10y-2y) to steepen by another 200bp
                                              can be quite abrupt and generate market                  over the next two to 2.5 years. Assuming
                                              volatility.                                              that the Fed keeps rates at zero over the
                                              There have been four great episodes of                   period (Amundi’s scenario), this would mean
                                              steepening of the US Treasury yield curve                bringing the UST 10-year bond yield close to
                                              over the past 40 years. Market participants              3%. Obviously, it is not because of the yield
                                              are using several measures – from three-                 curve that long-end yields have to move, the
                                              month bills to 30-year bonds. We think that              causality is the other way round. However,
                                              the spread between UST 10y and 2y is most                it is interesting to use the yield curve as a
                                              relevant for long-term comparisons, and                  reference point to assess the minimum level
                                              we consider a steepening phase is starting               of Treasury yield over this new cycle.
                                              when the curve is fully flat or inverted.
                                              Although irrelevant for the analysis, the                                       Finalised on 26 January 2021

Document for the exclusive attention of professional clients, investment services providers and any other professional of the financial industry                  -9
CROSS ASSET #02
INVESTMENT STRATEGY
THIS MONTH’S TOPIC 2021 investment case in equities and how
Japan fits into it
Although the global recovery began to be priced in last year, the current
pro-cyclical rotation is likely to continue. Because of the dollar’s weakness,
we prefer emerging markets, but Japan has other things going for it that, at
the very least, can help balance out the portfolio.
2021, a pro-cyclical year for global sometimes to levels not seen since 2000,
equities with a notable difference between the two
periods. The 2000 PERs referred to top-
In a year of economic recovery, the risk/
of-the-cycle profits, whereas current PERs
reward ratio is generally favourable
are based on bottom-of-the-cycle profits.
to equities. Although some countries,
The recovery in profits will therefore be
particularly in Europe, are still in lockdown,
Eric MIJOT partly consumed by a fall in P/Es. However,
the month of January is starting well with
Head of DM Strategy Research liquidity provided by the central banks
the release of the vaccines, the Brexit deal,
and the low interest rate context will allow
and a Democratic victory in the US Senate
PERs to remain at sufficiently high levels
conducive to a major recovery plan.
to allow equity prices to rise between +5%
E quities will benefit from a strong and +10% over the year.
recovery in profits
T he climax of volatility was reached
With global growth expected to amount in 2020 and flows should now favour
to more than +5% in 2021, global profits equities
should rebound by more than +25% (Chart
Historically, volatility tends to decrease
1). The economic cycle has only just begun,
as profits recover. It is also a function
and the growth phase will be spread out
delayed from 18 months to two years in
over several years. Market indicators
the evolution of monetary policy (chart 2).
Claire HUANG corroborate this constructive vision. The
The high point of Fed rates having been
EM Macro Strategist dollar is weakening, which is contributing
reached in 2019, It is therefore highly likely
to the rise in inflation expectations in
that volatility will fall structurally in the
the United States, expectations that are
months and years to come.
themselves correlated to the cyclical/
defensive ratio and to industrial raw This should encourage a return of flows
materials prices, the latter itself being a to equity markets, especially as high yield
proxy for trends in global profits. spreads have tightened, and alternatives
for risky assets are therefore less generous.
P art of the recovery in profits will be
absorbed by a decline in P/Es
R isks are of course still present, but
the risk/reward ratio is favourable
Equity markets anticipated an economic
recovery as early as 2020 following There are three kinds of risks. By far the
the strong support of central banks most dangerous would be doubts cast
and governments and the November on the vaccine’s effectiveness and an
announcement of the arrival of the vaccines uncontrolled resurgence of the virus.
just after the US elections. As profits fell at Beyond this black swan, a second type
the same time, P/Es rose to extreme levels, of risk would be a delay in the economic
1/ E PS Growth
40
30
Equity markets 20
are likely to end the
10
year higher than
0
they began it
-10
-20
-30
-40
2018 2019 2020 2021 2022
USA Europe Japan Pacific Ex Japan EM
Source: Ibes, Datastream, Amundi Research - Data as of January 20, 2021
10 - Document for the exclusive attention of professional clients, investment services providers and any other professional of the financial industry-30
-40
2018 2019 2020 2021 2022
USA Europe CROSS ASSET
Japan Pacific Ex Japan EM #02
INVESTMENT STRATEGY
Source: Ibes, Datastream, Amundi Research - Data as of January 20, 2021
2/ V IX and Fed rates
THIS MONTH’S TOPIC
40
10
35
8
30
6
25
20
4
15 2
40
30
10 0
20 1990 1992 1994 1996 1998 1999 2001 2003 2005 2007 2009 2010 2012 2014 2016 2018 2020 2021
10 Fed Rates Lag 2Y (Right Scale) VIX (6M Moving Average) VIX
Source: Datastream, Amundi Research - Data as of January 20, 2021
0
recovery
-10 (caused by lockdowns, balance the risk of a portfolio, by accepting
delayed vaccinations, etc.). This would a longer-term investment horizon and as
-20
rather7.5 create opportunities insofar as long as it is not overpaid. Geographically,
-30
central banks and governments remain this is reflected in a preference for emerging
supportive.
-405.0 markets especially since currencies have
Finally, the 2018 third type of risk 2019consists, on 2020 broken out against 2021 the US dollar.
2022 However,
the2.5contrary, particularly in China and/ Japan and the euro zone, also cyclical and
USA Europe Japan value, Pacific Ex Japan
should EMwell at least initially.
also do
or the United States, in the possibility
Source: Ibes, Datastream, Amundi
that the recovery would be sufficientlyResearch - Data as of January 20, 2021
0.0
underway to envisage a withdrawal of Often atypical, the case of Japan
The pro-cyclical support. However, while central banks seems interesting to us to highlight
may -2.5 well end up being tested by the
rotation is likely
A two-track economic recovery
markets in this respect, it is likely that their
to continue initial
-5.0 response will be rather reassuring.
40 Despite the winter pandemic outbreak
12/2015 12/2016 12/2017 12/2018 we note 12/2019
in Japan, that external 12/2020
demand
H ow to apply this pro-cyclical 10
35 Domestic orders gained Overseas further
orders momentum in Q4. Overseas
approach in an equity portfolio? machine tool orders grew by 15.9% YoY in
Source: Economic and Social Research Institute, CEIC, Amundi Research as of January 14, 2021 8
In 30terms of style, small caps are a great Q4 after two years of contraction, while
candidate. This asset class, which always domestic demand stumbled (Chart 3). The
outperforms at the start of the cycle, has Japanese market appears to be shrugging 6
25
already rebounded well, but its potential off the latest deterioration in mobility data,
has150not yet reached its limits. As for the and focusing more on the economy’s global 604
20
Value style, which is lagging behind other demand exposure as well as the structural
100
cyclicals, it offers attractive potential for push by Suga administration towards 552
15 digitalisation and carbon neutrality. So,
catching
50 up. Finally, economic recoveries
are usually not favourable for quality stocks, unlike the European markets, the MSCI
100given the low level of rates and the 500
but Japan more than erased the decline
1990 1992 1994 1996 1998 1999 2001 2003 2005 2007 2009 2010 2012 2014 2016 2018 2020 2021
ongoing
-50 disruption, we believe that this triggered by the pandemic in 2020 and
style, as well Fed Rates
as ESGLag 2Y (Right Scale)
equities, constitutes VIX ended the Average)
(6M Moving year with recordsVIX 45
(+7% in 2020,
Source: Datastream, Amundi Research
a valid complement to cyclical stocks to
-100 - Data as of January 20,against
2021 -4% in Europe and +19% in the
40
-150
3/ Japan’s machine tool orders: domestic versus overseas
-200
7.5 35
12/1998 12/2000 12/2002 12/2004 12/2006 12/2008 12/2010 12/2012 12/2014 12/2016 12/2018 12/2020
5.0 Corporate profits (s.a., %yoy) Global manufacturing PMI (RHS)
Source: Ministry of Finance, CEIC, JPM, Amundi Research as of January 12, 2021
2.5
0.0
-2.5
-5.0
12/2015 12/2016 12/2017 12/2018 12/2019 12/2020
Domestic orders Overseas orders
Source: Economic and Social Research Institute, CEIC, Amundi Research as of January 14, 2021
Document for the exclusive attention of professional clients, investment services providers and any other professional of the financial industry - 11-2.5
-5.0
12/2015 12/2016
CROSS ASSET
12/2017 12/2018 12/2019 #02
12/2020
INVESTMENT STRATEGY
Domestic orders Overseas orders
Source: Economic and Social Research Institute, CEIC, Amundi Research as of January 14, 2021
4/ Japan’s profit growth and global PMI
THIS MONTH’S TOPIC
150 60
100
55
50
0 50
-50 45
-100
40
-150
-200 35
12/1998 12/2000 12/2002 12/2004 12/2006 12/2008 12/2010 12/2012 12/2014 12/2016 12/2018 12/2020
Corporate profits (s.a., %yoy) Global manufacturing PMI (RHS)
Source: Ministry of Finance, CEIC, JPM, Amundi Research as of January 12, 2021
United States). The Nikkei index has even a little less than for emerging markets
returned to its August 1990 level, which is (2.9x) but more than for the United States
still 30% off its all-time high of December (1.9x) and Europe (1.1x).
1989, but shows that structural changes
underway in Japan are paying off.
A n attractive valuation
Since the 1980s bubble burst, the
A n obvious candidate for a cyclical
stratospheric PER of the Japanese market
recovery
has gradually converged downwards
In fact, Japan’s corporate profits tend towards the level of the PERs of other
As a cyclical and to move in tandem with the global developed markets in the early 2000s
cycle, making it an ideal candidate for (chart 5). Today, roughly equivalent to that
inexpensive market, the cyclical recovery trade. With global of the euro zone (17.8x against 17.4x for
Japan has something PMI firming up, Japan’s corporate profit the MSCI EMU), it posted a 23% discount,
growth started to recover in Q3 and is compared to the 12-month forward PER
to offer expected to strengthen further (Chart of the US market (23.1x). Adjusted for
4). Rebased to 100 in 2019, MSCI Japan’s the cycle, the discount even reaches 35%
profits should rebound, according to (CAPE at 22.1x, against 33.8x for the United
IBES, to 137 in 2022, i.e., a little less than States). Supplemented by other valuation
emerging markets (148) but more than measures, such as Dividend Yield, Price
the United States (125) and Europe (112). Cash-Flow and Price to Book Value within
The sector composition of the Japanese a composite indicator, it also appears more
market also makes it better positioned to attractive than its competitors’.
ride the global cyclical recovery. The top
two sectors of the market are industrials
D ebt under control at company level
and consumer discretionary, which Japanese companies started to deleverage
account for, respectively, 21% and 18% of after the bubble burst in the late 1980s.
the MSCI index, or 39%, against 22% for the The Asian crisis of 1997, the bursting
world average. In total, cyclical sectors, of the internet bubble, and the Great
including technology, amount to 2.3 times Financial Crisis have only encouraged this
the weight of defensive sectors. Certainly, fundamental movement. The net debt
5/ 1 2 Months Forward PER
65
55
45
35
25
15
5
01-95 09-96 05-98 01-00 09-01 05-03 01-05 09-06 05-08 01-10 09-11 05-13 01-15 09-16 05-18 01-20
S&P500 PER MSCI Europe PER TOPIX PER
Source: Ibes, Datastream, Amundi Research, data as of January 20, 2021
12 - Document for the exclusive attention of professional clients, investment services providers and any other professional of the financial industryCROSS ASSET #02
INVESTMENT STRATEGY
of non-financial companies vs. balance are greater than this risk, especially since
THIS MONTH’S TOPIC sheet assets, for example, has halved the regular purchases of ETFs by the BoJ,
over the past 20 years (from 30% to 15% especially in downturns, help reduce the
according to Worldscope). This is despite market volatility.
the fact that distributions to shareholders
have increased at the same time, notably Conclusion
due to buybacks, authorised since 2001 Although the global economic recovery
and encouraged by Prime Minister Abe, was priced in as early as 2020, it should
something that has also helped to improve materialise in 2021. Part of the rebound
the appeal of Japanese equities. The in profits will be absorbed by the fall
financial situation of Japanese companies in PERs, but, provided that monetary
has therefore improved considerably. and government policies remain
T he risk? A correlation to the yen, accommodative, as we believe they will,
which could act as a headwind equity markets are expected to end the
year higher than they started. The ongoing
The link between the relative performance pro-cyclical rotation should also continue.
of the Japanese index and the MSCI Regionally, while the weakness of the
World is resistant. The Japanese market dollar makes us prefer emerging markets,
underperforms when the yen appreciates Japan has other interesting arguments to
against the dollar and vice versa. In surprise on the upside this year or at least
a context of a downward trend in the to help balance a portfolio. It is indeed very
greenback, this parameter, without being cyclical, attractively valued, with a sound
strongly negative, does not therefore work financial situation at the company level,
in favour of the Japanese market. In the end, and lower volatility than elsewhere.
however, it seems to us that the strengths
of Japan in this phase of economic recovery Finalised on 20/01/2021
Document for the exclusive attention of professional clients, investment services providers and any other professional of the financial industry - 13CROSS ASSET #02
INVESTMENT STRATEGY
THEMATIC Why we don’t expect the Fed to taper its bond
buying programme this year
In a world where sovereign bond yields are in the hand of central banks,
the recent upward revisions of growth expectations for the US economy
raised questions about the outlook for the Fed’s monetary policy. Growth
is expected to rebound in H2 and very accommodative monetary policy is
not a free lunch. The difficulty for the Fed is estimating how sustainable this
expected improvement in growth and inflation will be in H2 2021. We expect
the Fed to keep a cautious approach and we believe tapering is more likely in
2022 when the core PCE index will have made significant progress towards
the objective of a sustainable increase to an average of 2% or higher.
Commentary from two regional Fed the economy to operate longer at lower
Valentine AINOUZ
presidents, Robert Kaplan (Dallas) and interest rates. Base effects will be strong: we
Deputy Head of Developed
Raphael Bostic (Atlanta), has led to market will see inflation temporarily overshooting
Markets Strategy Research
speculation that the Fed might reduce its the 2% target as well as a rapid improvement
bond purchases sooner than anticipated. In in the labour market.
response, members of the Governing Council However, a very accommodative monetary
sought to allay any concerns that the Fed may policy is not a free lunch: low borrowing
soon taper its bond purchase programme. costs could contribute to asset bubbles,
What is our view? overreliance by companies and households
on cheap debt and growing inequalities.
We agree that the Fed will need at some The Covid-19 crisis has accelerated the
point to reduce the pace of its asset already existing fragmentation of the US
purchases economy. The damage caused by this crisis is
We expect the US economy to rebound disproportionately concentrated on certain
Delphine GEORGES strongly in H2 2021. The economy is industry groups and small businesses.
likely to accelerate next spring, as herd Indeed, large companies in specific sectors
Senior Fixed Income Strategist
immunisation will allow the reopening of the like technology and healthcare have
consumer services that account for most of outperformed in recent years and have not
the remaining output gap. In addition, this suffered from the crisis. The US is currently
recovery will be supported by three other a two-speed economy.
factors. (1) The new Biden administration • Small companies, lower quality issuers
is clearly inclined to maintain significant and cyclical sectors should show
government support. Janet Yellen, the new more balance sheet discipline. These
Treasury secretary, voiced strong support businesses have accumulated debt due to
for Joe Biden’s $1.9tn relief package, arguing the decline in economic activity and are
that “with interest at historical lows, the now more leverage-constrained. Keeping
smartest thing we can do is act big”. (2) The rates low is necessary to facilitate
pandemic has resulted in record US savings deleveraging of these companies.
“We have to make rates, but mostly for households with the • On the other hand, companies in the
highest incomes. This should fuel a mid- tech sector could be encouraged by the
significant progress year consumption boom and support asset central bank’s new framework to take
towards that goal. This valuations. (3) The Fed will maintain an on more debt as the economic climate
accommodative monetary policy. Changes improves. Undeniably, despite the crisis,
does not necessarily US 10‐year
to the Fed’s policy framework will treasory
likely allow yieldthese
versussectors have seen a jump in their
mean that we have to 1/ U Total marketable
S 10-year treasury US treasury debt
yield versus
get to that point” Total marketable US treasury debt
(Raphael Bostic)
20,000
5
4
15,000
3
10,000
2
5,000
1
0 0
2005 2006 2008 2009 2011 2012 2014 2015 2017 2018 2020 2021
Total marketable US treasury debt (in bn $) US Generic Govt 10 Yr (Rhs, in %)
Source: Bloomberg, Amundi Research - Data as of January 2021
14 - Document for the exclusive attention of professional clients, investment services providers and any other professional of the financial industryCROSS ASSET #02
INVESTMENT STRATEGY
M&A activities and asset valuations. At investors is why interest rates are rising.
THEMATIC some stage, the Fed may start to worry Rising rates are positive for markets if they
about financial conditions being too are expanding because of a sustainable
accommodative for this segment of the improvement in real growth. Rising
economy, leading to excesses. rates are negative for markets if they are
The Federal Reserve’s general view is expanding because of excess supply amid
that financial risks are manageable at the lower support from central banks. Clearly,
moment, notwithstanding “some issues” the Fed would welcome higher yields
related to high levels of corporate debt and without a tightening of financial conditions.
elevated pricing for commercial real estate. This is exactly what has happened in recent
weeks and it has confirmed the credibility
A difficult task of its monetary policy.
“Now is not the time The difficulty for the Fed is estimating how We expect the Fed to keep a cautious
sustainable the expected improvement in approach
to be talking about exit. growth and inflation will be in H2 2021. This
is not an easy assessment for two reasons. The forward guidance attached to the QE
I think that is another is very vague and leaves the Fed a lot of
First, most of the factors supporting the
lesson of the global expected rebound in growth in the second flexibility. Asset purchases should remain in
half of 2021 will be temporary by nature. place “until substantial further progress has
financial crisis, is be Second, the huge upcoming budget support been made toward the Committee’s maximum
careful not to exit makes the exercise even more difficult. The employment and price stability goals”.
strategic question is whether this huge fiscal No pre-emptive tightening with the new
too early” spending will help to increase the potential policy framework. The Fed is committed
(Jerome Powell) growth of the US economy. If it does, the to an inflation overshoot under its new
US economy will be able to absorb a rise in Flexible Average Inflation Targeting (FAIT)
interest rates. Otherwise, the US economy regime. The Fed’s new reaction function
will simply need more support from the implies that some inflation must be evident
Fed to guarantee accommodative financing before raising rates, rather than simply
conditions despite high government deficit! forecasting it to rise. The FOMC will aim
No room for mistakes: the US economy to push unemployment as low as possible,
is highly sensitive to a rise in interest at least until inflation pressures appear.
rates. The crisis has been characterised The maximum employment objective is “a
by very successful coordinated action by broad-based and inclusive goal”.
governments and central banks to limit We believe tapering is more likely in 2022
the long-term damage to our economies. when the core PCE index will have made
Central bank liquidity injections combined significant progress towards the objective
with government debt guarantees have kept of a sustainable rise to 2% or higher. We
funding conditions accommodative despite do not expect the Fed to pre-emptively
the historical contraction in GDP. However, taper its accommodative policy. Inflation
we will emerge from this crisis with a much is expected to temporarily rise above 2%
higher level of debt and high asset prices. in Q2 2021 due to significant base effects,
As a result, a small upward move in interest but the Fed will have to see sustainable
rates today would have a bigger impact than progress in the underlying inflation trend
in past cycles on corporate debt, the equity before tapering, which is more likely in 2022.
market and real estate markets. We do not expect supply to be a driver for
The market’s reaction is key! The Fed is rates. We expect higher rates because of an
committed to maintaining accommodative improvement in growth/inflation forecasts.
financing conditions: rates should rise
for good reasons! The key question for Finalised on 27 January 2021
2/ Treasury securities held by the Federal Reserve
5
4.5
4
3.5
3
2.5
2
1.5
1
0.5
0
Aug-07 Feb-09 Aug-10 Feb-12 Aug-13 Feb-15 Aug-16 Feb-18 Aug-19 Feb-21
Source: Bloomberg, Amundi Research, Data as of 27 January 2021
Document for the exclusive attention of professional clients, investment services providers and any other professional of the financial industry - 15You can also read