ICES WGSFD REPORT 2018 - HUMAN ACTIVITIES, PRESSURES AND IMPACTS STEERING GROUP Report of the Working Group on Spatial Fisheries Data (WGSFD)
←
→
Page content transcription
If your browser does not render page correctly, please read the page content below
ICES WGSFD REPORT 2018
H UMAN A CTIVITIES , P RESSURES   AND I MPACTS   S TEERING G ROUP

                                  ICES CM 2018/HAPISG:16

                                        R EF . ACOM, SCICOM

   Report of the Working Group on
      Spatial Fisheries Data (WGSFD)

                                    11-15 June 2018

                       Aberdeen, Scotland, UK
International Council for the Exploration of the Sea
Conseil International pour l’Exploration de la Mer
H. C. Andersens Boulevard 44–46
DK-1553 Copenhagen V
Denmark
Telephone (+45) 33 38 67 00
Telefax (+45) 33 93 42 15
www.ices.dk
info@ices.dk

Recommended format for purposes of citation:

ICES. 2018. Report of the Working Group on Spatial Fisheries Data (WGSFD), 11–15
June 2018, Aberdeen, Scotland, UK. ICES CM 2018/HAPISG:16. 79 pp.

The material in this report may be reused for non-commercial purposes using the
recommended citation. ICES may only grant usage rights of information, data, imag-
es, graphs, etc. of which it has ownership. For other third-party material cited in this
report, you must contact the original copyright holder for permission. For citation of
datasets or use of data to be included in other databases, please refer to the latest
ICES data policy on ICES website. All extracts must be acknowledged. For other re-
production requests, please contact the General Secretary.

The document is a report of an Expert Group under the auspices of the International
Council for the Exploration of the Sea and does not necessarily represent the views of
the Council.

© 2018 International Council for the Exploration of the Sea

ICES WGSFD REPORT 2018                                                                                                                               | i

C o nten ts

       Executive summary ................................................................................................................ 3

       1      Administrative details .................................................................................................. 4

       2      Terms of Reference ........................................................................................................ 4

       3      Summary of Work plan ................................................................................................ 5

       4      Summary of Achievements of the WG during 3-year term ................................... 6

       5      Final report on ToRs, workplan and Science Implementation Plan .................... 7
              5.1      ToR A: Develop robust methods to calculate DCF environmental
                       indicators 5, 6 and 7 .............................................................................................. 7
              5.2      ToR B: Work on standardized methods to analyse, and produce
                       products that describe, the fishery in space and time ..................................... 7
              5.3      ToR C: Review ongoing work for analyzing spatial fisheries data ................ 9
              5.4      ToR D: Initiate innovative methods to analyze spatial fisheries
                       data ....................................................................................................................... 12
              5.5      ToR E: Further development of fishing intensity/ pressure
                       mapping ............................................................................................................... 12
              5.6      ToR F: Produce spatial fishery distribution product on a specific
                       fishery ................................................................................................................... 12
              5.7      ToR G: Produce impact maps by combining and evaluating
                       benthic information on sensitivity (from WGDEC, BEWG,
                       WGMHM) together with fishing pressure maps ........................................... 13
              5.8      ToR H: Using NEAFC VMS and catch data, describe “fisheries
                       activities in and in the vicinity of such (VME) habitats” (areas
                       defined by WGDEC) within the NEAFC Convention Area in 2015 ............ 13
              5.9      ToR I: Develop methods to estimate fishing activity and/or effort
                       of static gears using from positional data, logbook data, observer
                       data and questionnaires ..................................................................................... 13
              5.10 ToR J: Quantify and explain the spatiotermporal variability of
                   fishing fleets across the ICES areas .................................................................. 18
              5.11 ToR K: Present best-practices on how to analyse and use VMS data
                   from a world-wide perspective......................................................................... 22
              5.12 ToR L: WGSFD 2018 is requested to do prepatory work for the EU
                   request to ICES on advising on appropriate methods to assess the
                   spatial extent and distribution of physical disturbance pressures
                   on the seabed ....................................................................................................... 23

       6      Cooperation .................................................................................................................. 30

       7      Summary of Working Group self-evaluation and conclusions .......................... 30

       Annex 1: List of participants............................................................................................... 31

       Annex 2: Recommendations ............................................................................................... 34
ii |                                                                                                     ICES WGSFD REPORT 2018

       Annex 3: WGSFD resolution 2019–2021 ........................................................................... 35

       Annex 4: WGSFD self-evaluation 2016–2018................................................................... 39

       Annex 5: Examples (ToR I) ................................................................................................. 42

       Annex 6: Audit trail of VMS data processing and quality ........................................... 58

       Annex 7: Updated Maps of Fishing Activity in the NEAFC Regulatory
          Area, 2017 ...................................................................................................................... 60

       Annex 8: Technical minutes from the Review Group Vulnerable Marine
          Ecosystems (RGVME) ................................................................................................. 74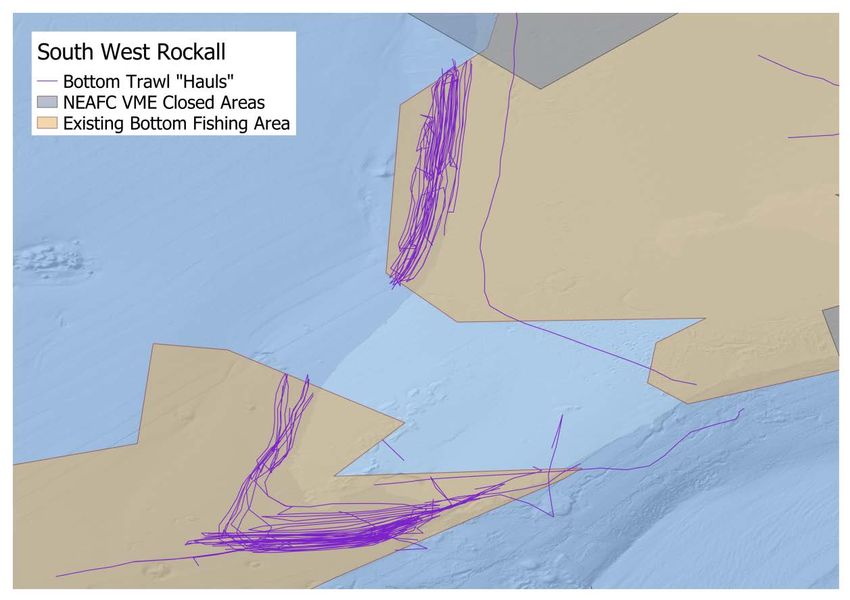
ICES WGSFD REPORT 2018                                                                        | 3

Executive summary

       The Working Group on Spatial Fisheries Data (WGSFD) met at JNCC, Aberdeen, Scot-
       land, UK, 11–15 June 2018. ICES had issued a data call for aggregated VMS and logbook
       data for the years 2009–2017 (updates for 2009–2016, new data for 2017).
       In preparation to the meeting, the ICES secretariat in collaboration with WGSFD had
       prepared a Quality-Control document that processed submitted Member State data and
       generated indicators that were carefully scrutinized by WGSFD experts for quality. In
       case concern was raised, data submitters were consulted and asked to revise and resub-
       mit data if necessary (see Annex 6). This substantially improved understanding potential-
       ly outlying data and the data quality as a whole. The ICES data centre facilitated this
       entire process. At the meeting, the products for OSPAR were reviewed by the WGSFD
       group where no mistakes were highlighted. The ICES data centre will hence publish
       OSPAR results.
       Furthermore, the group was updated on a number of VMS/AIS/Logbook related projects,
       which are ongoing at national labs, including presentations on the use of AIS and VMS,
       the analyses of static gears, the use of VMS and logbook data in spatial stock assessments
       and the quantification of repetitive trawling intensities.
       On request by NEAFC, members of WGSFD had analysed produced maps of fishing
       activity in NEAFC areas using the VMS and logbook information collected by NEAFC. A
       product was delivered to ICES WGDEC, which was used to advice on the impact of fish-
       eries on Vulnerable Marine Ecosystems.
       Furthermore, WGSFD addressed Terms of Reference on methodology to assess static
       fishing gears, quantifying and explaining the spatio-temporal variability of fishing fleets,
       best practice on analysing VMS data, and contributing to the preparation of an EU re-
       quest to advise on appropriate methods to assess the spatial extent and distribution of
       physical disturbance pressures on the seabed. In addition, WGSFD explored if it would
       be possible to publish fishing effort or seafloor abrasion maps to the greater ICES public.
       Given potential sensitivity the group could not conclude on this as yet.
       WGSFD has the ambition to publish peer-reviewed papers on two of the ToRs dealing
       with quantifying and explaining the spatio-termporal variability of fishing fleets across
       the ICES areas and to present best-practices on how to analyse and use VMS data from a
       world-wide perspective. Analyses were carried out at WGSFD to contribute to these
       manuscripts.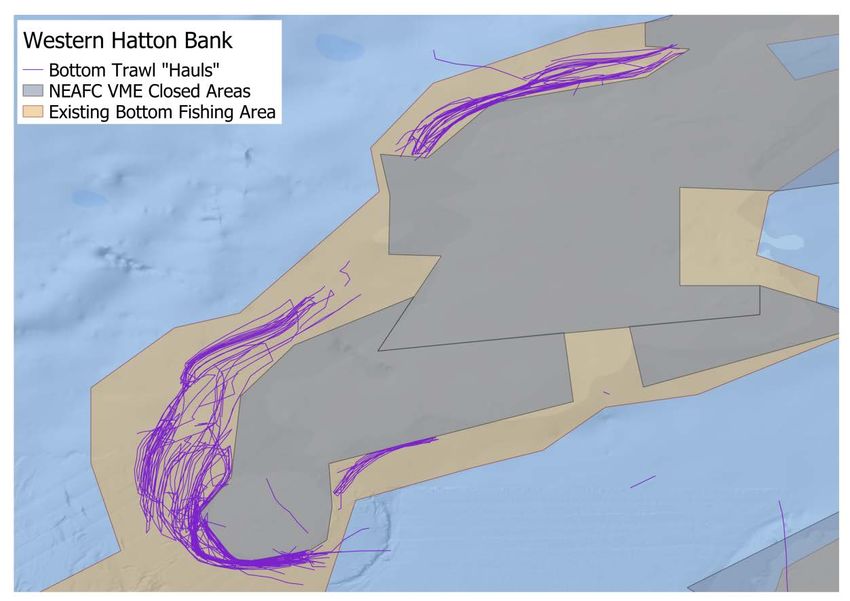
4 |                                                                               ICES WGSFD REPORT 2018

1     Administrative details

      Working Group name

      Working Group on Spatial Fisheries Data (WGSFD)

      Year of Appointment within current cycle

      2016

      Reporting year within current cycle (1, 2 or 3)

      3

      Chair(s)

      Niels Hintzen, the Netherlands
      Christian von Dorrien, Germany

      Meeting dates and venues

      17–20 May 2016, Brest, France
      29 May – 2 June 2017, Hamburg, Germany
      11–15 June 2018, Aberdeen, Scotland, UK

2     Terms of Reference

      A          COMPLETED - DEVELOP ROBOUST METHODS TO CALCULATE DCF ENVIRONMENTAL
                 INDICATORS 5, 6 AND 7.

      b          Work on standardized methods to analyse, and produce products that describe, the fishery
                 in space and time

      c          Review ongoing work for analyzing spatial fisheries data.

      d          Initiate innovative methods to analyze spatial fisheries data.

      e          Completed - 2016/1: Further development of fishing intensity/ pressure mapping.

                 Following on from the format of the previous OSPAR requests; OSPAR requests ICES, using
                 the latest versions of the indicator description/summaries of the ‘Extent of Physical damage
                 indicator’ (BH3), to:
                     •    Collect relevant national VMS and logbook data for 2014. The data request should
                          follow same format as last’s year and include any amendments following the WG
                          SFD meeting in June 2015;
                     •    Estimate the proportions of total fisheries represented by the data;
                     •    Using methods developed in previous advice, where possible, collect other non-
                          VMS data for 2014 to cover other types of fisheries (e.g. fishing boats < 12m length);
                     •    Prepare maps for the OSPAR maritime area (including ABNJ) on the spatial and
                          temporal intensity of fishing using mobile bottom contacting gears;

                     •    Provide advice on the development and application of alternative smaller grids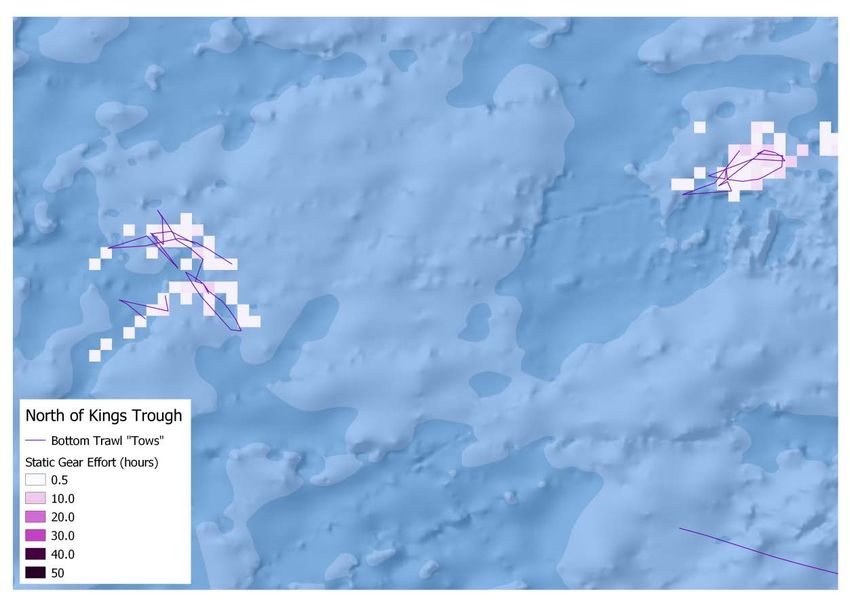
ICES WGSFD REPORT 2018                                                                                               | 5

                              (smaller resolution than 0.05°) to improve the analysis of fishing abrasion data:
                                  o What data and methods can be used for regional assessments, including
                                        pros and cons on data accessibility, and costings, if possible;
                                  o Explore any alternative approaches such as the “Nested grid approach",
                                        to ascertain if it can be used to provide supporting data to refine and cali-
                                        brate the abrasion fishing layers. This can be done using a case study or
                                        pilot area.
                         •    Provide advice on the applicability and use of AIS data, in particular to:

                                   o     Ascertain if it can be used as supporting information for the spatial analy-
                                         sis of fisheries data;
                                   o     Indicate if it can be used as an alternative source of data to VMS;
                                   o     Indicate potential costing for the collation and management of AIS data;
                                   o     Advice can be based on a case study or pilot area.
       f            Completed -Produce spatial fishery distribution product on a specific fishery -
                    (Advisory request)

       g            Completed -Produce impact maps by combining and evaluating benthic information on
                    sensitivity (from WGDEC, BEWG, WGMHM) together with fishing pressure maps (fishing
                    abrasion, weight and value of landed catch), taking into account differences in benthic
                    impact of the various fishing gears / metiers.

       h            Completed -Using NEAFC VMS and catch data, describe “fisheries activities in and in the
                    vicinity of such (VME) habitats” (areas defined by WGDEC) within the NEAFC Convention
                    Area in 2015. If possible, descriptions should be made of each area near such habitats, and
                    separate each bottom contact gear type (e.g. static or mobile gears).

                    Provide a technical document that can be used to discuus a revision of the NEAFC VMS
                    agreement with ICES, and ANNEX VII (4) of the NEAFC Scheme of Control and
                    Enforcement (Jan–Jun 2015).

       i            Develop methods to estimate fishing activity and/or effort of static gears using from
                    positional data, logbook data, observer data and questionnaires

       j            Quantify and explain the spatio-termporal variability of fishing fleets across the ICES areas.

       k            Present best-practices on how to analyse and use VMS data from a world-wide perspective.

       l            WGSFD 2018 is requested to do prepatory work for the EU request to ICES on advising on
                    “appropriate methods to assess the spatial extent and distribution of physical disturbance pressures on
                    the seabed (D6C2 of the Commission Decision 2017/848/EU)”.

3      Summary of Work plan

           Year 1            Continuing WGSFD work from 2013–2015 on improving methods and ensuring high
                             quality of VMS/logbook data processing from data request formats, quality checks and
                             processing data to be implemented by the ICES data centre. Improving methods to
                             calculate fishing intensity and inititiate development of innovative methods to analyse
                             spatial fisheries data, including the sandeel fishery in the North Sea as a case study.
                             A request from OSPAR is expected again in 2016.
                             Invite an expert on DCF indicators.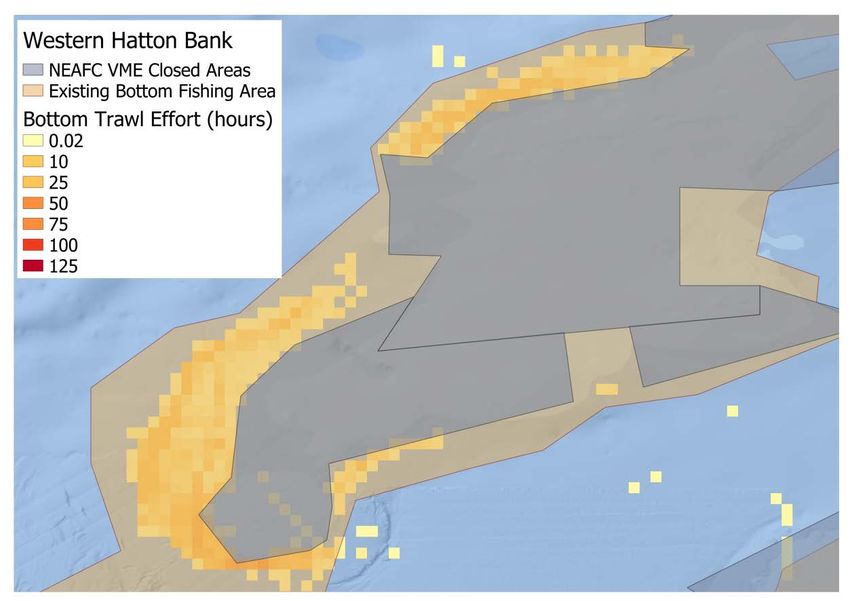
6 |                                                                       ICES WGSFD REPORT 2018

        Year 2        Continuing WGSFD work from 2013–2015 on improving methods and ensuring high
                      quality of VMS/logbook data processing from data request formats, quality checks and
                      processing data to be implemented by the ICES data centre. Improving methods to
                      calculate fishing intensity and inititiate development of innovative methods to analyse
                      spatial fisheries data.
        Year 3        Continuing WGSFD work from 2013–2015 on improving methods and ensuring high
                      quality of VMS/logbook data processing from data request formats, quality checks and
                      processing data to be implemented by the ICES data centre. Improving methods to
                      calculate fishing intensity and inititiate development of innovative methods to analyse
                      spatial fisheries data.
                      Advisory request under ToR l)

4     Summary of Achievements of the WG during 3-year term

        •   Develop robust methods to calculate DCF environmental indicators 5,6 and 7:
            WGSFD calculated and performed sensitivity tests on different methods to cal-
            culate the DCF indicators. These activities were concluded in 2017.
        •   Work on standardized methods to analyse and produce products that describe
            the fishery in space and time: WGSFD refined the workflow over the years that
            can be used as a template by member states to address the annual ICES data-
            call on VMS and logbook data. Furthermore, WGSFD designed the methods to
            further process the VMS and logbook data to calculate sea-floor abbrasion.
            Products have been used by OSPAR, HELCOM, Sandeel benchmark, WGDEC,
            BEWG, WGMHM and different ADGs such as ADGFBI, ADGVME.
        •   Review ongoing work for analyzing spatial fisheries data: Each year at
            WGSFD presentations were given by members on intersessional activities and
            developments in their labs. Short descriptions of these activities are desribed
            in the annual reports.
        •   Develop methods to estimate fishing activity and/or effort of static gears: Sev-
            eral intersessional activities were undertaken to investigate how best to ana-
            lyse static gears. WGSFD has not concluded on a standardized approach yet
            on how these data could be incorporated in the regular workflow.
        •   Quantify and explain the spatio-temporal variability of fishing fleets across the
            ICES areas: WGSFD has collated data and designed methodology to analyse
            the spatio-temporal variability of fishing fleets in ICES areas. A statistical
            model has been designed and appropriate co-variate data been collected. In-
            tersessionally results will be prepared.
        •   Present best-practices on how to analyse and use VMS data from a world-wide
            perspective: A literature study and extensive discussions were undertaken at
            WGSFD to condense best practices on VMS data analyses. Intersessionally re-
            sults will be gathered and turned into a manuscript.
        •   WGSFD has demonstrated how AIS data could be used in analyses relating to
            the spatial and temporal distribution of fishing, through a number of presenta-
            tions and discussions. Recommendations on how to progress in this field are
            given.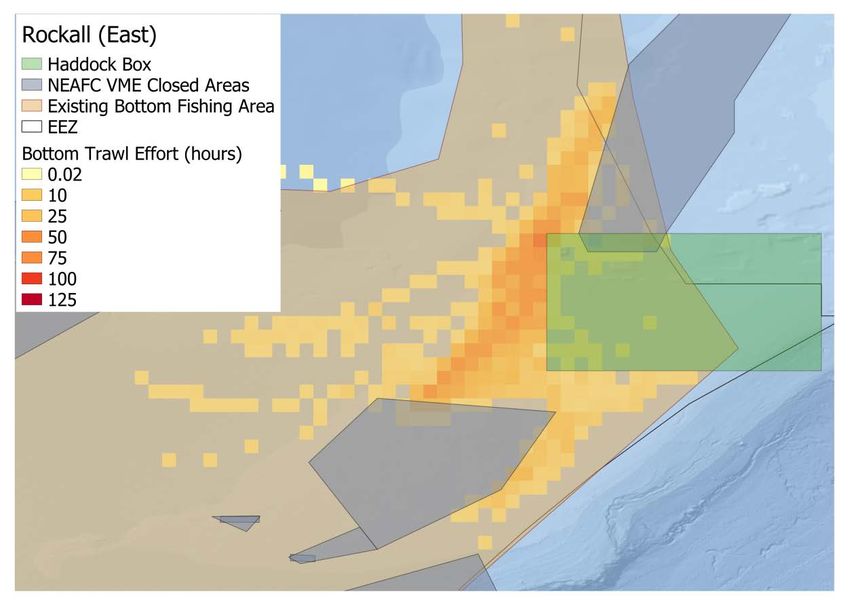
ICES WGSFD REPORT 2018                                                                       | 7

5      Final report on ToRs, workplan and Science Implementation Plan

5.1    ToR A: Develop robust methods to calculate DCF environmental indicators
       5, 6 and 7
       WGSFD calculated and performed sensitivity tests on different methods to calculate the
       DCF indicators. These activities were executed and discussed in 2016 and 2017 and are
       hence reported extensively in the interim reports. WGSFD showed how different indica-
       tors could be calculated taking different assumptions on e.g. aggregation of fishing inside
       a gridcell. Tables on these indicators were produced and showed the time- and ecoregion
       changes in the spatial extent of fishing, areas not impacted by mobile bottom gear and
       the aggregation of fishing activities. These methods were made publicly available as
       equations within the WGSFD reports and as R/SQL scripts at the working group SFD
       github (https://github.com/ices-eg/wg_WGSFD/tree/master/DCF%20indicators).
       Interim deliverables on Tor A are described in the WGSFD interim report of 2016:
       http://ices.dk/sites/pub/Publication%20Reports/Expert%20Group%20Report/SSGEPI/2016
       /01%20WGSFD%20-
       %20Report%20of%20the%20Working%20Group%20on%20Spatial%20Fisheries%20Data.
       pdf
       And final deliverables on ToR A in the WGSFD interim 2017 report:
       http://www.ices.dk/sites/pub/Publication%20Reports/Expert%20Group%20Report/SSGE
       PI/2017/01%20WGSFD%20-
       %20Report%20of%20the%20Working%20Group%20on%20Spatial%20Fisheries%20Data.
       pdf

5.2    ToR B: Work on standardized methods to analyse, and produce products
       that describe, the fishery in space and time
       The quality of the outputs produced by the ICES secretariat and WGSFD is highly de-
       pendent on the quality of the data provided by the member states as well as the routines
       to process and analyze these data. Due to the complexity of the data and the different
       setups individual countries have for holding and extracting VMS /Logbook data, trying
       to standardize workflows and/or final products can be a challenging task. To address
       these issues, WGSFD in 2015 proposed developing a best practices guide and workflows
       in R to help states stream line data extraction, cleaning, aggregating and submission pro-
       cesses. The R‐script was sent out to national data‐submitters to be used for the combina-
       tion and aggregation of fisheries data on national levels. Although not all countries used
       all parts of these R‐routines, the quality of submitted data continuously improved over
       the last years. The status of data submissions is given in table 5.2.1.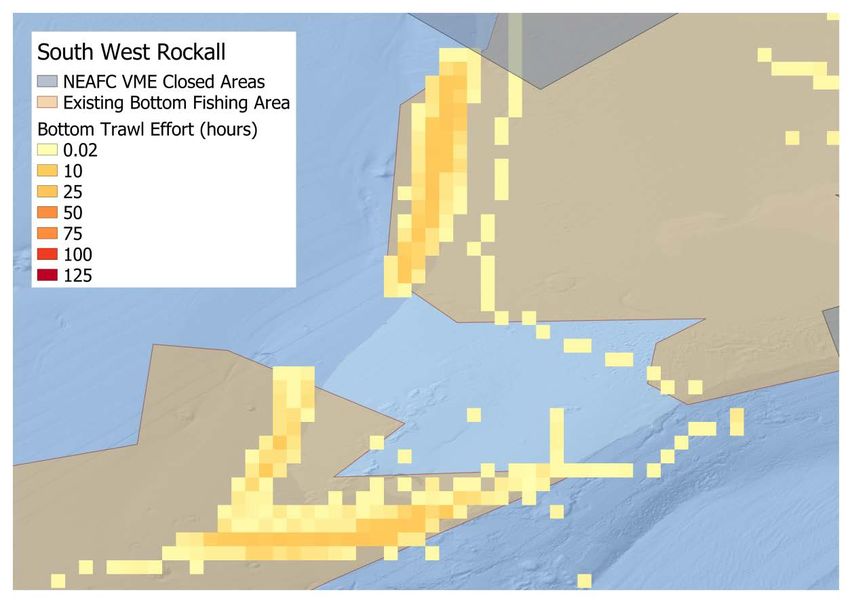
8 |                                                                       ICES WGSFD REPORT 2018

      Table 5.2.1. Status of data submission.

                      Data submitted Comments

      Belgium         Yes

      Denmark         Yes

      Estonia         Yes

      Faroe Islands No

      Finland         Yes

      France          Yes

      Germany         Yes

      Greenland       No

      Iceland         Yes                Only VMS data for metiér OTB were submitted.

      Ireland         Yes

      Latvia          Yes

      Lithuania       Yes

      Netherlands     Yes

      Norway          Yes

      Poland          Yes

      Portugal        Yes

      Russia          No

      Spain           No

      Sweden          Yes

      UK              Yes

      An additional way to achieve a high quality of the data products is to identify any poten-
      tial issues and doubtful results in the submitted and aggregated data as early as possible.
      Once these issues are highlighted, a deeper analysis on the data could reveal whether
      these deviances are reflecting true changes or are based on errors in the data that can to
      be corrected. A thorough quality check process increases both, the reliability on the data
      used in the analysis as well as the confidence by the final recipient in the advice given.
      ICES secretariat, ICES Data Center and WGSFD used a multi-step approach, following a
      four-eye principle wherever possible, to ensure that data submissions and aggregated
      data do have the best quality possible. Each national data submission was analyzed with
      the help of a standardized R-script. First, summaries were calculated for the most im-
      portant variables (number of submitted records, fisheries effort, landings, etc.) for each
      year, so that any questionable deviations could be identified. Secondly, maps were creat-
      ed, that show any differences for each c-square (VMS data) or ICES rectangle (logbook
      data) by comparing the values for the most recent year submitted against the data from
ICES WGSFD REPORT 2018 | 9
the year before as well as the mean of all years. Thus, it was easier possible to identify
areas that showed larger deviations, so that the underlying data could be checked in
more detail. The resulting quality check reports were checked by the WGSFD chairs,
commented and sent back via the ICES Data Center to the data provider.
Based on the VMS data aggregated for all submitted national data, maps for each main
gear group (Benthis métiers) were produced to show any potential differences in swept
area ratios for each c-square both, for the year 2016, comparing the data submitted in
2017 versus the data submitted in 2018 and between years 2016 and 2017. These maps
were checked for any deviations by WGSFD experts in plenary during the meeting, no
major issues where identified.
All scripts (R and SQL) used to produce the quality checks (reports and maps) are stored
on the ICES GitHub, so that the routines can be checked, updated and used again for
coming data calls in a standardized way. These routines will be updated, so that data
submitters can download and adapt these routines to use them for own quality checks on
their national data before these are submitted.
5.3 ToR C: Review ongoing work for analyzing spatial fisheries data
Annually, WGSFD received many contributions from members presenting intersessional
work on analysing spatial fisheries data. In the 2016 and 2017 report short paragraphs are
provided on the content of these presentations. Below the contributions from 2018 are
captured.
Roi Martinez – combining AIS and VMS
Roi Martinez has presented an update of his MPA management tool built in R Shiny. It
gives to the tool user a friendly interface to the fishing effort model R scripts running in
the background of the tool. This tool was developed in a web application format to give
access to several concurrent users regardless their location and without need of installa-
tion of any software.
The MPA management tool is using VMS locations as effort indicator data source, there-
fore AIS data was presented as future implementation into the tool in combination with
the VMS data to improve spatial-temporal resolution of benthic habitat impact assess-
ment. In relation to the spatial analysis of extent of the fishing gear impact, the AIS data
could support a better fishing vessels trip track-line estimation. Applying a buffer to
these vessel track lines with the averaged width of fishing gear using in each trip we
could obtain the swept area ratio by trip in a polygon shape. Then the cumulative swept
area would be aggregated by c-square and obtain a more accurate impact indicator than
the current analysis with VMS locations.
Per Finne – AIS and static gears
Presented recent work on AIS data from the Lofoten Sea covering an important cod fish-
ing area. Norway has collected three years of AIS from the fishing fleet < 15m, which
primarily do not have electronic logbook and VMS. Over half of the fleet under 15m have
AIS installed, even though it is not mandatory. The proportion is increasing each year
and the same vessels are responsible for over 75% of the total catch in that group. Second-
ly we took a closer look at static gears using different available sources, together with10 | ICES WGSFD REPORT 2018
AIS. Finally a short presentation on Skagerrak Sea showing implemented ideas from the
working group in actual regulations, in order to keep allowing the fishing vessels to
trawl across boarders in the same haul.
Josefine Egekvist – AIS and small scale fisheries
It was investigated if AIS can supplement the VMS data for the vessels below 12 meters
that doesn’t have VMS for Danish vessels. It is optional to have AIS installed for fishing
vessels less than 15 m. AIS data from the Danish Maritime Agency, which picks up AIS
positions in Danish waters, have been made publicly available from 2006 onwards, and
the number of fishing vessels with AIS has increased during the period. Data were fil-
tered to keep positions from Danish fishing vessels with approximately 5 minutes inter-
val. To merge the AIS data with logbook data (to know the gear used), a vessel-id is
necessary, and is found through merging with the fleet register by call sign. In some cas-
es, this is not possible, and it is checked if it is possible to find the vessel-id directly from
the AIS vessel name. The AIS data are merged with logbook data by vessel-id and date,
and a speed filter is applied depending on the gear used, giving around 4 million AIS
positions the last years. For analysis of how AIS can supplement the VMS data, an extrac-
tion was made of AIS data from vessels with logbooks, without VMS (around 200 000
AIS positions the last years). Some of the fishing vessels in the AIS dataset could be de-
fined as recreational tour boats (250–300 000 AIS positions the last years).
An issue with the AIS data is that it can be turned off, e.g. at good fishing spots, while
that is not possible with the VMS data. An analysis was made of trips from Danish ves-
sels fishing in Kattegat. AIS data were merged with logbooks, and “holes” of more than
30 minutes in AIS time series within fishing trips were identified. The reason for a “hole”
in AIS data could be due to the fishermen turning it off, but it could also be caused by
that the vessel was at a place where the signal was not received by the Danish Maritime
Agency. The analysis showed that in average 5% of the fishing trips in Kattegat with
vessels less than 12 m had “holes” during the period 2006–2017. An analysis of coverage
of AIS and VMS data shows that the use of AIS data can supplement the VMS data, espe-
cially in the case of gillnets.
As the AIS positions are of higher frequency than the VMS data, the grid resolution in
exchange formats can be on a higher resolution. The VMS data are reported on a 0.05
degree grid, while the AIS data can be reported on a 0.01 degree grid.
Pedro Lopes – AIS data
Presented recent work on the identification of the different fleets operating in Madeira-
Tore (North Atlantic), on an area previously defined as a critical area under the Marine
Strategy Framework Directive (MSFD). The combined analysis of VMS and e-logbook
allowed the identification of fishing events and the estimation of the fishing intensity by
gear type, as well as the identification of several general patterns for fishing operations.
The Portuguese fishing fleet operating in this area comprises mainly longliners, alternat-
ing between bottom longline activities in spring and summer and pelagic longline in
autumn and winter.
A study was presented on the activity of a continental longliner fishing in seamounts of
the Madeira-Tore, that could be followed during a single fishing trip, based on the analy-ICES WGSFD REPORT 2018 | 11
sis of high-frequency AIS data combined with on-board registers of fishing positions and
associated catches. When available, AIS data represent an invaluable tool for identifying
and detailing fishing operations, allowing the recognition of spatial fishing patterns for
longliners operating in North Atlantic.
Niels Hintzen – Repetitive trawling
The occurrence of repetitive trawling events within a week in the most frequently fished
ICES rectangles by the Dutch beam-trawl fleet were investigated. Repetitive trawling
exposure occur when a trawl passes over the exact same spot twice. Given that these
activities occur at the spatial scale of the gear, we analysed trawling tracks at a grid cell
size of 25 by 25meter. After applying interpolating techniques to estimate trawl passages
we calculated the time difference between trawl passages in the exact same grid cell.
Since the analyses was executed for 52 weeks in a year, a bandwidth of results was ob-
tained, presented in the figure below. The repetitive exposures were expressed as per-
centage of the seafloor in a specific ICES rectangle (32F2 in the figure below for Pulse
(left) and traditional beamtrawl (right)). All areas considered (4 ICES rectangles in total),
the part of the seabed that is disturbed repetitively is very small. Only up to 0.3 (pulse) -
0.8% (beam trawl) of the pixels of the most intensively trawled ICES rectangles may en-
counter a repetitive exposure with intervals of less than one week. These estimates are
based on the most intense traditional beam or pulse-trawl fished areas in the North Sea.
At time intervals taken within a day, these percentages drop further down to12 | ICES WGSFD REPORT 2018
5.4 ToR D: Initiate innovative methods to analyze spatial fisheries data
Results on this ToR will be reported on under ToR J.
5.5 ToR E: Further development of fishing intensity/ pressure mapping
WGSFD contributed to generate fishing intensity and pressure maps for the HELCOM
and OSPAR regions together with the ICES secretariat. Quality control on data used for
these maps was performed by WGSFD and in 2016, the generation of the maps were tak-
en care by WGSFD. From 2017 onwards the ICES secretariat generated the maps. Results
were used in advice and published as such on the ICES webpage.
Interim deliverables on ToR E are described in the WGSFD interim report of 2016:
http://ices.dk/sites/pub/Publication%20Reports/Expert%20Group%20Report/SSGEPI/2016
/01%20WGSFD%20-
%20Report%20of%20the%20Working%20Group%20on%20Spatial%20Fisheries%20Data.
pdf
And final deliverables on ToR E in the WGSFD interim 2017 report:
http://www.ices.dk/sites/pub/Publication%20Reports/Expert%20Group%20Report/SSGE
PI/2017/01%20WGSFD%20-
%20Report%20of%20the%20Working%20Group%20on%20Spatial%20Fisheries%20Data.
pdf
Final deliverables in terms of maps for OSPAR and HELCOM can be found here:
2016:
http://ices.dk/sites/pub/Publication%20Reports/Advice/2016/Special_Requests/OSPAR_fu
rther_development_of_fishing_intensity_and_pressure_mapping.pdf
2017:
http://ices.dk/sites/pub/Publication%20Reports/Advice/2017/Special_requests/OSPAR.20
17.17.pdf
http://ices.dk/sites/pub/Publication%20Reports/Advice/2017/Special_requests/HELCOM.
2017.18.pdf
2018:
http://ices.dk/sites/pub/Publication%20Reports/Advice/2018/Special_requests/ospar.2018.
14.pdf
5.6 ToR F: Produce spatial fishery distribution product on a specific fishery
WGSFD generated the required maps as requested by the Sandeel benchmark workshop
to show the fine-scale spatio-temporal distribution of the sandeel fishery in the North
Sea. Results were send directly to the benchmark group that took place in 2017.
Final deliverables on ToR F are described in the WGSFD interim report of 2016:
http://ices.dk/sites/pub/Publication%20Reports/Expert%20Group%20Report/SSGEPI/2016
/01%20WGSFD%20-ICES WGSFD REPORT 2018 | 13
%20Report%20of%20the%20Working%20Group%20on%20Spatial%20Fisheries%20Data.
pdf (see Annex 6 on page 165)
5.7 ToR G: Produce impact maps by combining and evaluating benthic
information on sensitivity (from WGDEC, BEWG, WGMHM) together with
fishing pressure maps
WGSFD generated the required maps as requested by the different working groups.
Results were send directly to the group that took place in 2016.
Final deliverables on ToR G are described in the WGSFD interim report of 2016:
http://ices.dk/sites/pub/Publication%20Reports/Expert%20Group%20Report/SSGEPI/2016
/01%20WGSFD%20-
%20Report%20of%20the%20Working%20Group%20on%20Spatial%20Fisheries%20Data.
pdf (see page 68).
5.8 ToR H: Using NEAFC VMS and catch data, describe “fisheries activities in
and in the vicinity of such (VME) habitats” (areas defined by WGDEC)
within the NEAFC Convention Area in 2015
WGSFD generated the required maps as requested by WGDEC after extensive analyses
of the NEAFC data. Results were send directly to the group that took place in 2017 and
2018 and were used for advice in among others VME related topics.
Interim deliverables on ToR H are described in the WGSFD interim report of 2016:
http://ices.dk/sites/pub/Publication%20Reports/Expert%20Group%20Report/SSGEPI/2016
/01%20WGSFD%20-
%20Report%20of%20the%20Working%20Group%20on%20Spatial%20Fisheries%20Data.
pdf
And final deliverables on ToR H in the WGSFD interim 2017 report:
http://www.ices.dk/sites/pub/Publication%20Reports/Expert%20Group%20Report/SSGE
PI/2017/01%20WGSFD%20-
%20Report%20of%20the%20Working%20Group%20on%20Spatial%20Fisheries%20Data.
pdf
Advice related to ToR H can be found here:
2017:
http://ices.dk/sites/pub/Publication%20Reports/Advice/2017/2017/vme.neafc.pdf
2018:
http://ices.dk/sites/pub/Publication%20Reports/Advice/2018/2018/vme.neafc.pdf
5.9 ToR I: Develop methods to estimate fishing activity and/or effort of static
gears using from positional data, logbook data, observer data and ques-
tionnaires
Little is known about spatial-temporal dynamics of static gears, i.e. where do shoot their
gear, how long are gears in the water, what are the gear dimensions used. Using a variety14 | ICES WGSFD REPORT 2018
of data sources we aim to develop standardized methodology to improve on estimating
the high spatial-temporal impact of static gears.
To address this ToR an overview of current EU legislation on reporting of gear dimen-
sions of static gears is given. The majority of vessels fishing with passive gears are small
vessels and many of them don't have VMS onboard. Therefore, to get information on the
spatial extent of the fishery, some data are available from logbooks and some of the ves-
sels have AIS or another high-frequency position data source. In the case of passive gears,
it is important to distinguish between the vessel fishing effort, which is related to when
the vessel is handling the gear (setting or hauling), and the gear fishing effort, which is
related to when the passive gear is soaked in the water. Examples are given where fish-
ing activity is estimated for passive gears.
• Differences between vessel effort and gear effort in relation to passive gears
One of the main difficulties with passive gears lies in the definition of meaningful effort
descriptors. Effort descriptors currently available are either vessel hours spend operating
the gears, estimated by decomposition of the speed profile in VMS data, or days at sea
from the logbook/sales notes. However, because of their passive operative mode, vessel
fishing effort is at least partially decoupled from gear effort and some gears may be actu-
ally fishing in the interval between vessel days at sea.
A range of different situations was identified for passive gears which raise various issues
regarding effort quantification from VMS and logbook data. In all cases, soaking time is a
key information lacking:
• For long liners, the speed filter does not capture the setting step, only the
slower step of picking up the lines. A close visual inspection of the tracks easi-
ly reveals the line setting step, which closely overlap in space with the line
picking-up one. Soaking time would thereafter be a straightforward time dif-
ference between closest pings in the setting and picking up phases (with a pos-
sible drift). Further work is needed to develop routines to automatically and
routinely detect such ping associations.
• For pots and nets, the gear operation may correspond to either setting the gear
or picking up/emptying it. The two phases can coincide with, for example,
emptying, rebaiting and soaking of pots in the same operation when a pot
stays at the same place. The gear effort should therefore be the soaking time.
Automatic detection of associated gear setting and catch collection events to
estimate the soaking time appears to be problematic, at least solely on the basis
of a speed filter. The setting phase, in particular, can be missed if it is not coin-
cidental with catch collection, as it can be operated at higher speed in some
cases (e.g. self-shooting pot lines).
Passive gears do not fish at constant rate over time. The attractiveness or catchability of
the gear may decrease over time (e.g. asymptotic catch for pots, due to bait consumption,
escapement, and saturation). Although there is an extensive enough literature about effi-
ciency of passive gears and its relationship to immersion time (e.g. Zhou and Shirley,
1997a, 1997b; Groeneveld et al., 2003; Rotherham et al., 2006; Bacheler et al., 2013; Anders,
2015), this is highly dependent on gear and attractant (if relevant) characteristics as well
as on target species. An even coarse quantification of passive gears efforts would there-ICES WGSFD REPORT 2018 | 15
fore require the collection of more information in the context of the logbook-VMS data
call, if this information is collected in national logbooks.
Basic missing information about passive gears includes, but is not limited to:
• number of hooks for longlines.
• dimensions of nets.
• number of pots deployed.
Legislation on collection of information on passive gears
The subgroup analysed which data on passive gears are collated from logbooks, and it
was discussed how such data can be used. Furthermore, the WG considers paramount
ensuring consistency of results across MS and across vessel size categories.
Static gears can be defined as gillnets and entangling nets (GNS, GND, GNC, GNF, GTR,
GTN, GEN, GN), pots and traps (FPN, FPO, FYK, FWR, FAR, FIX, FSN) and hooks and
lines including handlines and longlines (LHP, LHM, LLS, LLD, LL, LTL, LX). In accord-
ance with Commission Implementing Regulation (EU) No 404/2011 of 8 April 2011 An-
nex X, following general and minimum information requested to record on the vessels
fishing activities with static gear, there is obligation on the gear dimension as follows:
total length of nets, total number of pots/traps and total number of hooks. However, in-
consistency between Annex X and Annex XI has been noticed. The subgroup assumed
that dimension is compulsory to report. That information should have been gathered by
Member States since amendments were adopted in Commission Implementing Regula-
tion (EU) 2015/1962 of 28 October 2015. The subgroup stressed that these additional vari-
ables do not belong to the core set of dimension variables for vessels without logbooks.
Based on the information already collected from control regulation and considering the
minimum requirement that is common to all MS, the information on dimension could be
requested in further data calls. The subgroup highlighted the need on soaking time for
static gear fishing effort.
As well was noted the recent relive of proposal for a Regulation of the European Parlia-
ment and of the Council amending Council Regulation (EC) No 1224/2009, and amending
Council Regulations (EC) No 768/2005, (EC) No 1967/2006, (EC) No 1005/2008, and Regu-
lation (EU) No 2016/1139 of the European Parliament and of the Council as regards fish-
eries control. The proposal aims at revising the flexibility on the specifications of a vessels
tracking system (not necessary satellite-based). All vessels including those below 12 me-
tres length must have a tracking system. Only two categories of fishing vessels are de-
fined: > 12 m and16 | ICES WGSFD REPORT 2018
• Report on the DCF Workshop on "Common understanding and statistical
methodologies to estimate/re-evaluate transversal data in small-scale fisher-
ies". 21–23 May 2013, Nantes, France.
• Report of the Working Group on Commercial Catches (WGCATCH). 9–23 No-
vember 2015 Lisbon, Portugal.
• Report of the Working Group on Commercial Catches (WGCATCH). 7–21 No-
vember 2016, Oostende, Belgium.
• Report on the 2nd Workshop on Transversal Variables. 22–26 February 2016,
Nicosia, Cyprus.
• Meeting on Statistical Issues and Methodologies (SIM subgroup of
DCF/PGECON). 12–24 December 2016, Rome, Italy.
• Report on the PGECON subgroup DCF workshop on small scale fisheries. 25 -
29 September 2017, The Hague, the Netherlands.
• Report of the Working Group on Commercial Catches (WGCATCH). 6–20 No-
vember 2017, Kavala, Greece.
During the DCF workshop on small scale fisheries (PGECON subgroup) which was held
in The Hague, 25–29 September 2017 an overview of European SSF was made. Infor-
mation was presented and summarized on SSF data collection methodologies from 18
countries for four different regions (North Sea, Mediterranean Sea, Atlantic and Baltic). It
was discussed how to calculate fishing activity for SSF. Countries provided information
about SSF spatial distribution resolution. In most cases, spatial resolution is available on
the scale of ICES rectangle or GSA (Geographical Sub-Areas in the Mediterranean) area
level, in some cases even with lower resolution as on ICES fishing areas. In some coun-
tries information is available about coordinates of haul positions. In most of countries
information about number of fishing gear and their dimension is collected or estimated,
this could be used to estimate the impact of static gears with higher spatial-temporal
resolution in the future.
Logbooks and VMS
Electronic logbooks are mandatory for vessels above 15 m in Norwegian waters and
above 12 m in EU waters. It is mandatory to use electronic logbooks for vessels larger
than 10 m (8 m in the Baltic), but vessels below 12 m can still fill in paper logbooks, that
are then entered into databases.
The ICES data call for combined VMS and logbook data also includes passive gears,
where a speed filter is typically applied.
Table 1 below shows an output on VMS coverage for static gears in average from 2009–
2017 from the logbook data submitted in the ICES VMS/Logbook data call. The table can
only show the coverage of VMS for vessels that have logbooks, and is therefore missing
the part of the fleet that doesn’t have logbooks (ICES WGSFD REPORT 2018 | 17
Table 1. Fishing days and landing weight represented by VMS data by static gear group for the years
2009 to 2017. No data were submitted from Spain, Greenland, Faroe Islands and Russia.
Year Area Gear Fishing Fishing Percentage Total weight Total weight Percentage
group days days with of fishing without VMS with VMS of total
without VMS days with weight
VMS VMS with VMS
27.1 static 3158 5241 62 6128794 14613711 70
27.12 static 14 44 75 2111 55448 96
27.14 static 106 256 71 319240 1238504 80
27.2 static 7632 23305 75 17288704 46249281 73
27.4 static 61775 12771 17 19602183 17750841 48
27.5 static 160 40999 100 287706 140307088 100
27.6 static 21926 4192 16 10828522 9917509 48
Mean 27.7 static 130487 19508 13 49739883 27799112 36
of 2009
- 2017 27.8 static 77599 13921 15 11747607 14425011 55
27.9 static 10780 9434 47 1954443 4512423 70
27.10 static 213 156 42 69831 100928 59
27.3.a static 7430 1151 13 1928492 969193 33
27.3.b static 3865 76 2 1438069 41653 3
27.3.c static 11640 348 3 2184945 205959 9
27.3.d static 86856 3212 4 40715677 2643979 6
TOTAL 476202 150784 24 183999634 314107753 63
In both EU and Norway information on passive gears like total number of hooks (long
line) or total length of gillnets deployed is or can be reported in logbooks. The numbers
reported seem to be reported in different units in some cases, affecting the quality of the
information.
Because of the variation in reported details, it is not clear what the start- and stop time,
and also the start- and stop position, in the logbook is representing for static gear. In
some cases it seems that the start time and position is reported as the first fishing opera-
tion, that would be the first gillnet or line being either set or hauled, and similarly the
stop time and position is the end of the last fishing operation. In some cases, the start and
end positions are overlapping.
Other data sources
A substantial part of the vessels fishing with passive gears is below the length where it is
required to have logbooks and VMS, and therefore other data sources are needed to de-
scribe the fishery. The data sources for the passive fishery vary from country to country,
whereas some have monthly reports giving a main metier and positions where the vessel
were fishing during the month, while others have sales notes, and some have AIS.18 | ICES WGSFD REPORT 2018
Some countries have developed apps for smartphones for reporting on trip, fishing time
and position and gear use, e.g. the MOFI app used in Germany. In Norway, the coast
guard is collecting data on the locations of passive gears. In addition, observer data can
be useful for validation.
Sale notes and AIS
The sales notes have information about landing composition and main catch area. In
Norway gear information is also available in the sales notes, while in other coutries, the
gear information need to be derived from other data sources like monthly reports, fleet
register or licences. Those data source doesn’t have information on gear dimensions, only
on gear and main catch area, and need to be coupled with AIS data for acceptable spatial
resolution. Standard method of speed filtering of AIS in intervals between landing dates
gives an approximate fishing area. To clean AIS data one could use depth, terrain type
and spatial regulation data if available. As a more advanced option pattern recognition
could be used. It is often easy to spot visually which gear is used and this detection
should be possible to automate through coding. Please also see other section on working
with AIS data for a more comprehensive discussion.
Summary
To summarize for static gears, we need to use a multi-data source approach to get close
to the same information detail as on active gears. Even then there will be difficulties with
measures on fishing gear effort because of less details in the logbooks. The majority of the
static gear fleet is below length limit for electronic logbook and VMS tracking, and they
are not required to use AIS, but part of the fleet nevertheless have AIS installed, depend-
ing on the fishing area. The different national authorities seem to be expanding at an
increasing rate the use and requirements for AIS.
5.10 ToR J: Quantify and explain the spatiotermporal variability of fishing
fleets across the ICES areas
Introduction
A decadal view on fisheries distribution and variability over time is lacking from the
literature. This information has however now become available through the ICES data-
calls on VMS and logbook data and therefore makes a valuable data source to investigate,
describe and explain the spatio-temporal use of the European seas by the different fisher-
ies. The aim of ToR j) is to quantify and explain the spatio-termporal variability of fishing
fleets across the ICES areas. First, an EOF analysis (Preisendorfer, 1988) will be per-
formed to decompose the space-time variability in the time-series of gridded maps of
fishing effort or intensity into principal spatial modes and their amplitudes. This will
allow describing the patterns of variability. Then, a spatio-temporal modelling approach
will be performed to explain the described fishing effort patterns using covariates. This
modelling approach offers a flexible framework for selecting and modelling the effect of
relevant covariates as well as time and space dependence. This will be applied to some
selected fisheries from ICES areas, for instance the otter trawls targeting demersal fish in
the North Sea. For this fishery, the expected results should allow to quantify the im-ICES WGSFD REPORT 2018 | 19
portance of various environmental or anthropogenic covariates that may drive the fishing
effort or intensity distribution over space and time.
Material & Methods
Data sources
We compiled data from different sources to investigate the spatio-temporal variability of
demersal fishing effort (Otter board trawlers, OT_DMF) in the North Sea (Table 2). Fish-
ing effort as dependent variable was calculated from Vessel Monitoring System data
(VMS) provided by the ICES data center in collaboration with WGSFD. Data were availa-
ble as monthly means for grid cells with a size of 0.05°*0.05° from 2009–2017. Currently,
eleven covariates are considered in the model. Hydrographic variables, primary produc-
tivity as well as natural disturbance rate were spatially and temporally resolved parame-
ters and were aggregated or disaggregated respectively to match the VMS data set.
Sediment characteristics and location parameters (distance to coast, bottom positioning
index) were time-invariant and oil price as proxy for economic costs of fishing space-
invariant parameters.
Table 2. Preliminary list of variables to be included in the hierarchical bayesian spatial model
(HBSM). Note that fishing effort is the dependent variable, while all the others constitute the covari-
ates to be used in the HBSM.20 | ICES WGSFD REPORT 2018
Describing the space-time variability using EOF analysis
The EOF analysis is a method developed in Meteorology and Oceanography by Preisen-
dorfer (1988) to decompose the space-time (residual) variability in the time series of maps
into principal spatial scales and their time amplitudes. The method is actually a particu-
lar Principal Component Analysis (PCA) applied to a series of gridded maps. This meth-
od was widely used. For instance, such decomposition was applied in fishery sciences to
understand the spawning distributions of the anchovy in the Bay of Biscay (Petitgas et al.,
2014). The decomposition is a linear factorisation of spatial components (eigenvectors),
that are constant in time, and amplitudes (principal components), that are variable in
time. The variability around the mean map is, thus, modelled as the sum of spatial com-
ponents that are weighted by their annual amplitudes. Detailed equations can be found
in Petitgas et al. (2014).
To achieve the decomposition, a matrix of anomalies is computed by removing the time
averaged map from the original time series of maps. Then the EOF decomposition is per-
formed on this matrix of anomalies. Practically, a principal components analysis of the
covariance matrix in space over time (or alternatively of time over space) derived from
the matrix of anomalies (see Petitgas et al., 2014 for details) allows to compute the eigen-
values (overall variance accounted for by the components), eigenvectors (spatial compo-
nents) and principal components (time amplitudes).
To retain the most meaningful EOFs and interpret their spatial patterns, we used the
eigenvalues and the ‘local’ explained variance (Schrum et al., 2006; Woillez et al., 2010).
The ‘local’ explained variance at a given location associated with a given EOF is the pro-
portion of variance across time that the spatial components and time amplitudes explain
at that location. When the map of local variance shows an interpretable pattern, the EOF
is meaningful as it explains variability in particular areas. When the combination of the
spatial component and its amplitude are of the same sign, then the composed signal is
positive and when they are of opposite signs, the composed signal is negative.
Modelling the spatio-temporal distribution of fishing effort
In order to estimate and predict the intra and inter-annual dynamics of fishing effort in
the North Sea, Hierarchical Bayesian spatial model (HBSM) will be used. The model es-
sentially assumes that fishing effort (herby calculated as the number of hours that a par-
ticular vessel spent at sea fishing) at nearby locations and time intervals are more similar
than those more far apart. Moreover, it allows including a set of covariates that can be
used to assess the proportion of spatial variation in fishing effort that is explained by
those covariates. Here, in particular, we will test the effect of the covariates highlighted in
section X.
The overall structure of the model is similar to a Generalized Linear Model (GLM), where
the relationship between the response variable Y_i and a set of covariates x_i is described
through a linear predictor η. The linear predictor is, in turn, linked to the mean of the
response E(Y_i )=μ_i by means of a link function g, such that g(μ_i)=ƞ_i. In this way, the
general model can be summarized as follows:ICES WGSFD REPORT 2018 | 21
where β_0 is an intercept vector, β_k a design matrix that quantifies the fixed effect of
some covariates X_k, and ξ(s,t) represents the spatio-temporal structured random effect.
The ξ(s,t) term was considered as a Gaussian Random Field (GRF), which reduc-
es to a multivariate Gaussian distribution (MG) with mean zero and covariance matrix Σ
when evaluated at a finite set of locations:
Here Σ was treated as a separable random field process, such that its variance can be
decomposed into a spatial covariance matrix, Σ_S=s(ij)∈ R^(n x n), and tem p oral covari-
ance matrix, Σ_T=T(ij)∈ R^(m x m ).
The spatial covariance will be specified through a Matérn distribution, such that:
where |s_i-s_j | is the Euclidean distance between two sampling locations i and j; σ^2 the
marginal spatial variance; K_v the modified Bessel function of the second kind and order
v > 0, which measures the degree of smoothness of the spatial process; κ is the scale pa-
rameter that is related to the to the distance at which the spatial correlation becomes
nearly zero.
Finally, for the temporal covariance we will use a first-order autoregressive (AR1) pro-
cess, which depends on an exponential decay function that is expressed in terms of the
absolute difference among consecutive time intervals |t_i-t_j | and the temporal correla-
tion ρ_T :
Model inference
Provided that the model is performed under a Bayesian prism, all parameters will be
treated as random variables where their estimations will be obtained through marginal
posterior distributions. Inferences will be achieved by means of the Integrated Nested
Laplace Approximation (INLA) methodology and its respective R-package (www.r-
inla.org) (for more details, please refer to the latest review of Rue et al., 2017). Due to lack
of prior knowledge, default non-informative priors for all fixed-effect parameters as rec-
ommended by Held et al. (2010) will be assigned. These priors are essentially designed to
have little influence on the posterior distribution and hence can be regarded as an at-
tempt to unify the frequentist and Bayesian statistics.22 | ICES WGSFD REPORT 2018
Model selection
Model selection will be conducted on a backward stepwise method, starting always from
the full model, i.e., model with all covariates included. The goodness-of-fit of the models
will be accessed through the Watanabe Information Criterion (WAIC; Watanabe, 2010).
Moreover, predictive quality of the models will be achieved through the Conditional
Predictive Ordinate (LCPO) as indicated in Roos & Held (2011). Both WAIC and LCPO
are inversely related to the compromise between parsimony, fit, and predictive quality;
therefore, the lower their values, the better the model.
Prediction of fishing effort
To predict fishing effort across the North Sea, it will be first necessary to divide the study
area into a triangular mesh (Figure 2). Provided that it will be used for the final predic-
tion, this constitutes a crucial step during the modelling procedure. It is, therefore, para-
mount that the triangles should have regular shapes and sizes (Lindgren et al., 2011).
Moreover, because the variance usually becomes twice as larger at the border when com-
pared to the main domain, the triangulation needs to be spatially extended to avoid the
boundary effect (for more details refer to Lindgren & Rue, 2015 and Krainski et al., 2017).
Figure 2. Provisory triangular mesh that will be used to predict fishing effort in the North Sea.
5.11 ToR K: Present best-practices on how to analyse and use VMS data from a
world-wide perspective
Analyses performed using VMS and Logbook data have been published for almost two
decades. Within ICES different standardized methodology has been developed, but
worldwide many scientists have undertaken similar activities. To improve the activities
within ICES we review literature and describe best practices in analysing VMS and log-
book data.ICES WGSFD REPORT 2018 | 23
A subgroup of the working group considered this term of reference, and developed a
work plan for the production of a peer-reviewed paper examining best practices. The
paper will focus on four main areas. Firstly, how rules surrounding access to data func-
tion within Europe and other nations, and the specific issues faced within regional fisher-
ies management organisations where multiple national regimes may apply. Secondly, the
acquisition and management of data, and how alternative and ancillary sources of spatial
data can contribute to our understanding of spatial patterns of fishing activity revealed
through VMS data. Thirdly, approaches to analysis of data will be considered. This will
include methods for determining fishing activity through speed profiles and turning
angles, relation between fishing activity from VMS and bathymetry, gridding of effort
data, and interpolation between VMS polls into tracks. Finally, we will review applica-
tions of VMS analysis in studying fisheries catch, benthic impacts, spatial planning, effort
measurement and displacement, and interactions between fishing vessels, marine mam-
mals, seabirds and other wildlife. The review will serve to highlight commonalities of
approach, best practices and areas where improvements could be made through the
adoption of new techniques.
5.12 ToR L: WGSFD 2018 is requested to do prepatory work for the EU request
to ICES on advising on appropriate methods to assess the spatial extent
and distribution of physical disturbance pressures on the seabed
The ICES Working Group on Spatial Fisheries Data’s (WGSFD) mandate is to collate and
analyze high resolution spatial fisheries data collected through a bespoke data call issued
by ICES Secretariat to all EU ICES states. Such data call is used to answer specific advice
requests by OSPAR and HELCOM. And for the creation of data products for the assess-
ment of DCF indicators 5, 6 and 7 and for the OSPAR’s indicator BH3 ‘Extent of Physical
damage’.
The benthic fishing pressure layers created by the WGSFD can be used in the assessment
of D6C2 as they contain:
• an estimation of fishing effort measured in kWhFishingHours and Fishing
hours
• an estimation of fishing intensity/pressure/abrasion measured as surface and
subsurface swept area and swept area ratios.
Following a request from OSPAR in 2016, the WGSFD has compared fishing effort calcu-
lated from VMS data and from AIS data only (ICES, 2016). Recent Similar exercise was
carried out by Shepperson et al. (2018) and IMARES (2014). In the paper from Ferra’ et al.
(2018) AIS data are used to analyse the change of impacts in trawling activity for the
Mediterranean Sea.
In WGSFD 2016, the comparison was carried at an aggregate level especially due to the
fact that it is not possible to access raw VMS and logbook data. The results of the compar-
ison were in line with the published literature:
AIS is a useful additional source of information in fisheries and has a better coverage in
coastal areas due to the terrestrial network of receivers. AIS can improve the resolution of
VMS and logbook data and allows to identify a fishing vessel track better, time resolution
of AIS is a considerable advantage to the one/two hours time resolution of VMS data. InYou can also read