The role of state-owned enterprises in achieving economic transformation and inclusive growth
←
→
Page content transcription
If your browser does not render page correctly, please read the page content below

The role of state-owned
     enterprises in achieving
     economic transformation
     and inclusive growth

       Paper 1/4:
     An outcomes
     framework to link
     SOEs to the National
     Development Plan

Prepared for the African Development Bank and
National Planning Commission of South Africa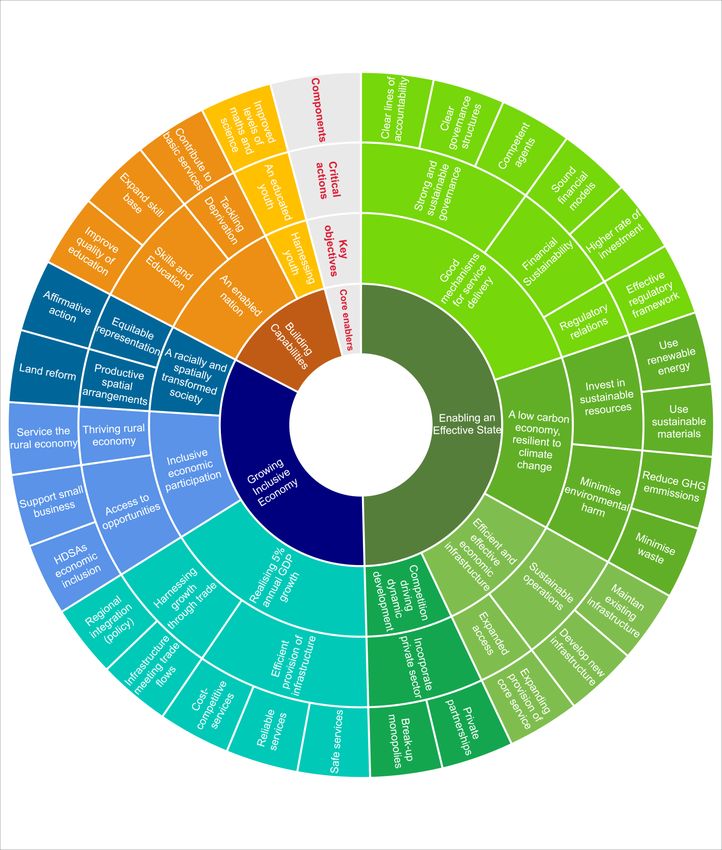
TABLE OF CONTENTS
    ACRONYMS AND ABBREVIATIONS ..................................................................... V
         INTRODUCTION ................................................................................................ 1
          1.1. CONTEXTUAL BACKGROUND ................................................................................ 1

          1.2. THE PURPOSE OF THE STUDY .............................................................................. 1

          1.3. ABOUT THIS PAPER ............................................................................................. 2

         INTRODUCTION TO THE NATIONAL DEVELOPMENT PLAN 2030 .............. 2
          2.1. OVERVIEW .......................................................................................................... 2

          2.2. THE ROLE FOR SOES ........................................................................................... 7

          2.3. BUILDING A PERFORMANCE FRAMEWORK .......................................................... 10

         THE FRAMEWORK FOR LOGISTICS .............................................................13
          3.1. OVERVIEW ........................................................................................................ 13

          3.2. LINKING TRANSNET’S PERFORMANCE TO THE NDP ........................................... 18

          3.3. EVIDENCE OF PERFORMANCE ........................................................................... 20

                  Error! Bookmark not defined.

          3.4. SUMMARY ......................................................................................................... 28

         THE FRAMEWORK FOR COMMUTER AND PASSENGER RAIL ..................31
          4.1. OVERVIEW ........................................................................................................ 31

          4.2. LINKING PRASA’S PERFORMANCE TO THE NDP ................................................ 34

                  36

          4.3. EVIDENCE OF PERFORMANCE ............................................................................ 36

          4.4. SUMMARY ......................................................................................................... 39

         THE FRAMEWORK FOR ELECTRICITY .........................................................41
          5.1. OVERVIEW ........................................................................................................ 41

          5.2. LINKING THE NDP TO ESKOM’S PERFORMANCE ............................................... 47

          5.3. EVIDENCE OF PERFORMANCE ........................................................................... 49

          5.4. SUMMARY ...................................................................................................... 53

    CONSULTATIONS ..................................................................................................56
    REFERENCES ........................................................................................................58
    ANNEX A: SOURCES AND METHOD NOTES ......................................................61

                                                                                                                             iii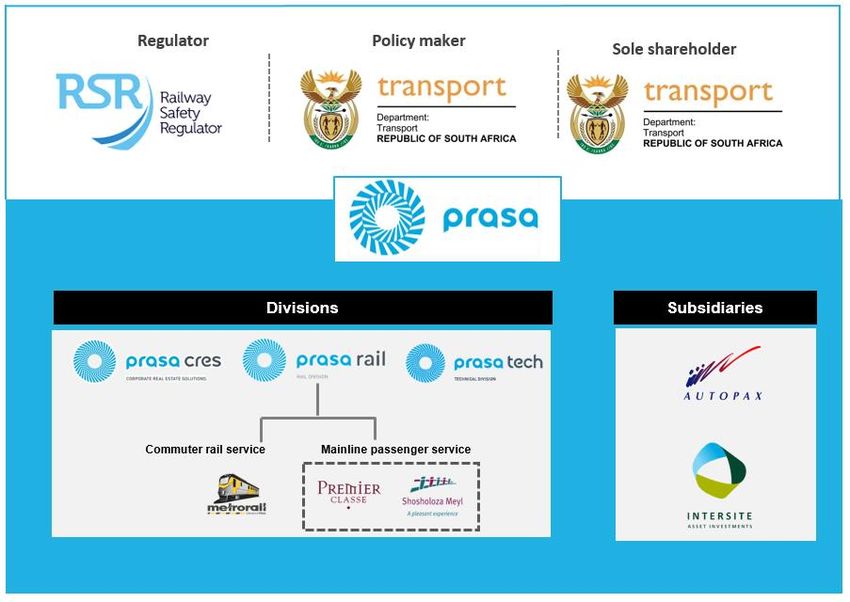
iv
ACRONYMS AND ABBREVIATIONS
AfDB – African Development Bank

ASoS – Annual State of Safety

CRES – Corporate real estate solutions

DOE – Department of Energy

DOT – Department of Transport

DPE – Department of Public Enterprises

GTK – Gross Ton-Kilometers

MTSF – Medium-term Strategic Framework

NDP – National Development Plan

NPC – National Planning Commission

SACC – South African Commuter Corporation

SAR&H – South African Railways& Harbours

SOC - State Owned Company

SOE – State Owned Enterprise

TFR – Transnet Freight Rail

TNPA – Transnet National Ports Authority

TPL – Transnet Pipelines

TPT – Transnet Port Terminals

                                            v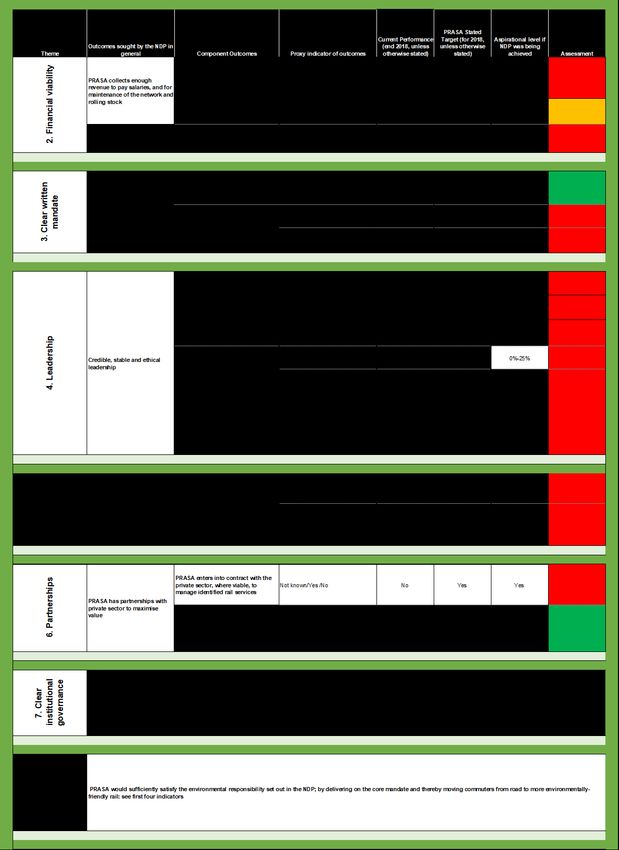
INTRODUCTION

1.1.   CONTEXTUAL BACKGROUND
       This document is the first in a series of four papers on state-owned enterprises in South Africa
       prepared for the National Planning Commission and the African Development Bank (the sponsors).

       The National Planning Commission (NPC, the Commission) was established in 2010 to provide
       government with an independent and critical view of South Africa’s development, and to produce a
       plan to improve planning, budgeting and co-ordination of economic development. The NPC is made
       up of twenty-six commissioners, twenty-five of whom are private citizens who serve in a part-time
       capacity.

       In developing this plan, the NPC was required to take a ‘broad, cross-cutting, independent and critical
       view of South Africa’ as it determined the strategic path for development. The vision and strategic
       plan developed by the Commission is the National Development Plan, 2030 (the NDP).

       State-owned enterprises (SOEs) constitute a significant part of the economy and are expressly
       expected to contribute to the achievement of the NDP. Their role includes contributing to inclusive
       growth and job creation, promoting economic transformation and skills development, industrialising
       the economy and supporting regional integration. The existence, operational performance, financial
       sustainability and governance of SOEs is thus highly relevant to the achievement of the NDP.

       The role of the Commission is to oversee the implementation of the NDP by providing research
       support and reform recommendations to government on issues that impact the realisation of the NDP.
       As the first five-year NDP planning cycles (2014-2019 Medium-term Strategic Framework) draws to a
       close, it is an appropriate time to take stock of the performance and purpose of SOEs in achieving
       long-term goals, especially since President Ramaphosa reaffirmed the NDP as the country’s
       development blueprint.

       The African Development Bank (the Bank) through the Southern Africa Regional and Business
       Delivery Office in Pretoria is supporting the Commission to undertake the assessment of SOEs to
       help to reposition the major SOE as efficient vehicles to deliver on the goals of the NDP.

1.2.   THE PURPOSE OF THE STUDY
       The ultimate purpose of the study is to better align the existence, structure and performance of SOEs
       to support government’s long-term development strategy. Specifically, the NPC and AfDB
       commissioned four research papers:

                                                                                                          1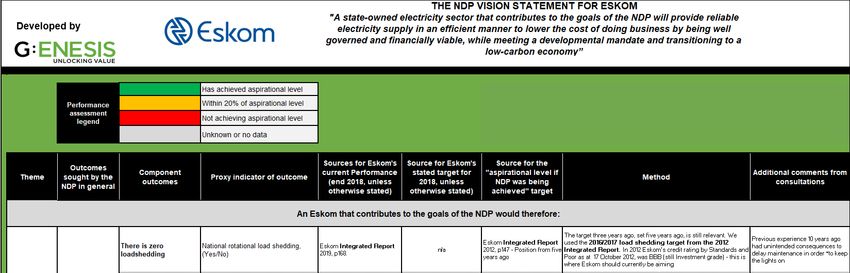
1. Paper 1: Review of performance against NDP (this report);: The purpose of the first paper is to
          create a framework for assessing SOEs against the NDP; and then using this framework to provide
          an evidence-based assessment of performance in three state-owned activities, namely: the provision
          of electricity (Eskom); the provision of freight logistics (Transnet); and the provision of commuter and
          passenger rail services (Passenger Rail Agency of South Africa (PRASA)).

       2. Paper 2: Market suitability analysis: The second paper explores the market structure and socio-
          economic conditions under which government intervention through a state-owned participant is
          appropriate or not appropriate. The paper provides an analytical framework for use by policy-makers,
          and uses electricity, freight logistics and commuter and passenger rail as three test cases, providing a
          range of alternative options.

       3. Paper 3: Institutional governance review: The third paper considers the institutional governance
          arrangements between shareholder ministry, policy ministry, planning department; funding ministry
          and the SOEs. It also focuses specifically on electricity, freight logistics and commuter/passenger rail
          to draw out principles of universal application.

       4. Paper 4: Synthesis: The final paper presents learnings from the first three papers and synthesises
          principles and policy recommendations that will help to align the structure and performance of SOEs
          to improve their contribution in support of the NDP and inclusive economic growth.

1.3.      ABOUT THIS PAPER
          The purpose of this paper (1) is to establish a framework of the outcomes sought from SOEs in the
          NDP, and 2) to use the framework to review the performance of a sample of SOEs against the NDP
          to establish an evidence base of performance.

          In short, the paper answers the questions:

               “What outcomes does the NDP expect from SOEs in general and specifically for SOEs
               in electricity, freight rail and commuter rail; and are these outcomes being achieved?”

          Paper 1 creates a stronger link between the NDP and the performance of key SOEs: the performance
          of SOEs becomes more clearly linked to achievement of the NDP, while the NDP becomes more
          manifest in the performance of the SOE.

          INTRODUCTION TO THE NATIONAL DEVELOPMENT
          PLAN 2030

2.1.        OVERVIEW

                                                                                                             2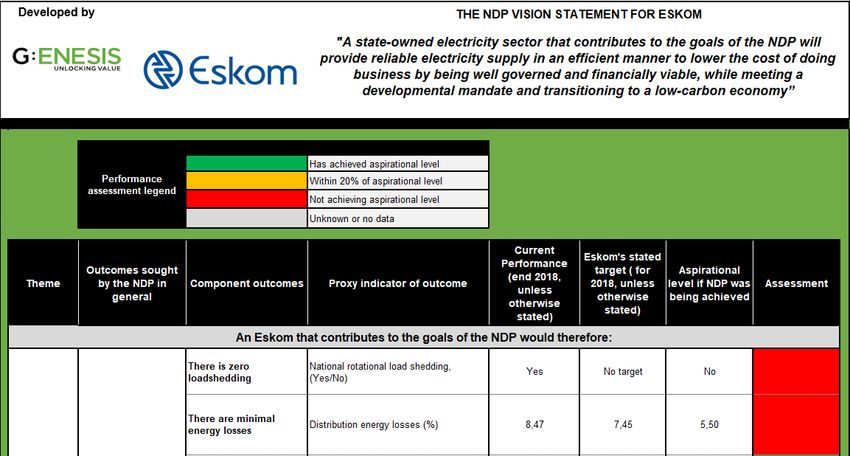
The goal of the NDP is to realise a greatly improved quality of life for all South Africans by 2030. In
            the spirit of the Constitution, the NDP envisages an equal and just society in which poverty has been
            eliminated and inequality has been reduced. According to the plan, the vehicles for achieving this
            society are enhancing the capabilities of citizens, building an effective developmental state, and
            driving inclusive growth.

            The NDP runs to 484 pages long and is part vision statement, part economic framework, and part
            social compact. It touches on all features of society and the economy. As a long-term strategic plan, it
            serves four objectives:

                 1. To provide overarching goals for what South Africa wants to achieve by 2030;

                 2. To build consensus on the key obstacles to achieving these goals and what needs to be done
                 to overcome those obstacles;

                 3. To provide a shared long-term strategic framework within which more detailed planning can
                 take place; and

                 4. To create a basis for making choices about how best to use limited resources.

            When drafting the report in 2011, the NPC first produced a diagnostic report identifying nine
            challenges faced by South Africa which was disseminated widely for discussion. The identified
            challenges were:

                 1. “Too few people work;

                 2. The quality of school education for black people is poor;

                 3. Infrastructure is poorly located, inadequate and under-maintained;

                 4. Spatial divides hobble inclusive development;

                 5. The economy is unsustainably resource intensive;

                 6. The public health system cannot meet demand or sustain quality;

                 7. Public services are uneven and often of poor quality;

                 8. Corruption levels are high; and

                 9. South Africa remains a divided society”1

            The NPC defined these as the most urgent issues facing our economy. “Building on the diagnostic,
            the plan added four thematic areas”2:

1
    NPC (2012) National Development Plan, p25.
2
    NPC (2012) National Development Plan, p25.

                                                                                                                 3
10. Social protection to the vulnerable;
11. Community and personal safety;
12. The rural economy; and
13. South Africa’s global, continental and regional role.
The NPC then took these challenges and presented them rather as outcomes or solutions to be
attained. These, along with the supplements, form the basis of the chapters of the NDP:
14. Economy and employment (Chapter 3);
15. Development of economic infrastructure (Chapter 4);
16. Environmental sustainability (Chapter 5);
17. The rural economy (Chapter 6);
18. Regional and international relations (Chapter 7);
19. Human settlements and spatial reform (Chapter 8);
20. Education (Chapter 9);
21. Healthcare (Chapter 10);
22. Social protection (Chapter 11);
23. Safety (Chapter 12);
24. Building a capable state (Chapter 13);
25. Fighting corruption (Chapter 14), and
26. Social cohesion (Chapter 15).
The NDP is quite explicit in certain expectations for what an SOE is to contribute to the economy.
However, imbued in the nature of the SOEs as an implementation arm of the developmental state is
the understanding that SOEs are able to and should contribute to the achievement of the vision in a
much wider manner than made explicit. For example: as large owners of land, the SOEs may be able
to contribute toward the transfer of land and land reform. It is also apparent in the CSI reporting of the
SOEs that they themselves have adopted a wider share of responsibilities – contributing significantly
to education programmes or health care delivery.
Figure 2.1 is a comprehensive representation of the potential responsibilities of the SOEs promoted
by the NDP. This sunburst puts the ultimate aspiration of the NDP in the centre and moves outwards
to progressively more detailed outcomes sought by the NDP. The stated aspiration is to eliminate
4poverty and reduce inequality by 2030, but employment is so fundamentally intertwined with both of
these, that it has been included as a central aspiration.
The achievement of the three central aspirations is enabled according to the NDP by 1) building the
capability of citizens; 2) growing an inclusive economy; and 3) building an effective state. 3 In turn,
each of these is broken into objectives, actions and components in the outer rings.
3
Ibid, p478.
5Figure 2.1: Visual representation of the NDP (as could be relevant for an SOE)
Eliminate
Poverty;
Reduce
Inequality and
Create
Employment
6Three points stand out from this depiction:
• Firstly, economic progress, while critical, is balanced equally with social equity and
environmental sustainability, expressly or implicitly. The NDP acknowledges the importance
of growth – aiming for the economy to have nearly trebled by 2030 while creating 11 million
additional jobs4 - but it is not a charter for laisezz faire growth. Instead it stresses a form of
economic growth that is simultaneously a) inclusive of excluded groups, b) labour-absorbing,
and c) transformative of the historical imbalances in the control and ownership of the economy.
• Secondly, it foresees a mixed economy, jointly owned and managed by the private and
public sectors, and a central role for the state in development. The states agencies and
companies are thus expected to be involved heavily in the achievement of the NDP. Moreover,
SOEs are explicitly presented as critical drivers and implementing agents of the developmental
state envisaged in the NDP. Thus, the role for SOEs in driving inclusive economic growth is
significant.
• Third, the themes of national development are wide-ranging and touch on almost every
aspect of society. This has implications for SOEs because it means that the expectations of the
SOEs are more than economic; there are also social, developmental, and environmental
expectations. In other words, SOEs are expected to contribute to a myriad of outcomes, some of
which are not strongly related to their core function or expertise.
2.2. THE ROLE FOR SOES
The NDP establishes SOEs as the primary tools for implementing the developmental policy
imperatives of the State. In this vein, Chapter 13 specifically acknowledges that:
“SOEs are central to advancing national objectives through providing economic and
social infrastructure. If this is done in an equitable and cost-effective way, SOEs can
contribute to both economic growth and overcoming spatial inequalities. While
considerable attention has been given to the transformation of SOEs, less attention
has been given to the transformative or developmental role that SOEs can play. By
2030, South Africa needs to be served by a set of efficient, financially sound and well-
governed SOEs that address the country’s developmental objectives in areas where
neither the executive arms of government nor private enterprises are able to do so
effectively. These enterprises must deliver a quality and reliable service at a cost that
enables South Africa to be globally competitive.”5 (underlining added)
The NDP recognises that social and economic infrastructure is the foundation of growth and job
creation. This infrastructure delivers electricity and transport services; powers the economy, and
supports manufacturing, trade and exports. Moreover, it provides citizens with the necessary means
4
NPC (2012), National Development Plan – 2030, p124
5
NPC (2012), National Development Plan – 2030, p438.
7to improve their standard of living. The importance of infrastructure to South Africa’s economic growth
has meant the NDP has both broad, overarching aspirations but also some quite specific projects for
electricity, logistics and commuter rail.
SOEs are expected to provide economic infrastructure and services that support industry, bring down
the cost of doing business, and to improve national competitiveness. The NDP sees the SOEs
making major investments in infrastructure and provision of new services (for example, mass
electrification) needed to drive periods of accelerated growth stimulating more investment, increased
exports and productivity improvements, and that SOEs are well placed to make those investments. 6
However, in addition to a core mandate (which contributes to national development in providing
economic infrastructure and necessary public goods), SOEs are expected to fulfil a developmental
role. The latter may often be sub-commercial and relates more specifically to where there would be
under-provision of the service in a free-market. For instance: “Eskom has a mandate to provide
reliable and competitively priced electricity to mining, industry and business, but it also has a mandate
to extend affordable access to electricity services to poor households.”7
In addition, SOEs are expected to increase the technological base of the economy, to support
regional trade, to make a transition to a low-carbon economy, to drive transformation and equity in
society, and to remain regionally and globally competitive by applying co-operative and competitive
principles.
In Chapter 4 there are specific references for freight rail, commuter rail and electricity:
Freight logistics (Transnet)
In general: The provision of logistics must lower the cost of doing business. The NDP posits that the
logistics platform is a critical input into industrialization, allowing for increased international
competitiveness and economic growth through trade. Specifically: It also places an integral
responsibility on Transnet for the delivery of a reliable supply of coal for Eskom. Transnet is also
exhorted to make the transition to a low-carbon economy through shifting some freight transport from
road to rail. A number of specific infrastructure projects are also listed for Transnet to undertake such
as the upgrade of the Gauteng-Durban corridor and completion of the new multi-product pipeline.
Electricity (Eskom)
In general: “Eskom has a mandate to provide reliable and competitively priced electricity to mining,
industry and business, but it also has a mandate to extend affordable access to electricity services to
poor households.” Specifically: The NDP lays a responsibility for Eskom to increase access to
electricity to 90% by 2030 with off-grid options available to the outstanding 10% of the population.
Further, a larger proportion of the electricity supply is mandated to arise from renewable sources. It
also sets out a number of specific projects that must be undertaken by Eskom.
6
Ibid, p126.
7
Ibid, p442.
8Commuter and passenger rail (Prasa)
In general: Bolstering public transport is posited as a critical component of addressing poverty.
Commuter and passenger rail is important to overcoming spatial challenges by increasing the mobility
of low-income households. Specifically: There is an imperative to promote the transition to a low-
carbon economy: through the increased use of renewable energy sources and through enabling the
shift from road to rail. (Rail has a lighter environmental footprint than road).
Then, a number of enabling factors for all SOEs are identified in the plan, 8 :
1. “A clear mandate: Each SOE needs a well-defined and transparent mandate that sets out
its role and how its activities serve the public interest. The closest thing to this is the
stakeholder compact required by the PFMA” although the mandate may take other forms like
a strategic statement of intent, a policy document or an Act of Parliament. The mandate
must specify why the SOE is needed: “Given that these enterprises exist to serve the public
interest, it is important that the mandate is precise about what public good the SOE provides
and how it serves the public interest. 9 The mandate must be publicly available to promote
accountability.10
2. Financial sustainability: “For the large SOEs involved in economic infrastructure provision,
their mandate should also include the imperative of financial viability and sustaining their
asset base and balance sheet in order to maintain and expand services.”11
3. A clear and straightforward institutional governance structure12: “This involves clearly
identifying and managing the government’s different roles in policy-making, ownership of
utility assets, and regulation of prices and quality of utility services.”13 The responsibility of
policy and shareholder ministries must be clarified, and co-ordination improved.14
“Consideration needs to be given to how these different roles are allocated to ensure a
sustainable balance between short-term and long-term priorities and coordination between
different policy priorities.”15
4. Quality of appointments and consistency: “Ensure appointment processes are credible
and that there is greater stability in appointments.”16
5. Deal with capacity constraints: “A long-term strategy must be formulated to develop the
policy and technical expertise that SOEs need to carry out their mandate.”17
8
Ibid, p 439 to 442.
9
NPC (2012), National Development Plan – 2030, p439.
10
Ibid, p439.
11
Ibid, p439.
12
Note: this issue is dealt with in Paper 3 – Institutional governance review.
13
Ibid, p439.
14
Ibid, p442.
15
Ibid, p439.
16
Ibid, p75, 442.
17
Ibid, p439.
92.3. BUILDING A PERFORMANCE FRAMEWORK
Developing clear links from the outcomes desired in the NDP to specific indicators and measurable
performance metrics for particular SOEs is challenging because of the multiplicity of topics;
objectives; and aspirational nature of long-term strategic documents. However, a close reading of the
NDP reveals eleven explicit or strongly implicit areas in which a SOE must perform to achieve the
expectation of the NDP. These eleven outcome statements form a standard common framework for
all SOEs, which can be used by the sponsors to assess the performance of any SOE.
10A framework for SOEs to achieve the outcomes of the NDP
Six operational themes
1. Core mandate (commercial): The SOE must provide its core economic infrastructure and service
efficiently, cost-effectively and reliably so that the cost of doing business is driven down.18
2. Developmental mandate (non-commercial): The SOE must provide the identified developmental
service efficiently, cost-effectively, and reliably so that excluded groups are included.19
3. Financial viability: An SOE must be financially viable as a going concern and sustain an asset base
and balance sheet in order to make capital investment, and maintain and expand services. (A state
agency should recover enough in user charges to cover operational and maintenance costs). 20
4. Environmental sustainability: An SOE must support the transition to a low-carbon economy, and
observe other environmental standards.21
5. Specific projects: The SOE must undertake any specific projects given to in the NDP.22
6. Transformation responsibility: The SOE must promote the equitable reordering of the economy
through internal transformation re employment equity, training, and supplier development.23
Fundamental governance enablers must be in place to reach these operational
outcomes
7. Clear institutional governance: The responsibility of policy ministry, shareholder ministry, funding
ministry and regulatory oversight must be clear and delineated. 24
8. Clear written mandate: The SOE must have a well-defined written mandate (or shareholder compact)
that sets out its role and is precise about what public good the SOE provides and how it serves the
public interest. The mandate must be publicly available to promote accountability. 25
9. Leadership: Senior appointments must be credible. There must be stability in senior appointments.
Leadership must behave ethically and build a corruption-free culture.26
10. Expertise: “The SOE must formulate and implement a long-term strategy to develop the technical
expertise that it needs to carry out its mandate.” 27
11. Partnerships: The SOE must have an effective framework in place to partner with the private sector
and does partner with the private sector.28
18
NPC (2012) National Development Plan – 2030, p39 and 439.
19
Ibid, p410 and 440.
20
Ibid, p439-440.
21
Ibid, p199.
22
Ibid, p64-68 and 74-75.
23
Ibid, p138-140. Note that transformation is not expressly listed in the NDP as an imperative for SOEs; but employment equity and
redress measures like enterprise development, training, and mentoring are mentioned repeatedly, and it is likely that state companies
would implicitly be expected to be champions of these areas).
24
Ibid, p75, 439-440.
25
Ibid, p439-440
26
Ibid, p439-441
27
Ibid, p439 - 441.
28
Ibid, p44 and 442.
11Each of these six outcomes and five enablers are broken into components which can be customised
to the SOE in question.
The performance against each component are assessed by proxy indicators. The proxy indicators
and aspirational levels were developed with the input of technical experts, the NPC, AFDB, National
Treasury, Department of Public Enterprises (DPE) (Energy team), DPE (Transport team); DPE
(Governance team); as well as PRASA and Eskom.29
The current performance of the SOE (financial year 2018 unless stated otherwise) is measured
against an aspirational level - this is the standard of performance that would need to be place either
now or in the future which collectively would allow the NDP outcomes to be achieved. In other words,
this is where the SOE should be performing against each outcome, were the NDP being achieved.
The aspirational levels are the most subjective as it is difficult to find a hard target for the achievement
of something as amorphous and wide-ranging as the NDP. The process to settle on a aspirational
level was, in most cases, concluded using this protocol as a guide:
1. First, if the NDP itself sets a specific benchmark target and if this still relevant; use this as
the aspirational level; if not then;
2. Work with independent analysts and experts to devise a reasonable target that would allow
a reasonable observer to say “At that level, SOE X is at the performance needed to achieve
the outcomes of the NDP”; alternatively,
3. Use a standard international benchmark of performance for SOEs in that class;
alternatively
4. Use a target set in recent policy documents; alternatively
5. Use a benchmark equivalent to performance from previous years where performance was
identified to be strong; alternatively
6. Use a target that the SOE has set for itself (being cognizant that the targets set by the SOEs
for themselves can sometimes be set too low because they are in relation to weak current
performance).
The level of performance was determined using the ratio of current level of performance in
comparison to the aspirational level. Performance worse than the aspirational level is marked red;
performance that is as good or better than aspirational level is marked green; performance that is
within 20% of full target performance has been marked amber to show the SOE is approaching the
aspirational level. It then becomes visually evident where the SOE is delivering on its NDP-prescribed
mandate, and where it is not.
29
Note that despite many requests and long delays, consultations were not possible with Department of Mineral Resources and Energy,
Department of Transport, or Transnet.
12THE FRAMEWORK FOR LOGISTICS
3.1. OVERVIEW
With 30,400 track kilometres, South Africa, has the 11 th largest track network in the world. The large
distances between economic hubs in South Africa increases the importance of rail as a mode of
transport. Low cost and efficient logistics are critical for growth as rail logistics allow goods to be
transported from where they are produced to where they are needed, either within the country for
domestic consumption, or to the ports and airports for export.
Despite the part played by rail in the development of South Africa, freight railways have been in
decline for several decades. A shortage of investment has resulted in ageing infrastructure, dated
technologies and depreciating rolling stock. These challenges have impacted the capacity and
reliability of freight railways further eroding the market share of domestic freight movement in favour
of road haulage.
Transnet is the owner of South Africa’s railway, ports and pipeline infrastructure. Transnet’s history
can be traced to the 1870s when the first harbour was built in Cape Town. The rail network emerged
to support the distribution of cargo coming through the port. The discovery of gold in 1867, in the then
Transvaal, catalysed the expansion of railway infrastructure into the interior.
The first iteration of Transnet was established in 1910 called the South African Railways and
Harbours Administration (SAR&H). During the 1970s, government agreed that the SAR&H undergo
restructuring with the ultimate aim of operating as an enterprise rather than a government
department. In 1981 SAR&H was reconstituted as the South African Transport Services (SATS) and
the operations of railway, harbour, road transport, aviation and pipelines were consolidated. In 1990,
with the short-term view of privatisation, SATS was given limited liability company status and
renamed Transnet SOC Limited (Transnet).30 The first pipeline infrastructure was laid in 1965.
Following from the Transport Deregulation Act of 1988, Transnet is now a public company constituted
in terms the South African Transport Services Act, No 9 of 1989. The government is the sole
shareholder in Transnet, and is represented by the Department of Public Enterprises (DPE) which
signs a shareholder compact with Transnet each year. Transnet is regulated by both the Railway
Safety Regulator and the Ports Regulator of South Africa, with the Department of Transport being the
owner of policy for national transport 3.1 is an overview of the structure of Transnet, and other
stakeholders responsible for regulation and policy-making.
30
Transnet Online: About Us – Our History
13Figure 3.1: Structure of Transnet, policy makers and regulators
Source: 1. Transnet Integrated Report, 2018. 2. Transnet Online: About US 3. DPE Consultation
Transnet’s mandate (as stated within Transnet Integrated Report 2018) is three-fold:
1. To assist in lowering the cost of doing business in South Africa;
2. To enable economic growth; and
3. To ensure security of supply by providing appropriate port, rail and pipeline infrastructure in a
cost-effective and efficient manner, within acceptable benchmarks.
Transnet’s value proposition is stated in the Shareholder Mandate as follows.
‘The modernisation and renewal of South Africa’s transport and logistics infrastructure
through strategic investment in rail, ports and oil and gas pipeline infrastructure; cost-
effective logistics value chains; value-added services; and advanced engineering solutions.’ 31
As a large SOE mandated with the ownership and operations of railway, ports and pipeline
infrastructure, Transnet is subject to compliance with a myriad of legislation and national government
policies. In addition, Transnet’s long-term planning is contained in the Long Term Planning
Framework (LTPF) which is produced on a 30 year time horizon. The most recent LTPF was issued in
2017 and it sets out Transnet’s infrastructure planning which aligns to a range of different demand
scenarios. Transnet has also committed to compliance with other international frameworks and
guidelines for governance and reporting, including: King IV, the Global Reporting Initiative and the
International Integrated Reporting (IIR) framework.
31
Transnet Integrated Report, 2018
14The British colonial heritage ensured that the network was built upon a Cape gauge (tracks with
smaller width32) and substantially lower alignment33, gradient34 and axle load35 standards than the
European networks. Narrow gauges now account for less than 10% of global railway networks. This
erodes rail’s inherent global competitiveness in freight hauling. The narrow-gauge technology was
statutorily protected against road competition from the 1930s until the late 1980s.36 The African Union
elected in 2007 to invest in movement to standard gauge following which, Kenya, Ethiopia and
Nigeria all have standard gauge lines operational. South Africa’s only standard gauge lines are the
80kms of rail on which Gautrain operates.
Logistics costs have been rising in South Africa. Figure 3.2 shows that logistics costs have generally
been increasing at rates higher than inflation. There has also been an increase since 2010 and a
steady rise since 2013 in logistics costs as a percentage of transportable GDP. Therefore, it is costing
more year-on-year to move products along the supply chain. Transportation costs were estimated to
comprise around 55% of total logistics costs – of which 80% is attributable to road-hauling.37 This is
compared to a global average of 39%.38 The high proportion of freight costs and road usage indicates
a sub-par provision of efficient rail logistics services for the movement of domestic freight. Priority
must be given to shifting freight transport to rail in order to bring down the cost of logistics and
mitigate the economy’s exposure to exogenous shocks.
Figure 3.2: Transporting goods is becoming more expensive
60,0% 56,0%
52,8% 53,6%
50,5% 51,5%
47,8% 47,9%
50,0%
40,0%
30,0%
20,0%
12,4%
8,4% 8,7%
10,0% 5,4% 5,7% 5,8%
3,6%
0,0% 5,0% 5,6% 5,8% 6,1% 4,9% 6,3%
4,3%
2010 2011 2012 2013 2014 2015e 2016f
% change in logistics costs Inflation rate % of transportable GDP
Source: Professor Jan Havenga; Statistics SA
The Logistics Performance Index (LPI) measures the relative efficiency of international supply chains.
South Africa ranks favourably relative to the sample of 160 countries. Ranking 25 th over the 2010 to
2016 period (Figure 3.3) South Africa is only one of two developing countries within the top 30 LPI
countries and is ranked as more efficient that all the other BRICS countries. In 2016, South Africa
ranked 20th in the world, suggesting that in logistics efficiency has been improving in global terms.
32
Narrow Gauge – 1067mm; Standard Gauge – 1435 mm; Broad Gauge - >1600mm
33
The alignments speak to the direction in which the track in laid. Curved alignments that circumspect varied terrain limit speed
capabilities. Difficult terrain resulted in South Africa’s rail network alignments having tight curves and steep gradients.
34
Refer to previous footnote. Gradient is the vertical alignment of the track. Steeper gradients result in less energy efficiency and
increased maintenance costs caused by excessive breaking.
35
Axle load refers to the weight limit that track can manage. Increased axle load allows for heavier trains, carrying more freight.
36
Department of Transport (2017) Draft White Paper, p6.
37
Havenga, J.H., De Bod, A., Simpson, Z.P., Viljoen, N. & King, D., 2016, ‘A Logistics Barometer for South Africa: Towards sustainable
freight mobility’, Journal of Transport and Supply Chain Management 10(1).
38
Havenga, Freiboth, & Goedhals-Gerber (2018) The Decarbonisation of Transport Logistics: A South African Case, p3.
15Figure 3.3: Logistics Performance Index (LPI) Rank, combined for 2010, 2012, 2014 and 2016
USA 9
South Africa 25
China 26
India 42
Brazil 54
Nigeria 92
Russia 98
0 20 40 60 80 100 120
Source: University of Stellenbosch, South Africa Logistics Barometer, 2016
This good performance is partially driven by the export lines – dedicated routes for the movement of
heavy commodities, to ports for export. These include the main export coal line from the Waterberg
Coal Basin to Richard’s Bay Port Terminal and the iron-ore export line from Sishen, Northern Cape to
the Port of Saldanha. The efficiency of the export lines is evidenced by South Africa’s third and fifth
position in global markets for competitive export of iron ore and coal, respectively.
The transportation of general freight is far less competitive. General freight comprises manufactured
and palletised goods39, agricultural products, non-ferrous metals, containers and automotive freight.
The main general freight arteries run between Cape Town, Johannesburg and Durban.40 The
competitiveness of the general freight lines is constrained by the higher tariffs which can be over
three times that of the mineral export lines. They are also much higher than international averages.
The OECD estimated that general freight tariffs per tonne/km at PPP exchange rates in 2005 were
double that of Russia, and almost three times as high as those in the U.S. and Canada. 41 OECD
estimates for 2009 put general freight tariffs at four to seven times that of US prices. 42
Figure 3.4 shows how road outperforms rail in perceptions of capacity, reliability, service, security and
price.
39
Uniformly packaged freight, generally consumer and manufactured goods.
40
The Durban-Gauteng corridor is referred to as the Natcor channel; the Cape Town-Gauteng corridor as the Capecor
41
Pieterse, Farole, Odendaal, & Steenkamp, (2016) Enhancing South Africa’s export competitiveness: reform of the port and rail network,
p22.
42
World Bank (2014) South Africa Economic Update: Focus on Export Competitiveness, p34.
16Figure 3.4: User perspective of modal performance, 2015
Evaluation of modal performance parameters
1
0,9
0,8
Percentage Score
0,7
0,6
0,5
0,4
0,3
0,2
0,1
0
Capacity Reliability Service Security Pricing
Road Rail Ports Air
Source: Department of Transport (2015), Review of the National Freight Logistics Strategy.
Although South Africa ranks well according to the LPI, there are a number of challenges in the rail
logistics sector:
• Shortage of investment: Under-investment has resulted in inadequate maintenance and
renewal, impacting on Transnet’s capacity to meet demand. For example, in 2013 the
average age of locomotives was over 30 years, whereas the international best practice
average is 16 years.43 Signalling systems are also dated – majority of which are more than
50 years old.44
• Dominance of road transportation: In order to achieve cost-efficiency of logistics more
goods should be transported by rail rather than road. Currently, road transportation
dominates the logistics sector. It is estimated that the optimal mix between road and rail
transport requires that approximately an additional 15% of goods be diverted from road to rail
transportation.45 This will lower transportation costs, as well as reduce carbon emissions and
overuse and damage to the road infrastructure.
• Integration and infrastructure gaps: Rail is constrained by missing intermodal linkages and
terminal hubs. Havenga (2012) purports that 30 cents/tonne kilometre cost saving could be
realised from a 50 per cent shift of long-distance heavy intermodal and siding-to-siding
break-bulk to a core rail network, currently on road.46
• Decline of branch lines: Branch lines, originally built to develop rural areas, have
deteriorated substantially. About 6,5% of South Africa’s total surface freight transported is
43
PwC (2013), Africa Gearing Up, p72; Pieterse, Farole, Odendaal, & Steenkamp, (2016) Enhancing South Africa’s Export
Competitveness.
44
Pieterse, Farole, Odendaal, & Steenkamp, (2016) Enhancing South Africa’s Export Competitveness, p32.
45 University of Stellenbosch, Havenga, J. Simpson, Z. ‘South Africa’s logistics position and the role of Transnet Freight Rail’, 2019
46
Havenga,(2012) Rail renaissance based on strategic market segmentation principles
17carried next to or on the branch lines – of which about 14% is being carried by rail. Further,
only about half of rail sidings are currently active. 47
• Regulation: Price regulation within the transport sector is non-existent beyond the ports. The
sector became deregulated in the 1970s and since then the competitiveness of rail has
declined, impacted notably by the lack of internalisation of externalities road transportation
(these include a more rapid deterioration of the road network and road injuries/fatalities).
Further, the authority of the Rail Safety Regulator is eroded by the presence of two state-
owned, vertically integrated rail operators.
These aforementioned challenges have culminated in a Transnet logistics network that in parts is
uncompetitive, inadequately capitalised and operationally inefficient, unable to meet domestic
logistics requirements or support global competitiveness.48
3.2. LINKING TRANSNET’S PERFORMANCE TO THE NDP
In linking the NDP to Transnet performance, start with the following aspiration for Transnet:
A Transnet that contributes to the goals of the NDP would lower the cost of doing
business and ensure security of supply by providing appropriate port, rail and
pipeline infrastructure in a cost-effective and efficient manner, within acceptable
benchmarks.
Then, using eleven outcomes as themes, the performance framework for Transnet is established in
the box below:
47
Havenga & Simpson, (2010) Revitalisation of branch lines in South Africa: A long-term view for sustainability
48
Draft White Paper on National Rail Policy, 2017.
18Operational outcomes that must be achieved Transnet to achieve the NDP
1. Core mandate (commercial): Transnet achieves the core mandate if it:
1. Provides for the movement of domestic goods in a reliable and cost-efficient manner;49
2. Contributes to growth through trade by promoting export line and port efficiency;50
3. Promotes effective intermodal linkages to maximize freight hauling and distribution efficiency.51
2. Developmental mandate: Transnet achieves a developmental interest if it promotes growth in the rural
economy, particularly in the agricultural sector, through assisting with rural extraction and delivery to
markets.52
3. Financial sustainability: Transnet must be financially viable as a going concern and sustains the asset
base and balance sheet in order to make capital investment, and maintain and expand services.53
4. Transformation responsibility: Transnet promotes equitable reordering of the economy through
internal transformation (re employment equity, training, and procurement).54
5. Environmental responsibility: Transnet promotes the transition to a low-carbon economy by providing
legitimate alternatives to transport by road.55
6. Specific projects: Transnet has completed or progressed the nine specific projects assigned to it in the
NDP (see list in framework following).56
Fundamental governance enablers that must be achieved to reach the outcomes
7. Clear institutional governance: The responsibility of policy ministry, shareholder ministry, funding
ministry, and planning ministry is clear.57
8. Clear written mandate: Transnet has a well-defined mandate (or shareholder compact) that sets out its
role and is precise about what public good the SOE provides and how it serves the public interest. 58
9. Leadership: Senior appointments are credible. There is stability in senior appointments. Leadership
behaves ethically and builds a corruption-free culture.59
10. Expertise: Transnet has a long-term technical expertise strategy which is being implemented. 60
11. Partnerships: Transnet has an effective framework that promotes private sector participation, and there
is private sector participation.61
49
NPC (2012) National Development Plan – 2030, p183
50
Ibid, p246, 438
51
Ibid, p183 and 186
52
Ibid, p89 and183.
53
Ibid, p440.
54
Ibid, p138.
55
Ibid, p183.
56
Ibid, p186-189.
57
Ibid, p45, 74, 441
58
Ibid.
59
Ibid.
60
Ibid, p426, 439.
61
Ibid, p189.
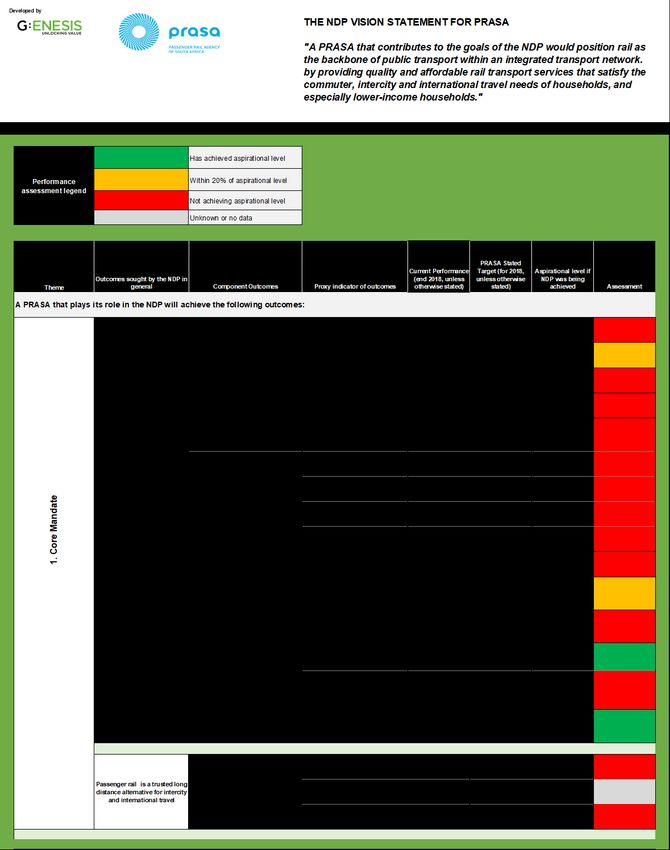
193.3. EVIDENCE OF PERFORMANCE
THE
THE NDP
NDP VISION
VISION STATEMENT
STATEMENT FOR
FOR TRANSNET
TRANSNET
Developed by
Developed by "A
"A Transnet
Transnet that
that contributes
contributes to
to the
the goals
goals of
of the
the NDP
NDP
would lower the cost of doing business and
would lower the cost of doing business and ensureensure
security
security of
of supply
supply by
by providing
providing appropriate
appropriate logistics
logistics
infrastructure and services in a
infrastructure and services in a cost-effective
cost-effective and
and
efficient manner."
efficient manner."
Performance Rating legend
Performance Rating legend
Has achieved aspirational level
Has achieved aspirational level
Performance Assessment Within 20% of aspirational level
Performance Assessment Within 20% of aspirational level
Legend Not achieving aspirational level
Legend Not achieving aspirational level
Unknown or no data
Unknown or no data
Current Transnet
Current Transnet
Performance Stated Target
Performance Stated Target
(end 2018, (for 2018, Aspirational
(end 2018, (for 2018, Aspirational
unless unless level if NDP
unless unless level if NDP
Outcomes sought by Component Proxy indicator otherwise otherwise was being
Outcomes sought by Component Proxy indicator otherwise otherwise was being
Theme the NDP in general Outcomes of outcomes stated) stated) achieved Assessment
Theme the NDP in general Outcomes of outcomes stated) stated) achieved Assessment
A Transnet that meets the goals of the NDP would therefore:
A Transnet that meets the goals of the NDP would therefore:
GFB (RAMS
Market share of GFB (RAMS
Freight rail is an Market share of % NTK): 31
Freight rail is an domestic freight % NTK): 31
attractive method domestic freight 25,70 Intermodal 40,30 0,64
attractive method that could be 25,70 Intermodal 40,30 0,64
of moving goods that could be (RAMS %
of moving goods moved by rail (%) (RAMS %
moved by rail (%) NTK): 15
NTK): 15
The network is
The network is
used to a high General Freight
used to a high General Freight
capacity (a Freight Density 5,08 >5.8 10 0,51
capacity (a Freight Density 5,08 >5.8 10 0,51
densified (GTK/routekm)
densified (GTK/routekm)
network)
network)
General Freight
General Freight
Trains are reliable wagon
Trains are reliable wagon 10,01 9,90 7,00 0,57
and run on time turnaround time
mandate
10,01 9,90 7,00 0,57
and run on time turnaround time
Coremandate
(days)
(days)
Number of
Number of
operational safety
operational safety
occurrences and
Provide for the occurrences and 13258 No target 6631 0,50
security-related
1.1.Core
Provide for the 13258 No target 6631 0,50
movement of goods security-related
movement of goods incidents (All
in a reliable and cost- Freight transport incidents (All
in a reliable and cost- Freight transport Operators)
efficient manner by rail is safe Operators)
efficient manner by rail is safe
(excludes export iron
(excludes export iron Disabling Injury
ore and coal) Disabling Injury
ore and coal) Frequency Rate
Frequency Rate 0,91Current Transnet
Performance Stated Target
(end 2018, (for 2018, Aspirational
unless unless level if NDP
Outcomes sought by Component Proxy indicator otherwise otherwise was being
Theme the NDP in general Outcomes of outcomes stated) stated) achieved Assessment
Pipelines volumes
16,3 17,6 21,7 1
(billion litres)
Pipelines are
efficient and
reliable Pipelines ordered
vs delivered
volumes (% of 93,00 95,00 100,00 0,93
deliveries within
5% of order)
Planned vs actual
Provide for the delivery time (%
movement of goods of deliveries within
86,00 85,00 100,00 0,86
in a reliable and cost- two hours of
efficient manner scheduled
(excludes export iron delivery time)
Pipelines are
ore and coal)
efficient and Capacity
reliable utilisation for
Durban-
Johannesburg
115:148 118:148 128:148 0,90
pipelines and
New Multi-
Product Pipeline
(Ml/week)
Export Coal Freight
36 38 0,95
Density (tonkm)
1. Core mandate
Export Coal cycle
Contribute to growth 62,60 56,00 56,00 0,88
time (hours)
through trade by Rail is efficient on
promoting export and export lines (coal
import line and port and iron ore)
efficiency
Export Iron Ore
volumes transported 58,50 60,00 62,23 0,94
(mt)
Export Iron Ore
86,80 76,00 68,00 0,72
cycle time (hours)
Moves per gross
25,20 29,60 35,00 0,72
crane hour
Ports are efficient in
processing exports
Container Dwell time
5,73 4,90 3,50 0,36
exports (days)
21Current Transnet
Performance Stated Target
(end 2018, (for 2018, Aspirational
unless unless level if NDP
Outcomes sought by Component Proxy indicator otherwise otherwise was being
Theme the NDP in general Outcomes of outcomes stated) stated) achieved Assessment
Average moves per
ship working hour 46,20 56,20 >60 #VALUE!
(number)
Gross loading rate
8576 8094 8576 1
(ton/hour)
Average Train
turnaround time 3,95 5,83 3,90 0,99
(hours)
Average Truck
turnaround time 0,67 0,58 0,58 0,85
(hours)
Anchorage Waiting
50,95 34,17 24,67 -0,07
time (hours)
Average ship
turnaround time 46,20 36,60 25,00 0,15
1. Core mandate
Ports are efficient in (hours)
processing exports
Contribute to growth
through trade by Average Berth
62,60 68,00 68,00 0,92
promoting export and occupancy (%)
import line and port
efficiency Total Port costs to
cargo owner
automotive (% 172,00 146.95 10,00 0,00
deviation from global
average)
Total Port costs to
cargo owner
containers (% 267,00 271,00 10,00 0,00
deviation from global
average)
Total Port costs to
cargo owner coal (%
-62,00 -53,00 -10,00 0,00
deviation from global
average)
Total Port costs to
cargo owner iron ore
-26,00 -55,57 -10,00 0.4
(% deviation from
global average)
Africa sales revenue
3267,80 3527,30 3785,00 1
(Rmillion)
Rail is integrated
with other countries
Cross-border
9,27 9,17 12,31 0,75
volumes (mt)
Cost (Rbillion) of
road vs intermodal 13,80 No target 6,00 -0,30
freight movement
Promote effective
There is cost-
intermodal linkages to Intermodal market
efficient freight
maximise freight hauling share (Rail
connectivity between 24,00 15,00 43,00 0,56
and distribution Addressable Market
rail and other modes
efficiency Share % Net Ton
Palletised market
0,10 No target 21,50 0,00
share on rail (%)
Rural freight market 22
21,90 ?
share (%)
There is connectivity
with rural marketsCurrent Transnet
Performance Stated Target
(end 2018, (for 2018, Aspirational
unless unless level if NDP
Outcomes sought by Component Proxy indicator otherwise otherwise was being
Theme the NDP in general Outcomes of outcomes stated) stated) achieved Assessment
Rural freight market
21,90 No target ?
share (%)
There is connectivity
with rural markets
Branch line
2. Developmental Mandate
concessions 3,00 2,00 As viable
concluded
Promote growth in the
Rural agricultural
rural economy,
production Agricultural freight
particularly in the 5,10 No target ?
supported by market market share (%)
agricultural sector,
connectivity on rail
through rural extraction
and delivery
Number of sidings
1160,00 No target 3000,00 0,39
active
Access is to freight
transport is widely
available
Density on branch
0,10 No target ?
lines (tkm/routekm)
Capital investment
Ability to expand and dedicated to
25,00 34,00 34,00 0,74
maintain operations expansion (% of
capital expenditure)
A level of investment
able to expand and Average age of
maintain operations 29,65 25,00 16,00 0,15
locomotives
Ability to create
capacity ahead of
demand
Ratio of resourced
capacity to
50,00 65,00 70,00 0,71
3. Financial Sustainability
theoretical capacity
(%)
The SOE is a going
Material Uncertainty No target Yes
concern
Revenue % change
Strong balance sheet
The SOE is financially from previous year 11,32 16,68 16,68 0,68
through improved
sustainable (%)
levels of equity
EBITDA margin (%) 44,61 41,50 44,92 0,99
Proportion of labour
costs to overall
60,00 No target 33,00 0,18
operating expenses
There is effective (%)
management of
operating expenses
Expense ratio
0,55 No target 0,42 0,68
(opex/revenue)
23Current Transnet
Performance Stated Target
(end 2018, (for 2018, Aspirational
unless unless level if NDP
Outcomes sought by Component Proxy indicator otherwise otherwise was being
Theme the NDP in general Outcomes of outcomes stated) stated) achieved Assessment
Cash flows from
3. Financial Sustainability
operating activities 22958,00 21215,00 28572,00 0,80
(Rmillion)
Gearing (%) 43,40 2.5 3,30 0,91
(times)
Investment grade
stand alone credit Yes; Baa3/BBB No target Yes; >Baa3/BBB
profile
4. Clear written mandate
Transparent
Publicly available
disclosure of
shareholder
shareholder
compacts with Yes No target Yes
compacts (except for
A clear and transparent distinctly articulated
business sensitive
shareholder compact, targets
information)
serving a long-term
strategy, that is made
publicly available
Valid documentation Auditor qualifications
to support reported of reported 5,00 No target 0,00 -3,00
performance performance
Ratio of acting
positions to
Stability of permanent contracts
71,00 No target 15,00 -2,73
leadership at executive
committee level
(steady state %)
Irregular expenditure
excluding existing
8123,10 No target 0,00 -8121,10
irregular contract
value (Rmillion)
Losses through
criminal conduct:
0,80 No target 0,00 1,20
collusion and fraud
5. Leadership
Leadership exhibits (Rmillion)
There is stability in strong ethical
senior appointments. standards Fruitless and
wasteful expenditure 18,70 No target 0,00 -16,70
Leadership behaves
(Rmillion)
ethically and builds a
corruption-free culture.
Audits should be
Yes No target No
unqualified
Irregular expenditure
not condoned, that
is either recovered or 6,25 No target 100,00 0,06
under investigation
Accountability of (%)
leadership
C-suite performance
agreements based
Yes No target Yes
on shareholder
compact
24Current Transnet
Performance Stated Target
(end 2018, (for 2018, Aspirational
unless unless level if NDP
Outcomes sought by Component Proxy indicator otherwise otherwise was being
Theme the NDP in general Outcomes of outcomes stated) stated) achieved Assessment
Achievement of KPIs
set out in
57,00 100,00 100,00 0,57
shareholder
compact (%)
Competent
leadership
6. Expertise
Required expertise
Transnet has a long-term and experience of Not fully No target Yes
technical expertise board met
strategy which is being
implemented.
Transnet has a long- Fully articulated
term technical action plan for
expertise strategy recruiting, retaining Not sure No target Yes
with is being and developing
implemented techincal expertise
The Draft PSP
Increased private (Private Sector
7. Partnerships
investment and Participation)
market share of Framework No target 5%
There is use of an private ownership of (Transport Chapter)
Private sector ports and rail has been approved
effective framework that
participation is by Cabinet.
promotes private sector
promoted
participation
Number of
transactions/conces 3 5 As viable
sions concluded
Governance
Institutional
8. Clear
The responsibility of policy ministry, shareholder ministry, funding ministry and regulator is clear. To be completed as part of Report 3
Carbon overspend
9. Environmental Sustainability
due to road-rail 12,00 No target 1,00 -10,00
balance (%)
Carbon emissions are
minimised Carbon emission
intensity
2,66 >0.85 2,66 1,00
(KgCO2/ton)
reduction (%)
Promote the transition to
a low-carbon economy Gross ton kilometers
by providing legitimate to Net ton kilometers
1,40 1,70 1,70 0,82
alternatives to transport - General Freight
by road Business (ratio)
Assets are being
Gross ton kilometers
utilised effectively to
to Net ton kilometers 1,26 1,60 1,60 0,79
manage energy
- Export Coal (ratio)
consumption
Gross ton kilometers
to Net ton kilometers
1,20 1,40 1,41 0,85
- Export Iron Ore
(ratio)
25Current Transnet
Performance Stated Target
(end 2018, (for 2018, Aspirational
unless unless level if NDP
Outcomes sought by Component Proxy indicator otherwise otherwise was being
Theme the NDP in general Outcomes of outcomes stated) stated) achieved Assessment
Black African
employees (% of 86,10 88,00 78,80 1,09
toal employee pool)
Racial equity in
senior management,
Not reported No target 78,80
(black employees as
% of total)
Racial equity in
professionals and
middle
Not reported No target 78,80
management, (black
Company
employees as % of
demographics reflect
total)
country
demographics Gender equity in
senior management,
36,40 50,00 45,30 0,80
(female as % of
total)
Gender equity in
10. Additional Transformation Responsibility
professionals and
middle
39,70 50,00 45,30 0,88
management,
(female as % of
total)
B-BBEE score 90,83 107,00 >100 0,91
Increase linked to
Artisans are being
202 >160 rate of business
developed
Promote equitable growth
reordering of the
economy through Increase linked to
Technicians are
internal transformation 201 >160 rate of business
being developed
growth
Transnet promotes
Increase linked to
industrial capability Engineers are being
100 >80 rate of business
building develped
growth
Increase linked to
Sector-specific skills
1516 >764 rate of business
are being developed
growth
Local content (% of
82,16 >75 As viable
total spend)
B-BBEE spend (%
of Total Measured 86,88 >70 78,80 1,10
Procurement Spend)
Qualifying Small
Enterprises (% of 9,06 >5 >10 0,91
TMPS)
Transnet Exempted Micro
procurement Enterprises (% of 8,32 >7 >10 0,83
practices promote TMPS)
economic
transformation Black-women owned
31,44 >5 36,00 0,87
(% of TMPS)
Black-youth owned
0,76 >2 2,00 0,38
(% of TMPS)
People with
disabilities (% of 0,08 >0.125 >0,2 0,40
TMPS)
26You can also read