Racing Industry Transition Agency - New Zealand Racing Board Performance and Efficiency Report - TAB NZ
←
→
Page content transcription
If your browser does not render page correctly, please read the page content below

Racing Industry Transition Agency
New Zealand Racing Board Performance and
Efficiency Report

September 2019

Murray Chandler                           Russell Moore
Partner                                   Partner
T +64 (0)4 474 8500                       T +64 (0)9 308 2570
E murray.chandler@nz.gt.com               E Russell.moore@nz.gt.com

© 2019 Grant Thornton New Zealand Ltd | RITA Performance and Efficiency Report | September 2019

Private and Confidential
Grant Thornton New Zealand Ltd
PO Box 1961
Auckland 1140
The Board New Zealand
Racing Industry Transition Agency
106-110 Jackson Street T +64 (0)9 300 5800
Petone F +64 (0)9 300 5805
Wellington www.grantthornton.co.nz
19 September 2019
Dear Board
Performance and Efficiency Audit of the Racing Industry Transition Agency (RITA)
We have pleasure in presenting our report for the recent Performance and Efficiency Audit, required under section 14 of the Racing Act 2003.
This review was conducted between June and July 2019 in accordance with the Terms of Reference approved by the Minister for Racing. We would like to take this opportunity to thank
the staff of the Racing Industry Transition Agency for the cooperation and assistance provided. Please contact the undersigned if you have any queries in respect of this report.
Yours sincerely
Murray Chandler Russell Moore
Partner Partner
Grant Thornton New Zealand
Member firm within Grant Thornton International Ltd
© 2019 Grant Thornton New Zealand Ltd | RITA Performance and Efficiency Report | September 2019 2
Contents

Part A                                                                                 Page       Part B                                      Page
1. Executive Summary                                                                        4     1.   Background to the Audit                  48
2. NZRB strategy                                                                          10      2.   Governance and Management Mechanisms     55
3. Financial Analysis                                                                     33      3.   Specific Statutory functions             60
                                                                                                  4.   Terms of Reference                       77
                                                                                                  5.   2014 Audit Findings                      82

© 2019 Grant Thornton New Zealand Ltd | RITA Performance and Efficiency Report | September 2019                                                      3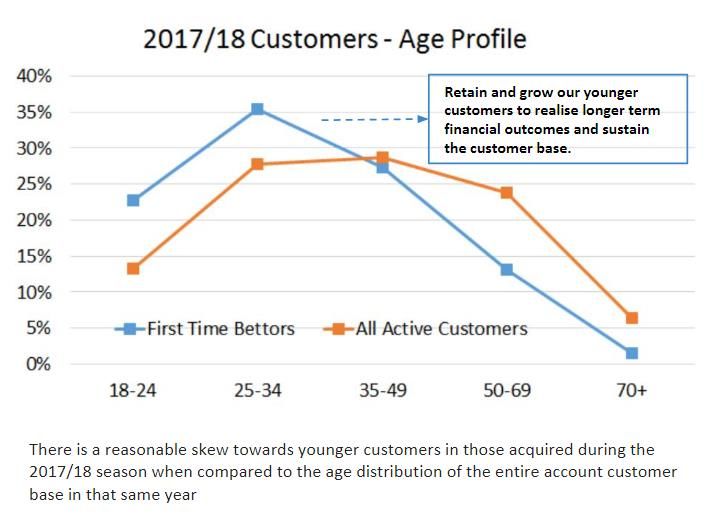
Part A     Executive summary
Section 1:

 01. Executive summary

 02. NZRB Strategy

 03. Financial Analysis

© 2019 Grant Thornton New Zealand Ltd | RITA Performance and Efficiency Report | September 2019

Executive summary

Headlines
Background and recent historical context                                                                  Strategy
•   The New Zealand Racing Industry is estimated to be responsible for generating more                    •   During the period the NZRB undertook significant investment in virtually all areas of its
    than $1.6 billion in value added contribution to the New Zealand economy.                                 business to overcome years of under-investment in key systems and processes. In the
                                                                                                              review period the NZRB has invested over $90m in their key strategic initiatives
•   Racing is a significant industry with approximately 14,400 full time employees. In total,
                                                                                                              including vision capture project, the new FOB platform, customer management and
    58,100 individuals participate in the New Zealand racing industry as employees,
                                                                                                              retail network refresh, effectively modernising every aspect of its interaction with its
    participants or volunteers. Many participants hold more than one role within the industry.
                                                                                                              customers.
•   Over the period domestic race numbers remained flat overall but this overall trend
                                                                                                          •   The most significant project was the development and implementation of the Fixed
    shields a decline in equine races and a growth in greyhound racing:
                                                                                                              Odds Betting (FOB) platform. Undertaken in conjunction with an international supplier
    Domestic Race Numbers                            2015           2019       # Change      % Change         the FOB platform went live in January 2019, 5 months later than planned, more
                                                               Unaudited                                      expensive than planned ($1m or 2.6%) and largely to specification with some
    Thoroughbred Races                           2,790          2,582           -266              -9.3%       functionality still to be implemented. FOB was a complex project which is now
                                                                                                              operational, although it is yet to produce the full financial benefits anticipated (although
    Harness Races                                2,595         2,.469           -185              -7.0%
                                                                                                              FOB has only been live since January 2019).
    Greyhound Races                              5,573          5,907            554              10.3%
    Total Domestic Races                        10,958         10,958            103               0.9%   •   The Customer and Channels initiative focused on improving the customer experience
•   It is noted that less betting turnover per race is generated, on average, on a greyhound                  (both virtual and physical) as well as attracting and retaining customers, with particular
    race than an equine race.                                                                                 emphasis on the important elite customers. Over the period active customer numbers
                                                                                                              have increased by 49% to 230,000, with the majority of the new customers betting on
•   The betting market continued to be challenging with on-going domestic and international                   sports.
    competition for the gambling dollar and the growth in racing fixed odds betting has been
    offset by the decline of totalisator racing betting. In the period race betting turnover              •   The Vision Capture project, which was the second largest strategic initiative capital
    decreased by $17m to $1,651m, while racing betting margin increased 0.5% to 17.6%.                        investment is on track to be delivered on time and under budget.

•   Sports betting turnover increased by 56% to $634m, growing from 19.5% of total betting                •   RITA’s key role is in funding the racing industry through gambling and gaming. The
    turnover to 27.7%. Sports betting margin decreased by 0.3% over the period to 9.3%.                       strategy and resulting strategic initiatives were focused changes which were calculated
                                                                                                              to drive significant increases in revenue.
•   Overall betting turnover increased by 10.2% and overall betting net margin fell by 0.9%
    over the period to 12% due to the changes in product mix described above.                             •   While the key funding role has not changed it has become more explicit post the
                                                                                                              Messara Report as RITA is expected to transition the organisation to a purely
•   Over the period NZRB’s performance has become increasingly dependent upon sports                          commercial role.
    and fixed odds betting, as well as gaming revenue.
•   The racing industry was described by the Minister for Racing1 as being in “a state of
    serious decline”. The racing industry review by John Messara, formation of the
    Ministerial Advisory Committee (MAC) and Racing Industry Transition Agency (RITA)
    were all designed to help ensure the long term viability of the NZ racing industry.

1.  Ministerial Media Release, 17 April 2019
2.  NZRB state that $10.8m of the costs relate to IBM licence costs which have a wider NZRB use
© 2019 Grant Thornton New Zealand Ltd | RITA Performance and Efficiency Report | September 2019                                                                                                            5
Executive summary

Headlines (continued)
Financial Impact over period
                                                                                                   Item                                     2015        2019    $ Change   % Change
•   As can be seen in the following table, racing turnover remained flat while sports and
                                                                                                                                                    Unaudited
    gaming turnover have increased significantly. While racing turnover has decreased
    from 70% of total turnover to 59% of total turnover in the period, it remains the              Racing Turnover ($m)                    1,668       1,651         -17       -1%
    predominant contributor to RITA revenues.                                                      Sports Turnover ($m)                      405         634        229     +56.5%
•   Between 2015 and 2019 totalisator race betting turnover fell by 25% ($298m), while
                                                                                                   Betting Turnover ($m)                   2,073       2,285        212     +10.2%
    fixed odds race betting increased by 61% ($281m) and fixed odds sports betting
    increased by 57% ($229m). The move away from totalisator betting to fixed odds                 Gaming Turnover ($m)                      317         513        196     +61.8%
    betting is an international customer preference trend.
                                                                                                   Total Turnover ($m)                     2,390       2,798        408     +17.1%
•   Total betting turnover has increased by 10.2% with the growth in sports betting
    offsetting the decline in race betting, the change in betting mix has reduced margins by       Net Betting Margin                     12.9%       12.0%                   -0.9%
    0.9% to 12.0%.                                                                                 Total revenue                             332         336         4.6     +1.4%
•   Turnover related expenses have increased by 0.1% over the period compared to an                Turnover Related Expenses               (64.6)      (65.3)       -0.7     +0.1%
    increase in total turnover of 17.1%. Operating expenses have fallen by 1.0% over the
    period pre-strategic initiative costs. Including strategic initiative costs, operating costs   Operating Expenses                     (127.8)    (126.5)         1.2      -1.0%
    total $133.9 in 2019 (unaudited) an increase of 4.8% over the period.                          Operating Profit (Normalised)           139.1       144.4         5.3       +3.8
•   Operating profit (normalised) has increased by 3.8% over the period.                           Strategic Initiatives and other one-        5        (7.4)       -9.6    -195.5%
•   Net profit (post strategic initiatives) fell 4.9% over the period.                             off items
                                                                                                   Net Profit                              144.0       137.0        -7.0      -4.9%
•   Distributions to the Codes have increased by 13% over the period. Without the
    decision to distribute the $12m additional funding and $2.6m TRLP funding, the                 Distribution to Codes ($m)              134.2       137.0         2.8     +2.1%
    distributions would have increased by 2.1% over the period.                                    Additional Funding ($m)                      -       12.0        12.0
•   During the period NZRB have spent over $90m (opex and capex) on the strategic                  TRLP payments ($m)                                    2.6         2.6
    initiatives primarily the FOB platform, Vision Capture and Customer and Channels
    initiatives, all of which are consistent with the NZRB strategy, as well as AML which is a     Total Distribution ($m)                 134.2       151.6        17.4    +13.0%
    legislative obligation that came into effect 1 August 2019. NZRB also spent $10.7m on
                                                                                                   Strategic Initiative Investment ($m)         -       45.8        45.8
    five year enterprise IT licensing in the period.
                                                                                                   NZRB Bank Debt ($m)                          -       35.0        35.0
•   The quantum of these investments and the decision to increase distributions has driven
    the decrease in NZRB equity and the increase in debt over the period with equity               NZRB Equity ($m)                         70.8        23.4       -47.4     -66.9%
    reducing from $71m to $23m.

© 2019 Grant Thornton New Zealand Ltd | RITA Performance and Efficiency Report | September 2019                                                                                  6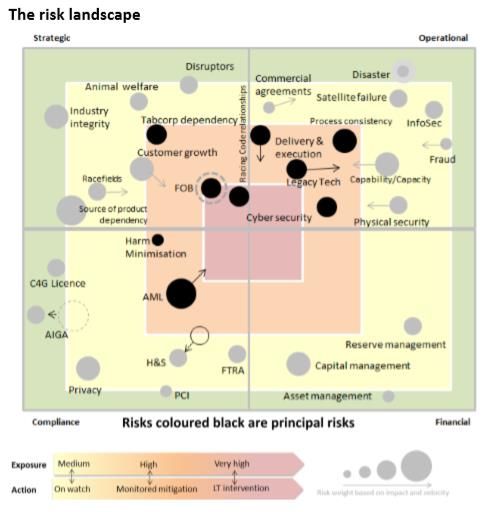
Headlines (continued)
Operating cost management
•   The NZRB has had a on-going focus on keeping costs down over the review period.               •   Approximately 40% of staff are involved in customer facing functions, the majority of
    This has been supported by cost transformation projects across most areas of spend                which relate to the retail network, 26% with broadcasting and 11% with betting
    and a number of business unit specific cost initiatives.                                          operations and 12% with Technology.

•   Staff expenses (excluding strategic initiatives) have fallen by 9.5% or $6.0m over the        •   NZRB analysis, based on a commissioned job sizing benchmarking in 2019, indicates
    period. Including strategic initiative costs staff expenses have fallen by $2.3m over the         approximately 65% of NZRB personnel are paid below the midpoint of benchmark
    period.                                                                                           market bands (total fixed remuneration).

•   Operating expenses (excluding strategic initiatives costs) decreased at an annual             •   The business is currently expanding the adoption of agile methodology. Implementation
    compound growth rate of 0.24% between FY15 to FY19. Operating expenses                            has focused on Technology, Product and Customer teams in addition to the strategic
    (excluding strategic initiatives) for FY19 are marginally lower than the corresponding            initiatives.
    amount in FY15. After adjusting for inflationary effects in our review period for FY15
    results, operating expenses have reduced by $8 million (excluding strategic initiatives)      Governance framework and management mechanism
    Including strategic initiative costs, operating expenses increased by $14m over the           •   The newly formed RITA Board are Ministerial appointments, the Board is diverse and
    period (annual compound growth rate of 2.68%). After adjusting for inflationary effects,          represents members from various backgrounds. The new Board is supported by an
    operating expenses have increased by $8m (including strategic initiative costs).                  established Chief Executive Officer (CEO) and leadership team.
•   Turnover related expenses increased over this period at an annual compound growth             •   In the second half of FY19 the leadership team was reorganised into 6 domains of
    rate of 1.23% between FY15 to FY19 compared to annual compound growth of 4.02%                    accountabilities in order to move to a new operating model based on the extensive use
    for betting and gaming turnover.                                                                  of agile teams. Adopting this model was a deliberate move by the NZRB to become
                                                                                                      more customer-led.
•   Communications and technology costs (excluding strategic initiatives) had the most
    significant annual compound growth between FY15 to FY18 due to the implementation             •   The policy and procedures structure has matured over the last 4 years, however some
    of the IT managed service agreement with Spark under the Optimus programme (to                    policies require review and update. The ownership of policies has been defined and
    upgrade and virtualise IT) which increased costs from $9.6 million in FY15 to $16.6               documented, however some polices are due for a refresh.
    million in FY16 with some further increases between FY16 to FY18 although not at the
    same level. Communications and technology costs reduced from $19.1 million in FY18            Statutory functions
    to $18.7 million in FY19 (unaudited). Including strategic initiative costs, communications
                                                                                                  •   The statutory functions, as detailed in the Specific Statutory Functions section (below)
    and technology costs have increased from $9.6m in FY15 to $26.1m in FY19
                                                                                                      are being complied with. The core functions of conducting race and sports betting and
    (unaudited).
                                                                                                      the resultant distributions to the codes have been the focus of the strategic initiatives.
•   Strategic costs were separately presented in the annual report from FY17 onwards                  Many of the other industry functions of NZRB may be devolved to the Codes as
    where a total of $17.9 million has been noted as spent between FY17 and FY18 with                 envisaged by the Messara Report
    further spend of $16.9 million in FY19 (unaudited).                                           •   Key strategic initiatives have been consistent with NZRB statutory objectives and
                                                                                                      functions and are intended to address long term fundamental issues that have
People capability
                                                                                                      previously limited the NZRB’s performance.
•   Over the last 5 years NZRB has actively managed staff numbers, with FTE falling by
    133 or 17% over the period from 2015. However, the reduction in staff numbers has             •   We note the Racing Reform Bill No.1 (2019) has created additional objectives and
    not had any material impact on the overall capability required to carry out standard BAU          functions for RITA to deliver on.
    operations and services and deliver the key strategic initiatives.
© 2019 Grant Thornton New Zealand Ltd | RITA Performance and Efficiency Report | September 2019                                                                                                    7
Executive summary

Headlines (continued)

2019 Financial Impact                                                                               •   The draft budgeted net profit in FY20 of $165.8m depends on a number of key
•   This year has seen slight turnover growth, but reducing margins and a significantly                 performance measures being met including (a) a significant improvement in revenue
    reduced profit when compared to budget. The (unaudited) profits of $137m is down                    generated from the new Fixed Odds Betting (FOB) system, (b) continued development
    $8.9m on the prior year and down $36.5m on the budget of $173.5m.                                   of new products and services, (c) a stable margin environment, (d) closely monitoring
                                                                                                        the impact of the anti money laundering legislation (AML), (e) delivering on-going cost
•   The 2019 budget included significant benefits anticipated from the key strategic                    savings and (f) the retention and growth in elite customer numbers.
    initiatives of $14.2 million. The delay in the launch of the Fixed Odds Betting platform
    and anticipated revenue from Betting Information Use Charge and Point of
    Consumption charge (offshore charges) legislation, combined with limited betting                Racing Reform Bill No.1 (2019)
    activity from high value elite customers in the first half of the year and significant margin   •   In December 2018, the Minister for Racing (the Minister) established the MAC to
    compression experienced internationally in sport in the second half of the year,                    operationalise the Messara Report. When the Racing Reform Bill No.1 (2019) come
    adversely impacted the NZRB profit result when compared to budget. We note,                         into being in July 2019, the NZRB Board was disestablished and the RITA Board
    management are still confident FOB will deliver significant benefits over its 10 year life.         established. The RITA Board is made up of all the previous members of the MAC plus
                                                                                                        one other, and has been given a specific change mandate to improve the racing
•   Racing betting margin fell marginally and sport betting margin fell by 1.1% in 2019.
                                                                                                        industry’s sustainability.
•   Customer numbers continued to increase in 2019, with an increase in elite customers
    numbers in the second half of the year.                                                         •   The Minister for Racing has issued his Letter of Expectations to the RITA Board, this
                                                                                                        makes the Minister’s desire for change clear and has set RITA a series of challenging
•   Operating costs were reduced by $8m (6%) in 2019, primarily through reductions in                   targets. This includes driving organisational change while maintaining business as
    staff costs ($1.6m), depreciation ($3.0m) and other costs ($2.2m) with the $1.2m                    usual operations. One of the challenges set in the Letter is the expectation that RITA
    reduction in consultants spend being the largest single contributor to the reduction in             will maintain the current level of overall funding to the codes while ensuring that there is
    other costs.                                                                                        no further deterioration in RITA’s balance sheet. This would be a reversal of recent
                                                                                                        trends as total distributions to the codes in FY19 were $151.6m while net profit was
•   Operating profit (normalised) fell by $10.5m or 6.8% to $144.4m.
                                                                                                        $137m and its equity position has reduced by $47.4m over the period. Accordingly,
•   Net profit (post strategic initiatives) fell $8.9m or 6.1%, producing a net profit of $137m         significant profit improvement is required to meet the Minister’s expectations.
    for the year.
•   On 3 April 2019 in its “Industry Update” the NZRB communicated with the Codes that it
    was not on track to meet the original budget of $173.5m but did “anticipate a net profit
    before distributions ahead of last year of around $155m”. In its June Industry update
    the NZRB confirmed the FY19 distribution amount and also communicated downside
    risks to the previously communicated forecast. Feedback we received from the Codes
    emphasised that some of the Codes “don’t trust the numbers” and that communication
    was not transparent.

© 2019 Grant Thornton New Zealand Ltd | RITA Performance and Efficiency Report | September 2019                                                                                                    8
Executive summary

Headlines (continued)

Conclusions
In 2015, the new management team of the NZRB inherited the impact of a number of long             The NZ racing industry continues to face a wide range of challenges and issues, these
term trends including the growth of fixed odds and sports betting, the decline of totalisator     have been well documented in the Messara Report on the state of the industry. The
betting, increasing international competition, reduced domestic race numbers and an aged          Department of Internal Affairs in its 2019 Regulatory Impact Assessment (RIA) stated “The
technology infrastructure which was no longer fit for purpose.                                    racing industry is in a state of decline.” The RIA goes on to state “The Department of
                                                                                                  Internal Affairs considers that the magnitude of the changes sought in the reforms exceeds
While NZRB’s strategies may have been sound, the full benefits in relation to the FOB             the current mandate of the NZRB.”
platform are yet to be realised. FOB was delivered 5 months late, $1m (approx. 3%) over
budget, and largely to specification with some further functionality yet to be delivered. The     In July 2019 the RITA Board inherited similar macro trends but a new set of challenges
long term benefits from the strategic initiatives are hard to assess given the benefits are       around preventing further deterioration of the balance sheet, a commitment to maintaining
expected over the longer term (10 years).                                                         the distribution payment to the codes at the same level as that paid in FY19, the delivery of
                                                                                                  benefits from the investment in strategic initiatives and operationalising the key
In 2017, the NZRB Board made the decision to increase distributions to the Codes in               recommendations of the Messara report, the success of which is considered critical to the
response to feedback regarding industry confidence. This decision was made while NZRB             revitalisation and long term health of the NZ racing industry.
was part way through investing over $90 million into its strategic initiatives. In FY18 and
                                                                                                  Managing the business and achieving the required growth within these balance sheet
FY19 an additional $12m (per year) was distributed to the Codes underpinned by NZRB’s
                                                                                                  constraints and revenue growth projections will present the RITA Board and Management
expectation around the benefits that would flow from strategic initiatives and a legislation
                                                                                                  with a significant challenge that will require cooperation of the whole racing industry.
change (offshore charges). While the benefits from some strategic initiatives have been
realised, the benefits from FOB are yet to be fully delivered and in addition the legislative     The NZRB strategy was an ambitious response to a wide range of internal issues and
change did not occur in the time period anticipated (as the proposed legislation was              rapidly changing market and customer expectations. The success of individual initiatives,
withdrawn). The NZRB’s decision to advance $12m in the FY18 and FY19 racing seasons               and the overall strategy, will be determined by the revenue generated by RITA and
has significantly impacted its financial position due to the increase in debt and decrease in     ultimately by the level of distributions to the Racing Codes.
equity.
                                                                                                  The core revenue generating strategic initiative, the FOB platform, has been operational for
During the review period the NZRB has also had to develop and implement systems and               six months and while the 2019 profit performance has been significantly below budget,
processes to comply with three significant regulatory and compliance obligations in; (a)          comparison to RITA’s Australian competitors indicate the issues driving margin
Health & Safety, (b) Payment Card Industry Data Security Standard (PCI-DSS) and (c)               compression, and therefore financial performance, were shared.
Anti-Money Laundering. The investment of close to $8 million was significant.
                                                                                                  We are aware that, across the spectrum of internal and external stakeholders, NZRB’s
Throughout the period the NZRB has kept the NZ racing industry informed of their                  operational and financial performance is viewed as alternatively proving the strategy to be
strategies, projects and performance through reporting in the NZRB Annual Reports and             well planned and executed or proving the strategy was high risk and poorly executed.
Statements of Intent (SOI), as well as regular industry briefings from the CEO. However,          While we acknowledge the legitimacy of elements of both perspectives, we believe six
based on our industry interviews, it is apparent that at least some in the industry do not feel   months results are insufficient to support either viewpoint.
that communication has been adequate.

© 2019 Grant Thornton New Zealand Ltd | RITA Performance and Efficiency Report | September 2019                                                                                                 9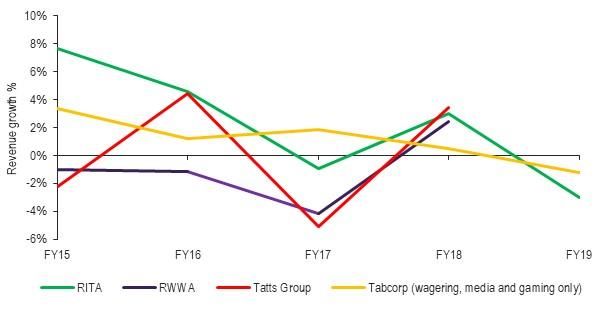
Executive summary

Summary of recommendations

Recommendations                                                                                   Betting Information Use Charge
Statutory Objectives and Functions                                                                •   We understand the revenue from the Betting Information Use Change will start to flow
                                                                                                      during the FY20 racing season and the distribution of this new revenue stream will be
•   All business cases for strategic initiatives should contain a section on strategic
                                                                                                      subject to a future decision of the RITA Board. Consideration should be given to RITA
    alignment that clearly links the initiative to the statutory objectives and functions.
                                                                                                      retaining this revenue to support their financial performance, and Code distributions,
•   Principal risks should be linked directly to the statutory objectives and functions.              during RITA's transition period.

Policy Framework
•   We recommend the Policies which are overdue are reviewed and updated to reflect the
    current needs of RITA.

Cost Saving opportunities
•   RITA should continue to pursue cost savings initiatives such as the Finance Function
    Transformation project, and RITA should consider utilising a similar approach to other
    core operational functions to improve efficiency, effectiveness and realise cost savings
    where possible. RITA should also complete Wave 2 of the Value Initiative and consider
    whether those suppliers excluded from Waves 1 and 2 could be included as Wave 3 of
    the Value Initiative.

•   We note that RITA is currently in consultation with the Codes, to consider which racing
    functions should be devolved from RITA to the Codes and where opportunities exist for
    charging market rates for services and facilities provided. We note that while there is
    an estimated saving of approximately $900k to RITA, however, there is no sector
    benefit as the costs of these services would have to be met by the Codes.

•   We note that RITA will continue to work with the DIA and the Minister on the Racing
    Reform Bill No.2 to broaden the range of betting products and bet types that RITA can
    offer to their customers so they are internationally competitive and to establish a level
    playing field around their class four gaming operation.

Outsourcing/JV opportunities
•   We note that RITA will continue to investigate all options in regard to possible
    outsourcing and JV opportunities as noted in the Messara report.

© 2019 Grant Thornton New Zealand Ltd | RITA Performance and Efficiency Report | September 2019                                                                                                10
Part A NZRB Strategy Section 2: 01. Executive summary 02. NZRB Strategy 03. Financial Analysis © 2019 Grant Thornton New Zealand Ltd | RITA Performance and Efficiency Report | September 2019
NZRB Strategy

Recent Historical Context

The perilous state of the NZ racing industry has been well canvased in statements by the                Item                                      2015        2016         2017        2018        2019
Minister for Racing, the Messara Report and a wide range of industry commentators.                                                                                                             Unaudited
While the reasons for the current state of the racing industry are beyond the scope of this
                                                                                                        Racing Turnover ($m)                     1,668        1,715       1,665       1,654       1,651
report, we do note that the trends discussed below were evident in the prior review period
and this situation is consistent with the challenges faced internationally by other gambling            Sports Turnover ($m)                       405         555          579         609         634
operators.                                                                                              Betting Turnover ($m)                    2,073        2,270       2,244       2,263       2,285

In the period 2015 to 2019 a number of the international trends, which had been previously              Gaming Turnover ($m)                       317         403          437         476         513
identified, crystallised for the NZ racing industry. As can be seen from the following table            Total Turnover ($m)                      2,390        2,673       2,681       2,738       2,798
total NZ racing was static with a slight increase of approximately 0.9%, with the 6.3%
                                                                                                        Net Betting Margin                      12.9%        12.4%       12.4%       12.7%       12.0%
increase in Greyhound racing offsetting the 9.3% fall in Thoroughbred racing and the 7%
fall in Harness racing.                                                                                 Total revenue                            331.5        349.9       348.1       354.9       336.1
                                                                                                        Turnover Related Expenses                (64.6)      (66.4)       (66.4)      (65.5)      (65.3)
 Item                               2015          2016          2017           2018          2019
                                                                                           Unaudited    Operating Expenses                      (127.8)     (138.8)      (133.7)     (134.5)     (126.5)
                                    2,848         2,790         2,564         2,568          2,582      Operating Profit                         139.1        144.7       148.0       154.9       144.4
 Thoroughbred Races
                                    2,654         2,595         2,492         2,483          2,469      Net strategic initiatives, one off          4.9         2.0        (4.0)       (9.0)       (7.4)
 Harness Races
                                                                                                        items and other costs
                                    5,553         5,573         5,624         5,903          5,907      Net Profit                               144.0        146.7       144.0       145.9       137.0
 Greyhound Races
                                   10,855        10,958        10,680         10,954        10,958      Distribution to Codes ($m)               134.2        136.7       136.2       136.2       137.0
 Total Domestic Racing
                                                                                                        Additional Funding ($m)                       -           -            -       12.0        12.0
                                   65,612        67,165        69,083         73,169        88,340
 Imported Racing                                                                                        TRPL payments ($m)                            -           -           -         2.6          2.6
                                   10,133        10,612        10,300         10,515        10,582      Total Distribution ($m)                  134.2        136.7       136.2       150.8       151.6
 Exported Racing
                                                                                                        Strategic Initiative Investment ($m)          -         2.3         8.2        45.4        45.9

As can also been seen, the amount of imported racing bet on in NZ increased by 34.6%                    NZRB Bank Debt ($m)                           -           -            -       10.0        35.0
while export racing grew by 4.4%. The growth in international races appears to be the                   NZRB Equity ($m)                          70.8         73.8        69.3        53.5        23.4
primary driver in racing turnover growing by 13% in the period against a backdrop of flat to
falling domestic racing. The growth in total turnover is primarily due to the growth in
overseas racing, sports betting and gaming turnover (an increase of 61.8%).                            Turnover related expenses have increased by 5.0% over the period compared to an
                                                                                                       increase in total turnover of 17%. Operating expenses have fallen by 1% over period. Total
Sports betting has increased significantly, with sport betting turnover increasing by $229m            operating expenses (including strategic initiatives) increased to $142.2m an increase of
or 57% driven by customer engagement and acquisition campaigns. All sports betting is                  11.3% over the period.
fixed odds betting, which has a lower margin than race betting. Sports betting margin are
also volatile due to margin impact of on-field results.                                                Operating profit (normalised) has increased by 3.8% over the period.
                                                                                                       Net profit (post strategic initiatives) has fallen by 4.9% over the period.
© 2019 Grant Thornton New Zealand Ltd | RITA Performance and Efficiency Report | September 2019                                                                                                      12
Recent Historical Content (continued)
Total betting turnover has increased over the period by 10.2% with the growth in sports
betting offsetting the decline in race betting, the change in betting mix has reduced margins
by 0.9% to 12.0%.
Item 2015 2016 2017 2018 2019
Unaudited
Totalisator Betting % 58 48 45 42 40
Fixed Odds Betting % 42 52 55 58 60
The decrease in margin over the period can largely be explained by the change in product
mix described above, being the growth in fixed odds betting and the decline of totalisator
betting. As noted earlier in this report, this is consistent with international trends and
changing customer preferences.
Distributions to the Codes have increased by 13% over the period. Without the decision to
distribute the $12m additional funding and $2.6m TRLP funding, the distributions would
have increased by 2.1% over the period.
During the period NZRB have spent over $90m (opex and capex) on the strategic initiatives
primarily the FOB platform, Vision Capture and Customer and Channels initiatives, all of
which are consistent with the NZRB strategy, as well as AML which is a legislative
obligation that came into effect 1 August 2019. NZRB also spent $10.7m on five year
enterprise IT licensing in the period.
The quantum of these investments and the decision to hold distributions has driven the
decrease in NZRB equity and the increase in debt over the period with equity reducing
from $71m to $23m.
© 2019 Grant Thornton New Zealand Ltd | RITA Performance and Efficiency Report | September 2019 13NZRB Strategy
Recent Historical Context (continued)
It is important to note that during this period the NZRB undertook significant investment in virtually all areas of its business to overcome years of under-investment in key systems and
processes. In the review period the NZRB has invested over $90m in their vision capture project, the new FOB platform, customer management and retail network refresh, effectively
modernising key aspects of their interaction with its customers. As importantly, RITA has implemented the systems and processes required to monitor and manage the business going
forward, including continued improvements in the delivery of the core betting and gaming products to its customers alongside investment in new technologies and betting and gaming
products to drive customer engagement and generate revenue growth for the racing industry and sporting organisations.
During the period the racing industry, and the NZRB have been impacted by the implementation of three significant compliance obligations, namely the Health & Safety Act 2015 (H&S),
the Anti-Money Laundering and Countering Financing of Terrorism Act 2009 (AML) and the Payment Card Industry Data Security Standard (PCI-DSS). Each of these obligations have
required significant investment by the NZRB to establish and maintain compliance.
Action Requirements Actual spend
(to 31 July 2019)
H&S To become compliant with H&S Act requirements a strategic plan was developed. The strategic plan adopted in 2016/17 was Capex $62k
focussed on those areas where analysis of incidents, accidents, and external data identified that there was high personal safety and Opex $1.5m
business impact risk and consequence. Two key areas that have improved performance significantly are working at heights related to
on-course towers and driver behaviour including damage to third party property.
PCI To become compliant with the PCI requirements NZRB has had to invest in ensuring the security of the credit card details held within Capex $201k
their systems. Opex $1.6m
AML To become compliant with the AML requirements significant change was required to systems, processes and staff training. The Capex $4.3 m
requirements are focused on knowing your customer, understanding their sources of financing and monitoring and reporting suspicious Opex $2.1 m
transactions.
The programme was 95% complete at go live date on 1 August 2019. The 5% that was not complete was due to technology partner
SGD being unable to deliver the ‘New Join Journey’ solution, we understand this has now been delivered. This delay required
technical dependencies to be removed to enable other functionality to be deployed by 1 August 2019.
All relevant RITA staff are provided internal training on H&S, AML and PCI-DSS to ensure they understand these regulations and assist RITA in meeting its compliance obligations.
© 2019 Grant Thornton New Zealand Ltd | RITA Performance and Efficiency Report | September 2019 14NZRB Strategy
Recent Historical Context (continued)
Investment in Capability NZ Gambling Market
Over the period the NZRB has invested heavily in its key strategic initiatives, mainly in The NZ gambling market continued to grow over the period, but the changing mix of betting
technology to lift its capability. In the process, the NZRB has delivered one of its biggest products reflects changing customer preferences.
ever technological upgrades in the form of a new FOB platform. The FOB platform has
increased the number of betting products available to punters, 2019 sports betting turnover Apart from a few exceptions such as high profile race days, long term trends show that
increased by 16% since the FOB go-live in January 2019. betting on New Zealand racing has become less popular than in the past.
NZRB has also invested in the Customers and Channels Programme, which included a In contrast, sports is more popular. Over the last five years there has been a rapid rise in
variety of initiatives to optimise the retail network, improve the customer experience within sports betting in the NZ gambling market driven by the growth in mobile and digital
the network and improve the customer’s digital experience through the website or app as platforms.
well as managing the Elite customers.
There has also been substantial growth in all forms of on-line gambling which is resulting in
The NZRB has also been investing in the Vision Capture Project, which changes how the significant revenue leakage to offshore gambling operators thereby directly impacting on
footage from the race tracks is captured using high definition (HD) technology. This project the revenue available to the New Zealand racing industry and sporting organisations.
is nearing completion. Greyhound racing has been moved to a centralised production
Recently enacted AML/CFT regulations required the industry to take stricter measures to
model with a purpose-built fixed control room for greyhound racing.
detect, deter and report on any potential money laundering activity, which has the potential
The NZRB also has entered into a non-exclusive agreement with SKY TV (NZ) in 2018 to impact on the legitimate customer betting experience.
which allows racing customers to be served by Trackside 1 and 2 and providing the NZRB
Customers appear to prefer the certainty of fixed odds betting and there is a greater
and the Codes with greater control over the content and the ability to present racing to
emphasis on overseas race meetings due to the volume of domestic racing being flat. The
customers on new digital platforms.
impact of this is that turnover on “imported” or offshore racing now exceeds turnover on
Other than investments in the key strategic initiatives, the NZRB maintained a strict New Zealand racing. Tote betting remains important but in decline within New Zealand,
approach to cost management. Excluding strategic initiatives and turnover related which is consistent with international trends
expenses, operating expenses have reduced over the last 5 years from $127.8 million in
Despite the growth of sports betting, the broader New Zealand gambling market remains
FY15 to $126.5 million in FY19 (unaudited).
dominated by gaming machines (by revenue) followed by casinos and Lotto. The overall
In the past year the organisation has embarked on a significant change to its operating rate of gambling in New Zealand has been relatively static on a per capita spend basis, the
model, shifting to an agile operating model, including training for all relevant staff. overall gambling rate is low when compared internationally. RITA management consider
the significant growth in offshore betting being indicative of strong latent demand.
The cost transformation programme including initiatives such as the Finance Function
Transformation, is designed to allow the Finance Function to ready itself for the new agile
operating model. This project has process improvement, reengineering and automation as
explicit goals.
© 2019 Grant Thornton New Zealand Ltd | RITA Performance and Efficiency Report | September 2019 15NZRB Strategy
NZRB Strategy
Strategic Context Strategic Shift
From our research it is apparent the domestic and international racing industry is facing In the 2015 Annual Report the NZRB asked the questions:
serious challenges. According to the MarketWatch 2015 Industry Forecast, North America
has faced a 28 percent decline in gambling on horse racing over a 10 year period 2003- • What does a sustainable industry look like?
2013. • What do we need to do to get there?
We have outlined in the following pages a number of the key challenges the international These are still the key questions facing both RITA and the racing industry, and while the
and domestic gambling markets have been experiencing, and NZRB’s response to these strategy implemented over the review period has created many of the foundations NZRB
challenges and the potential impact upon their business and the New Zealand racing believed necessary for a sustainable industry, the success or otherwise of these initiatives
industry. It is noted that the major trends we discuss are long term trends which have been will determine whether this question has been answered.
impacting the New Zealand gambling market for some time.
The NZRB had previously determined that to achieve the growth in profitability required to
In the DIA’s 2014 Briefing to the Incoming Minister for Racing it was stated there had been sustain the industry, it must focus on substantially increasing the number of customers
a range of indicators that showed the racing industry had been in decline for some time. betting and improve the competitiveness of offerings through growth in products and
In response to the significant challenges facing the industry in 2015, the new Chief improvements to customer experience given the shift in customer demographics. The
Executive and leadership team developed a strategy to modernise the NZRB’s technology, main driver seems to have shifted over 5 years from increasing the spending from existing
product offerings and customer service. A review of the strategy undertaken in 2016, customers to increasing and broadening the customer base. 5
identified that without a change in strategy, revenue was expected to decline by 1.5% To achieve the levels of increase in customer numbers NZRB has deliberately undertaken
CAGR and distributions to the Codes were expected to decline by 4.4% CAGR. a strategic shift to become customer-led.6
Driving much of NZRB’s strategy is the belief that, “We have a responsibility to the racing The key strategies here are targeted customer acquisition and retention campaigns and
industry to return it to a state of economic sustainability from which it can grow and online activities underpinned by a more agile and responsive operating model. This
prosper.” 4 strategy is critically dependent on two key initiatives, the FOB platform and the Customer
and Channels strategy.
The strategy included a legislative agenda to promote the introduction of legislation
enabling offshore charges (betting information use charge and point of consumption
charge) to reduce the impact of offshore competition on the domestic racing industry.
The success or otherwise of these strategies is also heavily dependent on what is
happening in the market and how RITA identifies and responds to market changes.
3. Source – June 2019 – Industry Update from John Allen
4. Source – Annual Report 2016
5. Source – 2014 Performance and Efficiency Audit
6. Source – NZRB SOI 2019 - 2021
© 2019 Grant Thornton New Zealand Ltd | RITA Performance and Efficiency Report | September 2019 16NZRB Strategy
NZRB Strategy (continued)
Long Term Issues and Trends - Move to Digital and Online Gambling How has the NZRB responded to digital platform and online gambling trends?
The disruptive influence of the internet has required the NZRB to change its business
Analysis of international trends shows the growth in digital platforms including offshore
model to adapt to the opportunities and challenges it presents. However, this was not
betting and gambling. According to Global Online Gambling and Betting Market Report the
an overnight fix for the NZRB. As previously stated, they faced a legacy of long term
online betting and gambling market will exhibit a compound annual growth rate (CAGR) of
fundamental issues which required significant investment.
11.4% over a forecasted period until 2024.
Given the growth of digital gambling and the emergence of offshore operators actively
Online gambling is seeing a boom worldwide with the growth of online casinos, augmented
seeking NZ customers, the NZRB concluded that doing nothing would result in an on-
reality and virtual reality, cryptocurrency, mobile friendly apps, and improved security.
going decline in betting revenue and profits. The resulting strategy included the
Some commentators have termed this as the “online gambling gold rush”.
following major elements:
This is backed up by studies that show that the global online gaming market topped 45 • Addressed the risk of a decade of underfunding its technology infrastructure by
billion USD in 2017 and continues to grow at a rapid rate. moving to more flexible, resilient and scalable technology platforms through the
This market is predicted to grow significantly doubling in size over the next 7-8 years. Optimus Strategic Initiative;
Size of online gambling market 2017 and 2024 (in USD Billions) • Introduced a new fixed odds betting platform to provide higher quality and
competitive betting products through the FOB Strategic Initiative;
• Introduced a modern website, redesigned TAB mobile app, and improved digital
channels through the Customer and Channels Strategic Initiative;
• Legislative frameworks agenda (offshore charges) to address offshore betting
competition; and
• Leveraging strategic partnerships and content distribution through the NZRB media
strategy
Source: Statista
© 2019 Grant Thornton New Zealand Ltd | RITA Performance and Efficiency Report | September 2019 17NZRB Strategy
NZRB Strategy (continued)
Digital Channel Percentage of Betting Turnover Long Term Issues and Trends - Change in Customer Demographics
Item 2015 2016 2017 2018 2019 Millennials and Gambling (those born between 1980 and late 1990s)
Unaudited
Research identifies that over 40% of those participating in online gambling are millennials
Digital share of total 43% 52% 55.9% 58% 60% between the ages of 21 and 34. It is this group that spends the most time of any
betting turnover generation online gambling (sources: Rymax and Gambling.net).
Source: NZRB Annual Reports Traditionally, horse racing has attracted an older demographic. This is backed by various
research that shows, for example, that only the PGA tour championship has a median age
of television viewers older than those watching horse racing - both are in their sixties.
Added to the move to digital channels, the NZRB attempted to get the Betting Information
User Charge and Point of Consumption (Offshore charges) legislation enacted. This was Since millennials represent the largest percentage of the population and if the TAB
seen by many as a key driver to turning around the fortunes of the industry by recouping customer base is to be sustained then obtaining and growing the number of millennials is a
some of the revenue lost to offshore betting operators and protecting the domestic racing major strategic opportunity for the TAB.
industry’s intellectual property. In 2018 the draft legislation was withdrawn as the Minister
believed, “The Bill wasn't fit for type.” Note: Millennials (or Gen Y) are usually regarded as those born from early 1980s to 2000
or as someone who came of age in the new millennium.
It’s successor, the Racing Reform Bill No.1 came into force on 1 July 2019. The Act
included provisions for collecting revenue from offshore betting operators that provide
betting services to persons residing in New Zealand and taking bets on New Zealand
sports and racing events.
© 2019 Grant Thornton New Zealand Ltd | RITA Performance and Efficiency Report | September 2019 18NZRB Strategy
NZRB Strategy (continued)
How has NZRB responded to customer growth to include millennials? While millennials are adequately represented as part of the new customer base they are
more focused on sports betting and when they do bet on racing the dollar amount is low.
NZRB has done its own research on account customers by age and betting
The NZRB has a number of relevant customer strategies in place aimed at acquiring new
preferences.
customers, retaining first time bettors and moving customers to more profitable gambling
products. For example, the 2018 Lions Tour campaign resulted in approximately 17,000
first time bettors, of which 53% went on to place bets on racing by October 2018.
Source: NZRB
Individuals aged 18-34 years in age account for 32% of New Zealand's adult
population (source: NZ stats). 41% of TAB’s current base is aged between 18-34
while first time bettors represent 58% of the customers acquired. It is noted the
spend of younger bettors is not as high as older bettors.
© 2019 Grant Thornton New Zealand Ltd | RITA Performance and Efficiency Report | September 2019 19NZRB Strategy
NZRB Strategy (continued)
How has NZRB responded to the growth in gambling?
Long Term Issues and Trends – Growth in Gambling
NZRB’s strategy has been to increase customer numbers as a key strategy through
Trends since the 1990s show a gradual growth in gambling by New Zealanders of the Customer and Channels Strategic Initiative. This they have done successfully
around 20%. As illustrated below, gambling has been steadily increasing since as active customer numbers have continued to grow year on year, the growth in
2009. customer numbers is an offset to the reduction in amount bet per customer.
Discussions with management indicate they view the growth in offshore wagering
as indicative of strong latent demand.
Actual Customer Growth
Item 2015 2016 2017 2018 2019
Unaudited
Active Customers 154,000 165,287 180,797 192,200 230,000
Total
Source: NZRB Annual Reports
The dynamic facing RITA is that while customer numbers are growing, this growth is in
fixed odds betting and primarily sports betting. So while active customer numbers are
Betting and Gambling statistics collated by DIA over the last 5 years support the view
growing, margins are falling and bets are for a lower value.
that while overall expenditure has been increasing, per capita expenditure has been
fairly static and that the TAB continues to hold around 14% of the revenue (peaking at Active customer numbers took a temporary dip when the FOB platform was introduced
16%) from total domestic Gambling. in January 2019. The CEO recently stated (August 2019) that active customer numbers
are back where they were in December 2018 and that turnover on sport had grown
Inflation adjusted Betting and Gambling Statistics considerably.
By the time this report was written, sports betting was up more than 30% on the number
2015 2016 2017 2018
of sports bets being sold since the FOB platform went live. 7
TAB betting (millions) $338 $353 $344 $350
As stated above, RITA is actively marketing to retain existing and acquire new
TAB betting per capita $97 $98 $94 $93 customers and to broaden the product range.
All Gambling per capita (*) $622 $635 $648 $634
Source: DIA
(*) Excludes on-line overseas betting and gambling
7. Source – June 2019 – Industry update from John Allen
© 2019 Grant Thornton New Zealand Ltd | RITA Performance and Efficiency Report | September 2019 20NZRB Strategy
NZRB Strategy (continued)
Elite customers have an average age of 44. They are the smallest segment but also
have the highest spend and frequency, betting 15 times a month on average, especially
on sports betting. Around 95% of their betting is through digital channels.
The introduction of the FOB platform has seen turnover growth of 9% for the Elite cohort
compared to a previous decline.
As part of their media strategy, the NZRB entered into a non-exclusive agreement with
SKY TV (NZ) in 2018 which allows racing customers to be served by Trackside 1 and 2
and providing the NZRB and the Codes with greater control over the content and the
ability to present racing to customers on new digital platforms.
Long Term Issues and Trends – Decline in Racing Tote Betting vs Sport
Betting and FOB
Internationally, tote betting has been declining over the last 20 years. This trend has
also been reflected in New Zealand. While betting on New Zealand racing has become
Source: NZRB less popular than in the past, betting on sports is more popular than ever. For example,
sports betting had increased from 9.5 to 24.4 percent of total betting between 2001 and
2016.
In contrast to customers numbers enjoying steady growth over the years, Elite
customer numbers had been falling since April 2018. However, the recent The fall of racing tote as a percentage of TAB total turnover supports this trend within
establishment of a new role as Head of Elite Customer Growth and the introduction New Zealand.
of the FOB platform seems to have arrested this trend.
Racing Tote Turnover
Elite customers are identified as having a turnover of more than $100k per season
and are very important to the TAB. These customers are managed by 8 Elite Item 2015 2016 2017 2018 2019
Customer Service Managers. Unaudited
Elite customers make up around 1% of the total customer base but represent over Racing tote as % 65% 58% 48% 45% 42%
30% of turnover and 23% of revenue. Changes in behaviour of Elite customers can of total turnover
affect revenue by millions of dollars, the reduction in Elites was said to have a
revenue impact of $4.1m in FY19 (unaudited). Source: NZRB Annual Reports – 2019 Unaudited
© 2019 Grant Thornton New Zealand Ltd | RITA Performance and Efficiency Report | September 2019 21NZRB Strategy
NZRB Strategy (continued)
How has NZRB responded to the decline in racing tote betting vs Australian Gross Win Margin on Total Gambling Turnover
sports and fixed odds betting?
In response to the shifting needs and expectations of customers the NZRB has
continued to focus on digital platforms, new sports products, fixed odds betting, and
closer customer monitoring and management through ‘generosity’. This response
is consistent with the response from NZRB’s offshore competitors.
As a result, sports activity continues to show significant growth especially since the
introduction of the FOB platform which provided customers a greater number of
options to bet on. Added to this, there were approximately 4 times the number of
sporting events available to TAB customers this year. Features like in-play betting
(betting takes places after the event has started) and cash-out (allows bettors to
secure their profits or minimise their losses before the sports event has finished)
have proved very popular.
Long Term Issues and Trends – Reducing Margins How has NZRB responded to the decline in margins?
Volatility in margin is especially prevalent in sports betting. Globally, betting on Against the backdrop of customer numbers increasing year on year, TAB margins have
sports has seen an array of competitive products introduced with better odds and fallen over the last 10 years due to shift in product mix.
added extras (such as free bets) to attract customers visitations and acquisition, all
of which tend to compress margins.
2015 2016 2017 2018 2019
Sports are also subject to specific event risks where the favourite loses. Examples Unaudited
from 2018/19 include the Ruiz fight, Tiger Woods winning the US Masters and the
Net Betting Profit Margin 12.9% 12.4% 12.4% 12.7% 12.0%
NBA finals. Such outcomes can result in low margins or a loss for the bookmaker.
Source: Annual Reports – 2019 Unaudited
The Australian betting operators have experienced a similar trend with margin
compression over the years and 2018/19 in particular. Given the customers move away from the higher margin tote betting to the lower margin
fixed odds betting, the NZRB strategy has been to grow overall customer numbers to grow
total gambling turnover, and move customers to more profitable gambling products to
protect the margin.
© 2019 Grant Thornton New Zealand Ltd | RITA Performance and Efficiency Report | September 2019 22NZRB Strategy (continued) As the following graph shows, racing totalisator margin has remained relatively constant over the period, while racing FOB margin has increased and sports FOB margin has been more volatile with a marked decrease from 2018 to 2019. © 2019 Grant Thornton New Zealand Ltd | RITA Performance and Efficiency Report | September 2019 23
NZRB Strategy

NZRB Strategy (continued)

NZRB’s Strategic alignment with Statutory Objectives and Functions                                We recommend that consideration is given to explicitly linking the principle risks identified
                                                                                                  as part of the risk process to the statutory objectives and functions.
The Statement of Intent (SOI) sets out the medium-term intentions and undertakings of the
NZRB which include its strategic plans. We note the current draft SOI is for one year only,       Furthermore, we recommend that consideration is also given to requiring all business
this is consistent with the RITA Board’s term.                                                    cases for strategic initiatives contain a section on the alignment of the initiative to the
                                                                                                  statutory objectives and functions.
The NZRB Board approved the strategies and the Codes are consulted by virtue of their
representation on the NZRB Board. We note the RITA Board composition has changed
from the makeup of the previous NZRB Board and there is no longer explicit Code                   The Key Strategic Initiatives
representation. Strategic matters were discussed as part of the CRIG (Combined Racing
                                                                                                  There were 8 strategic initiatives over the past 5 years. These were:
Industry Group) and CEO Forum process. NZRB also formed special working groups and
facilitated workshops with the Codes when strategic matters needed to be discussed.               1.   Optimus;
                                                                                                  2.   Fixed Odds Betting (FOB) Platform;
Post Board approval, the SOI is presented to the Minister for approval and subsequently to
the House of Representatives.                                                                     3.   Customer and Channels (C&C) Strategy;

We looked at how aligned the NZRB strategy and associated strategic initiatives were to its       4.   Offshore Betting;
statutory objectives and functions. We also examined whether the NZRB was reviewing its           5.   Future Venue Plan;
performance against its statutory requirements.                                                   6.   Vision Capture;
From a governance perspective, the previous audit in 2014 commented that that there was           7.   AML; and
no standing agenda mechanisms for the Board to review its statutory functions. On
                                                                                                  8.   Optimise the Calendar (OTC).
examination of the example Board agenda this situation seems to be unchanged.
The role of GM Strategy and Transformation was disestablished in 2015. Strategy is seen
as a joint responsibility across the entire executive leadership team. Strategy as a function
was structured under the Services Division supported by a Head of Strategy, a tier 3 role
and was subsequently disestablished in 2018.
From an operations and programme perspective, we would expect to see the imperatives
for each strategic initiative to be traceable to the statutory objectives and/or functions.
From a risk perspective, we found that a suitable framework existed and is being utilised,
however, the principle risks are not explicitly linked to the statutory objectives and
functions. By linking its principle risks to its statutory objectives and functions RITA may
gain further insight into the priority of their risks and proposed risk treatments.

© 2019 Grant Thornton New Zealand Ltd | RITA Performance and Efficiency Report | September 2019                                                                                                   24
You can also read