The Evolving Role of the Enterprise Data Warehouse in the Era of Big Data Analytics - A Kimball Group White Paper By Ralph Kimball
←
→
Page content transcription
If your browser does not render page correctly, please read the page content below
The Evolving Role of the
Enterprise Data Warehouse in
the Era of Big Data Analytics

A Kimball Group White Paper
By Ralph Kimball
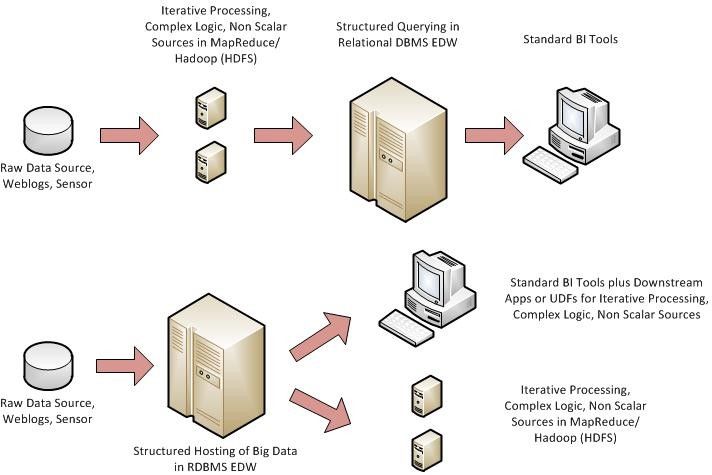
Table of Contents
  Executive Summary ...................................................................................................... 1
  About the Author ........................................................................................................... 1
  Introduction .................................................................................................................. 2
     Data is an asset on the balance sheet ..................................................................... 3
  Raising the curtain on big data analytics ..................................................................... 4
     Use cases for big data analytics ............................................................................... 4
     Making sense of big data analytic use cases ........................................................... 7
  Big data analytics system requirements ...................................................................... 9
     Extended relational database management systems ............................................ 10
     MapReduce/Hadoop systems ................................................................................ 13
     How MapReduce works in Hadoop ........................................................................ 14
     Tools for the Hadoop environment ......................................................................... 16
     Feature convergence in the coming decade .......................................................... 18
     Reusable analytics ................................................................................................. 20
     Complex event processing (CEP) .......................................................................... 20
  Data warehouse cultural changes in the coming decade .......................................... 21
     Sandboxes .............................................................................................................. 21
     Low latency ............................................................................................................. 22
     Continuous thirst for more exquisite detail ............................................................. 22
     Light touch data waits for its relevance to be exposed ........................................... 23
     Simple analysis of all the data trumps sophisticated analysis of some of the data . 23
     Data structures should be declared at query time, not at data load time ............... 24
     The EDW supporting big data analytics must be magnetic, agile, and deep ......... 24
     The conflict between abstraction and control ......................................................... 24
  Data warehouse organization changes in the coming decade ................................... 25
     Technical skill sets required .................................................................................. 25
     New organizations required .................................................................................... 26
     New development paradigms required ................................................................... 27
     Lessons from the early data warehousing era ....................................................... 28
     Analytics in the cloud .............................................................................................. 29
     Whither EDW? ......................................................................................................... 29
  Acknowledgements .................................................................................................... 31
  References ................................................................................................................. 31

                                   The Evolving Role of the Enterprise Data Warehouse in the Era of Big Data Analytics
Executive Summary
In this white paper, we describe the rapidly evolving landscape for designing an
enterprise data warehouse (EDW) to support business analytics in the era of "big
data.” We describe the scope and challenges of building and evolving a very stable
and successful EDW architecture to meet new business requirements. These
include extreme integration, semi- and un-structured data sources, petabytes of
behavioral and image data accessed through MapReduce/Hadoop as well as
massively parallel relational databases, and then structuring the EDW to support
advanced analytics. This paper provides detailed guidance for designing and
administering the necessary processes for deployment. This white paper has been
written in response to a lack of specific guidance in the industry as to how the EDW
needs to respond to the big data analytics challenge, and what necessary design
elements are needed to support these new requirements.

About the Author
Ralph Kimball founded the Kimball Group. Since the mid 1980s, he has been the data
warehouse/business intelligence (DW/BI) industry’s thought leader on the
dimensional approach and trained more than 10,000 IT professionals. Prior to working
at Metaphor and founding Red Brick Systems, Ralph co-invented the Star workstation
at Xerox’s Palo Alto Research Center (PARC). Ralph has his Ph.D. in Electrical
Engineering from Stanford University.

The Kimball Group is the source for dimensional DW/BI consulting and education,
consistent with our best-selling Toolkit book series, Design Tips, and award-winning
articles. Visit www.kimballgroup.com for more information.

                     The Evolving Role of the Enterprise Data Warehouse in the Era of Big Data Analytics 1
Introduction
What is big data? Its bigness is actually not the most interesting characteristic. Big
data is structured, semi structured, unstructured, and raw data in many different
formats, in some cases looking totally different than the clean scalar numbers and text
we have stored in our data warehouses for the last 30 years. Much big data cannot be
analyzed with anything that looks like SQL. But most important, big data is a
paradigm shift in how we think about data assets, where do we collect them, how do
we analyze them, and how do we monetize the insights from the analysis. The big
data revolution is about finding new value within and outside conventional data
sources. An additional approach is needed because the software and hardware
environments of the past have not been able to capture, manage, or process the new
forms of data within reasonable development times or processing times. We are
challenged to reorganize our information management landscape to extend a
remarkably stable and successful EDW architecture to this new era of big data
analytics.
In reading this white paper please bear in mind that the consistent view of this author
has always been that the "data warehouse" comprises the complete ecosystem for
extracting, cleaning, integrating and delivering data to decision makers, and therefore
includes the extract-transform-load (ETL) and business intelligence (BI) functions
considered as outside of the data warehouse by more conservative writers. This
author has always taken the view that data warehousing has a very comprehensive
role in capturing all forms of enterprise data, and then preparing that data for the most
effective use by decision-makers all across the enterprise. This white paper takes the
aggressive view that the enterprise data warehouse is on the verge of a very exciting
new set of responsibilities. The scope of the EDW will increase dramatically.
Also, in this white paper, although we consistently use the term “ETL” to describe the
movement of data within the enterprise data warehouse, the conventional use of this
term does not do justice to the much larger responsibility of moving data across
networks and between systems and between profoundly different processes in the
world of big data analytics. ETL is a portion of a much larger technology called data
integration (DI). Since we have used ETL consistently in our books and classes for
many years, we will keep that terminology in this paper, bearing in mind that ETL is
meant in the larger sense of DI.
This white paper stands back from the marketplace as it exists in early 2011 to
highlight the clearly emerging new trends brought by the big data revolution. And a
revolution it is. As James Markarian, Informatica's Executive Vice President and Chief
Technology Officer, remarked: "the database market has finally gotten interesting
again." Because much of the new big data tools and approaches are version 1 or
even version 0 developments, the landscape will continue to change rapidly. However
there is growing awareness in the marketplace that new kinds of analysis are possible
and that key competitors, especially e-commerce enterprises, are already taking
advantage of the new paradigm. This white paper is intended to be a guide to help
business intelligence, data warehousing and information management professionals
The Evolving Role of the Enterprise Data Warehouse in the Era of Big Data Analytics 2and management teams understand and prepare for big data as a complementary
extension to their current EDW architecture.
Data is an asset on the balance sheet
Enterprises increasingly recognize that data itself is an asset that should appear on
the balance sheet in the same way that traditional assets from the manufacturing age
such as equipment and land have always appeared. There are several ways to
determine the value of the data asset, including
cost to produce the data
cost to replace the data if it is lost
revenue or profit opportunity provided by the data
revenue or profit loss if data falls into competitors hands
legal exposure from fines and lawsuits if data is exposed to the wrong parties
But more important than the data itself, enterprises have shown that insights from
data can be monetized. When an e-commerce site detects an increase in favorable
click throughs from an experimental ad treatment, that insight can be taken to the
bottom line immediately. This direct cause-and-effect is easily understood by
management, and an analytic research group that consistently demonstrates these
insights is looked upon as a strategic resource for the enterprise by the highest levels
of management. This growth in business awareness of the value of data-driven
insights is rapidly spreading outward from the e-commerce world to virtually every
business segment.
Data warehousing, of course, has been demonstrating the value of data-driven
insights for at least 20 years. But until quite recently data warehousing has been
focused on historical transaction data. During the past decade from 2000 to 2009,
three major seismic shifts occurred in data warehousing. The first, early in the
decade, was the decisive introduction of low latency operational data into the data
warehouse together with the existing historical data. Of course, many of these new
operational data use cases benefited from real-time data, in some cases demanding
instantaneous delivery. The second seismic shift growing increasingly throughout the
decade was the gathering of customer behavior data, which not only included
traditional transactions such as purchases and click throughs but added huge
volumes of "sub transactions" that represented measurable events leading up to the
transactions themselves. For example, all the webpage events a customer engaged
in prior to the final transaction event became a record of customer behavior. "Good
paths" through these webpage event histories gave lots of insight into productive (i.e.,
monetizable) customer behavior.
The third seismic event, which is gathering enormous momentum as we transition into
the current decade, is the extraction of product preferences and customers’
sentiments from social media, especially the massive quantities of machine-
generated unstructured data generated by the new business paradigms of dot-com
companies. It is this final seismic shift that has pushed many enterprises into looking
seriously at unstructured data for the first time, and asking "how on earth do we
The Evolving Role of the Enterprise Data Warehouse in the Era of Big Data Analytics 3analyze this stuff?" The point here is not that unstructured data is some new thing
recently discovered, but rather the analysis of unstructured data has gone
mainstream just recently.
Raising the curtain on big data analytics
Use cases for big data analytics
Big data analytics use cases are spreading like wildfire. Here is a set of use cases
reported recently, including a benchmark set of "Hadoop-able" use cases proposed
by Jeff Hammerbacher, Chief Scientist for Cloudera. Following these brief
descriptions is a table summarizing the salient structure and processing
characteristics of each use case. Note that none of these use cases can be satisfied
with scalar numeric data, nor can any be properly analyzed by simple SQL
statements. All of them can be scaled into the petabyte range and beyond with
appropriate business assumptions.
Search ranking. All search engines attempt to rank the relevance of a webpage to a
search request against all other possible webpages. Google’s page rank algorithm is,
of course, the poster child for this use case.
Ad tracking. E-commerce sites typically record an enormous river of data including
every page event in every user session. This allows for very short turnaround of
experiments in ad placement, color, size, wording, and other features. When an
experiment shows that such a feature change in an ad results in improved click
through behavior, the change can be implemented virtually in real time.
Location and proximity tracking. Many use cases add precise GPS location tracking,
together with frequent updates, in operational applications, security analysis,
navigation, and social media. Precise location tracking opens the door for an
enormous ocean of data about other locations nearby the GPS measurement. These
other locations may represent opportunities for sales or services.
Causal factor discovery. Point-of-sale data has long been able to show us when the
sales of a product goes sharply up or down. But searching for the causal factors that
explain these deviations has been, at best, a guessing game or an art form. The
answers may be found in competitive pricing data, competitive promotional data
including print and television media, weather, holidays, national events including
disasters, and virally spread opinions found in social media. See the next use case as
well.
Social CRM. This use case is one of the hottest new areas for marketing analysis.
The Altimeter Group has described a very useful set of key performance indicators for
social CRM that include share of voice, audience engagement, conversation reach,
active advocates, advocate influence, advocacy impact, resolution rate, resolution
time, satisfaction score, topic trends, sentiment ratio, and idea impact. The calculation
of these KPIs involves in-depth trolling of a huge array of data sources, especially
unstructured social media.
The Evolving Role of the Enterprise Data Warehouse in the Era of Big Data Analytics 4Document similarity testing. Two documents can be compared to derive a metric of
similarity. There is a large body of academic research and tested algorithms, for
example latent semantic analysis, that is just now finding its way to driving monetized
insights of interest to big data practitioners. For example, a single source document
can be used as a kind of multifaceted template to compare against a large set of
target documents. This could be used for threat discovery, sentiment analysis, and
opinion polls. For example: "find all the documents that agree with my source
document on global warming."
Genomics analysis: e.g., commercial seed gene sequencing. A few months ago the
cotton research community was thrilled by a genome sequencing announcement that
stated in part "The sequence will serve a critical role as the reference for future
assembly of the larger cotton crop genome. Cotton is the most important fiber crop
worldwide and this sequence information will open the way for more rapid breeding
for higher yield, better fiber quality and adaptation to environmental stresses and for
insect and disease resistance.” Scientist Ryan Rapp stressed the importance of
involving the cotton research community in analyzing the sequence, identifying genes
and gene families and determining the future directions of research. (SeedQuest,
Sept 22, 2010). This use case is just one example of a whole industry that is being
formed to address genomics analysis broadly, beyond this example of seed gene
sequencing.
Discovery of customer cohort groups. Customer cohort groups are used by many
enterprises to identify common demographic trends and behavior histories. We are all
familiar with Amazon's cohort groups when they say other customers who bought the
same book as you have also bought the following books. Of course, if you can sell
your product or service to one member of a cohort group, then all the rest may be
reasonable prospects. Cohort groups are represented logically and graphically as
links, and much of the analysis of cohort groups involves specialized link analysis
algorithms.
In-flight aircraft status. This use case as well as the following two use cases are made
possible by the introduction of sensor technology everywhere. In the case of aircraft
systems, in-flight status of hundreds of variables on engines, fuel systems, hydraulics,
and electrical systems are measured and transmitted every few milliseconds. The
value of this use case is not just the engineering telemetry data that could be
analyzed at some future point in time, but drives real-time adaptive control, fuel
usage, part failure prediction, and pilot notification.
Smart utility meters. It didn't take long for utility companies to figure out that a smart
meter can be used for more than just the monthly readout that produces the
customer’s utility bill. By drastically cranking up the frequency of the readouts to as
much as one readout per second per meter across the entire customer landscape,
many useful analyses can be performed including dynamic load-balancing, failure
response, adaptive pricing, and longer-term strategies for incenting customers to
utilize the utility more effectively (either from the customers’ point of view or the
utility's point of view!)
The Evolving Role of the Enterprise Data Warehouse in the Era of Big Data Analytics 5Building sensors. Modern industrial buildings and high-rises are being fitted with
thousands of small sensors to detect temperature, humidity, vibration, and noise. Like
the smart utility meters, collecting this data every few seconds 24 hours per day
allows many forms of analysis including energy usage, unusual problems including
security violations, component failure in air-conditioning and heating systems and
plumbing systems, and the development of construction practices and pricing
strategies.
Satellite image comparison. Images of the regions of the earth from satellites are
captured by every pass of certain satellites on intervals typically separated by a small
number of days. Overlaying these images and computing the differences allows the
creation of hot spot maps showing what has changed. This analysis can identify
construction, destruction, changes due to disasters like hurricanes and earthquakes
and fires, and the spread of human encroachment.
CAT scan comparisons. CAT scans are stacks of images taken as "slices" of the
human body. Large libraries of CAT scans can be analyzed to facilitate the automatic
diagnosis of medical issues and their prevalence.
Financial account fraud detection and intervention. Account fraud, of course, has
immediate and obvious financial impact. In many cases fraud can be detected by
patterns of account behavior, in some cases crossing multiple financial systems. For
example, "check kiting" requires the rapid transfer of money back and forth between
two separate accounts. Certain forms of broker fraud involve two conspiring brokers
selling a security back-and-forth at ever increasing prices, until an unsuspecting third
party enters the action by buying the security, allowing the fraudulent brokers to
quickly exit. Again, this behavior may take place across two separate exchanges in a
short period of time.
Computer system hacking detection and intervention. System hacking in many cases
involves an unusual entry mode or some other kind of behavior that in retrospect is a
smoking gun but may be hard to detect in real-time.
Online game gesture tracking. Online game companies typically record every click
and maneuver by every player at the most fine grained level. This avalanche of
"telemetry data" allows fraud detection, intervention for a player who is getting
consistently defeated (and therefore discouraged), offers of additional features or
game goals for players who are about to finish a game and depart, ideas for new
game features, and experiments for new features in the games. This can be
generalized to television viewing. Your DVR box can capture remote control
keystrokes, recording events, playback events, picture-in-picture viewing, and the
context of the guide. All of this can be sent back to your provider.
Big science including atom smashers, weather analysis, space probe telemetry feeds.
Major scientific projects have always collected a lot of data, but now the techniques of
big data analytics are allowing broader access and much more timely access to the
data. Big science data, of course, is a mixture of all forms of data, scalar, vector,
complex structures, analog wave forms, and images.
The Evolving Role of the Enterprise Data Warehouse in the Era of Big Data Analytics 6"Data bag" exploration. There are many situations in commercial environments and in
the research communities where large volumes of raw data are collected. One
example might be data collected about structure fires. Beyond the predictable
dimensions of time, place, primary cause of fire, and responding firefighters, there
may be a wealth of unpredictable anecdotal data that at best can be modeled as a
disorderly collection of name value pairs, such as "contributing weather= lightning.”
Another example would be the listing of all relevant financial assets for a defendant in
a lawsuit. Again such a list is likely to be a disorderly collection of name value pairs,
such as "shared real estate ownership =condominium.” The list of examples like this
is endless. What they have in common is the need to encapsulate the disorderly
collection of name value pairs which is generally known as a "data bag.” Complex
data bags may contain both name value pairs as well as embedded sub data bags.
The challenge in this use case is to find a common way to approach the analysis of
data bags when the content of the data may need to be discovered after the data is
loaded.
The final two use cases are old and venerable examples that even predate data
warehousing itself. But new life has been breathed into these use cases because of
the exciting potential of ultra-atomic customer behavior data.
Loan risk analysis and insurance policy underwriting. In order to evaluate the risk of a
prospective loan or a prospective insurance policy, many data sources can be
brought into play ranging from payment histories, detailed credit behavior,
employment data, and financial asset disclosures. In some cases the collateral for a
loan or the insured item may be accompanied by image data.
Customer churn analysis. Enterprises concerned with churn want to understand the
predictive factors leading up to the loss of a customer, including that customer’s
detailed behavior as well as many external factors including the economy, life stage
and other demographics of the customer, and finally real time competitive issues.
Making sense of big data analytic use cases
Certainly the purpose of developing this list of use cases is to convince the reader
that the use cases come in all shapes and sizes and formats, and require many
specialized approaches to analyze. Up until very recently all these use cases existed
as separate endeavors, often involving special purpose built systems. But the industry
awareness of the "big data analytics challenge" is motivating everyone to look for the
architectural similarities and differences across all these use cases. Any given
enterprise is increasingly likely to encounter one or more of these use cases. That
realization is driving the interest in system architectures that addresses the big data
analytics problem in a general way. Please study the following table.
The Evolving Role of the Enterprise Data Warehouse in the Era of Big Data Analytics 7Image or binary data
complex branching
Access to all data
complex structure
Rapidly repeated
Vector, matrix, or
Iterative logic or
analytic routines
measurements
Data “bags”
low latency
Advanced
Free text
Extreme
required
Search ranking X X X X X X
Ad tracking X X X X X X X X
Location & proximity X X X X X
Causal discovery X X X X X X X
Social CRM X X X X X X X X
Document similarity X X X X X X X
Genomic analysis X X X X X
Cohort groups X X X X X X
In-flight engine status X X X X X X
Smart utility meters X X X X X X
Building sensors X X X X X X X X
Satellite images X X X X
CAT scans X X X X X X
Financial fraud X X X X X X X X X
Hacking detection X X X X X X X X X
Game gestures X X X X X X X X
Big science X X X X X X X X X
Data bag exploration X X X X X X
Risk analysis X X X X X X X X
Churn analysis X X X X X X X
The sheer density of this table makes it clear that systems to support big data
analytics have to look very different than the classic relational database systems from
the 1980s and 1990s. The original RDBMSs were not built to handle any of the
requirements represented as columns in this table!
The Evolving Role of the Enterprise Data Warehouse in the Era of Big Data Analytics 8Big data analytics system requirements
Before discussing the exciting new technical and architectural developments of the
2010s, let's summarize the overall requirements for supporting big data analytics,
keeping in mind that we are not requiring a single system or a single vendor's
technology to provide a blanket solution for every use case. From the perspective of
2011, we have the luxury of standing back from all these use cases gathered in the
last few years, and we are now in a position to surround the requirements with some
confidence.
The development of big data analytics has reached a point where it needs an overall
mission statement and identity independent of a list of use cases. Many of us have
lived through earlier instantiations of advanced analytics that went by the names of
advanced statistics, artificial intelligence and data mining. None of these earlier
waves became a coherent theme that transcended the individual examples, as
compelling as those examples were.
Here is an attempt to step back and define the characteristics of big data analytics at
the highest levels. In the following, the term "UDF" is used in the broadest sense of
any user defined function or program or algorithm that may appear anywhere in the
end-to-end analysis architecture.
In the coming 2010s decade, the analysis of big data will require a technology or
combination of technologies capable of:
scaling to easily support petabytes (thousands of terabytes) of data
being distributed across thousands of processors, potentially geographically
unaware, and potentially heterogeneous
subsecond response time for highly constrained standard SQL queries
embedding arbitrarily complex user-defined functions (UDFs) within
processing requests
implementing UDFs in a wide variety of industry-standard procedural
languages
assembling extensive libraries of reusable UDFs crossing most or all of use
cases
executing UDFs as "relation scans" over petabyte sized data sets in a few
minutes
supporting a wide variety of data types growing to include images, waveforms,
arbitrarily hierarchical data structures, and data bags
loading data to be ready for analysis, at very high rates, at least gigabytes per
second
integrating data from multiple sources during the load process at very high
rates (GB/sec)
loading data before declaring or discovering its structure
executing certain “streaming” analytic queries in real time on incoming load
data
The Evolving Role of the Enterprise Data Warehouse in the Era of Big Data Analytics 9 updating data in place at full load speeds
joining a billion row dimension table to a trillion row fact table without pre-
clustering the dimension table with the fact table
scheduling and execution of complex multi-hundred node workflows
being configured without being subject to a single point of failure
failover and process continuation when processing nodes fail
supporting extreme mixed workloads including thousands of geographically
dispersed on-line users and programs executing a variety of requests ranging
from ad hoc queries to strategic analysis, and while loading data in batch and
streaming fashion
Two architectures have emerged to address big data analytics: extended RDBMS,
and MapReduce/Hadoop. These architectures are being implemented as completely
separate systems and in various interesting hybrid combinations involving both
architectures. We will start by discussing the architectures separately.
Extended relational database management systems
All of the major relational database management system vendors are adding features
to address big data analytics from a solid relational perspective. The two most
significant architectural developments have been the overtaking of the high end of the
market with massively parallel processing (MPP), and the growing adoption of
columnar storage. When MPP and columnar storage techniques are combined, a
number of the system requirements in the above list can start to be addressed,
including:
scaling to support exabytes (thousands of petabytes) of data
being distributed across tens of thousands of geographically dispersed
processors
subsecond response time for highly constrained standard SQL queries
updating data in place at full load speeds
being configured without being subject to a single point of failure
failover and process continuation when processing nodes fail
Additionally, RDBMS vendors are adding some complex user-defined functions
(UDF's) to their syntax, but the kind of general purpose procedural language
computing required by big data analytics is not being satisfied in relational
environments at this time.
In a similar vein, RDBMS vendors are allowing complex data structures to be stored
in individual fields. These kind of embedded complex data structures have been
known as "blobs" for many years. It's important to understand that relational
databases have a hard time providing general support for interpreting blobs since
blobs do not fit the relational paradigm. An RDBMS indeed provides some value by
hosting the blobs in a structured framework, but much of the complex interpretation
and computation on the blobs must be done with specially crafted UDFs, or BI
The Evolving Role of the Enterprise Data Warehouse in the Era of Big Data Analytics 10application layer clients. Blobs are related to “data bags” discussed elsewhere in this
paper. See the section entitled Data structures should be declared at query time.
MPP implementations have never satisfactorily addressed the "big join” issue where a
billion row dimension table is attempted to be joined to a trillion row fact table without
resorting to clustered storage. The big join crisis occurs when an ad hoc constraint is
placed against the dimension table resulting in a potentially very large set of dimension
keys that must be physically downloaded into every one of the physical segments of
the trillion row fact table stored separately in the MPP system. Since the dimension
keys are scattered randomly across the separate segments of the trillion row fact table,
it is very hard to avoid a lengthy download step of the very large dimension table to
every one of the fact table storage partitions. To be fair, the MapReduce/Hadoop
architecture has not been able to address the big join problem either.
Columnar data storage fits the relational paradigm, and especially dimensionally
modeled databases, very well. Besides the significant advantage of high compression
of sparse data, columnar databases allow a very large number of columns compared
to row-oriented databases, and place little overhead on the system when columns are
added to an existing schema. The most significant Achilles' heel, at least in 2011, is
the slow loading speed of data into the columnar format. Although impressive load
speed improvements are being announced by columnar database vendors, they have
still not achieved the gigabytes-per-second requirement listed above.
The standard RDBMS architecture for implementing an enterprise data warehouse
based on dimensional modeling principles is simple and well understood, as shown in
Figure 1. Recall that throughout this white paper, the EDW is defined in the
comprehensive sense to include all back room and front room processes including
ETL, data presentation, and BI applications.
Figure 1. The standard RDBMS – based architecture for an enterprise data warehouse
Source: The Data Warehouse Lifecycle Toolkit, 2nd edition, Kimball et al. (2008)
The Evolving Role of the Enterprise Data Warehouse in the Era of Big Data Analytics 11In this standard EDW architecture the ETL system is a major component that sits
between the source systems and the presentation servers that are responsible for
exposing all data to business intelligence applications. In this view, the ETL system
adds significant value by cleaning, conforming, and arranging the data into a series of
dimensional schemas which are then stored physically in the presentation server. A
crucial element of this architecture is the preparation of conformed dimensions in the
ETL system that serves as the basis of integration for the BI applications. It is the
strong conviction of this author that deferring the building of the dimensional
structures and the issues of integration until query time is the wrong architecture.
Such a "deferred computation" approach requires an unduly expensive query
optimizer to correctly query complex non-dimensional models every time a query is
presented. The calculation of integration at query processing time generally requires
complex application logic in the BI tools which also might have to be executed for
every query.
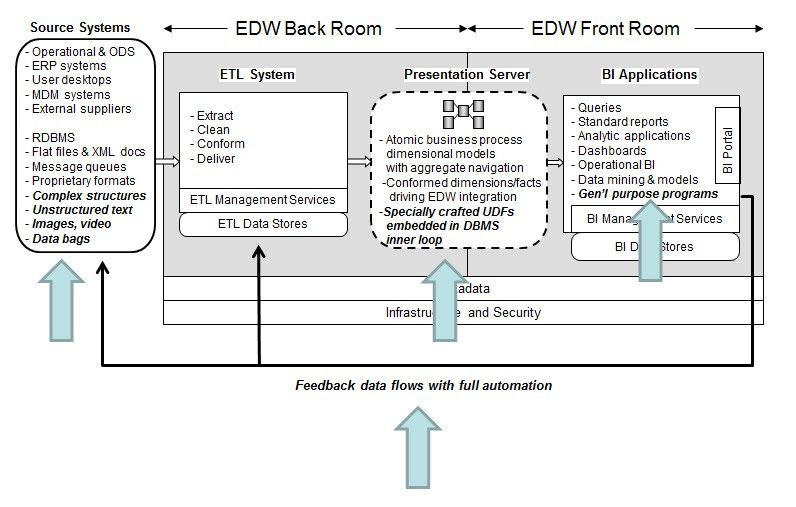
The extended RDBMS architecture to support big data analytics preserves the
standard architecture with a number of important additions, shown below in Figure 2
with large arrows:
Figure 2. The extended RDBMS – based architecture for an enterprise data warehouse
The fact that the high-level enterprise data warehouse architecture is not materially
changed by the introduction of new data structures, or a growing library of specially
crafted user-defined functions, or powerful procedural language-based programs
acting as powerful BI clients, is the charm of the extended RDBMS approach to big
data analytics. The major RDBMS players are able to marshal their enormous legacy
of millions of lines of code, powerful governance capabilities, and system stability built
over decades of serving the marketplace.
The Evolving Role of the Enterprise Data Warehouse in the Era of Big Data Analytics 12However, it is the opinion of this author that the extended RDBMS systems cannot be
the only solution for big data analytics. At some point, tacking on non-relational data
structures and non-relational processing algorithms to the basic, coherent RDBMS
architecture will become unwieldy and inefficient. The Swiss Army knife analogy
comes to mind. Another analogy closer to the topic is the programming language
PL/1. Originally designed as an overarching, multipurpose, powerful programming
language for all forms of data and all applications, it ultimately became a bloated and
sprawling corpus that tried to do too many things in a single language. Since the
heyday of PL/1 there has been a wonderful evolution of more narrowly focused
programming languages with many new concepts and features that simply couldn't be
tacked on to PL/1 after a certain point. Relational database management systems do
so many things so well that there is no danger of suffering the same fate as PL/1. The
big data analytics space is growing so rapidly and in such exciting and unexpected
new directions that a lighter weight, more flexible and more agile processing
framework in addition to RDBMS systems may be a reasonable alternative.
MapReduce/Hadoop systems
MapReduce is a processing framework originally developed by Google in the early
2000s for performing web page searches across thousands of physically separated
machines. The MapReduce approach is extremely general. Complete MapReduce
systems can be implemented in a variety of languages although the most significant
implementation is in Java. MapReduce is really a UDF (user defined function)
execution framework, where the "F" can be extraordinarily complex. Originally
targeted to building Google's webpage search index, a MapReduce job can be
defined for virtually any data structure and any application. The target processors that
actually perform the requested computation can be identical (a "cluster"), or can be a
heterogeneous mix of processor types (a "grid"). The data in each processor upon
which the ultimate computation is performed can be stored in a database, or more
commonly in a file system, and can be in any digital format.
The most significant implementation of MapReduce is Apache Hadoop, known simply
as Hadoop. Hadoop is an open source, top-level Apache project, with thousands of
contributors and a whole industry of diverse applications. Hadoop runs natively on its
own distributed file system (HDFS) and can also read and write to Amazon S3 and
others. Conventional database vendors are also implementing interfaces to allow
Hadoop jobs to be run over massively distributed instances of their databases.
As we will see when we give a brief overview of how a Hadoop job works, bandwidth
between the separate processors can be a huge issue. HDFS is a so-called "rack
aware" file system because the central name node knows which nodes reside on the
same rack and which are connected by more than one network hop. Hadoop exploits
the relationship between the central job dispatcher and HDFS to significantly optimize
a massively distributed processing task by having detailed knowledge of where data
actually resides. This also implies that a critical aspect of performance control is co-
locating segments of data on actual physical hardware racks so that the MapReduce
communication can be accomplished at backplane speeds rather than slower network
speeds. Note that remote cloud-based file systems such as Amazon S3 and
The Evolving Role of the Enterprise Data Warehouse in the Era of Big Data Analytics 13CloudStore are, by their nature, unable to provide the rack aware benefit. Of course,
cloud-based file systems have a number of compelling advantages which we'll
discuss later.
How MapReduce works in Hadoop
A MapReduce job is submitted to a centralized JobTracker, which in turn schedules
parts of the job to a number of TaskTracker nodes. Although, in general a
TaskTracker may fail and its task can be reassigned by the JobTracker, the
JobTracker is a single point of failure. If the JobTracker halts, the MapReduce job
must be restarted or be resumed from intermediate snapshots.
A MapReduce job is always divided into two distinct phases, map and reduce. The
overall input to a MapReduce job is divided into many equal sized splits, each of
which is assigned a map task. The map function is then applied to each record in
each split. For large jobs, the job tracker schedules these map tasks in parallel. The
overall performance of a MapReduce job depends significantly on achieving a
balance of enough parallel splits to keep many machines busy, but not so many
parallel splits that the interprocess communication of managing all the splits bogs
down the overall job. When MapReduce is run over the HDFS file system, a typical
default split size is 64 MB of input data.
As the name suggests, the map task is the first half of the MapReduce job. Each map
task produces a set of intermediate result records which are written to the local disk of
the machine performing the map task. The second half of the MapReduce job, the
reduce task, may run on any processing node. The outputs of the mappers (nodes
running map tasks) are sorted and partitioned in such a way that these outputs can be
transferred to the reducers (nodes running the reduce task). The final outputs of the
reducers comprise the sorted and partitioned results set of the overall MapReduce
job. In MapReduce running over HDFS, the results set is written to HDFS and is
replicated for reliability.
In Figure 3, we show this task flow for a MapReduce job with three mapper nodes
feeding two reducer nodes, by reproducing figure 2.3 from Tom White's book,
Hadoop, The Definitive Guide, 2nd Edition, (O'Reilly, 2010).
The Evolving Role of the Enterprise Data Warehouse in the Era of Big Data Analytics 14Figure 3. An example MapReduce job
In Tom White's book, a simple MapReduce job is described which we extend
somewhat here. Suppose that the original data before the splits are applied consists
of a very large number (perhaps billions) of unsorted temperature measurements, one
per record. Such measurements could come from many thousands of automatic
sensors located around the United States. The splits are assigned to the separate
mapper nodes to equalize as much as possible the number of records going to each
node. The actual form of the mapper inputs are key-value pairs, in this case a
sequential record identifier and the full record containing the temperature
measurements as well as other data. The job of each mapper is simply to parse the
records presented to it and extract the year, the state, and the temperature, which
becomes the second set of key-value pairs passed from the mapper to the reducer.
The job of each reducer is to find the maximum reported temperature for each state,
and each distinct year in the records passed to it. Each reducer is responsible for a
state, so in order to accomplish the transfer, the output of each mapper must be
sorted so that the key-value pairs can be dispatched to the appropriate reducers. In
this case there would be 50 reducers, one for each state. These sorted blocks are
then transferred to the reducers in a step which is a critical feature of the MapReduce
architecture, where it is called the "shuffle.”
Notice that the shuffle involves a true physical transfer of data between processing
nodes. This makes the value of the rack aware feature more obvious, since a lot of
data needs to be moved from the mappers to the reducers. The clever reader may
wonder if this data transfer could be reduced by having the mapper outputs combined
so that many readings from a single state and year are given to the reducer as a
single key-value pair rather than many. The answer is “yes,” and Hadoop provides a
combiner function to accomplish exactly this end.
The Evolving Role of the Enterprise Data Warehouse in the Era of Big Data Analytics 15Each reducer receives a large number of state/year-temperature key-value pairs, and
finds the maximum temperature for a given year. These maximum temperatures for
each year are the final output from each reducer.
This approach can be scaled more or less indefinitely. Really serious MapReduce
jobs running on HDFS may have hundreds or thousands of mappers and reducers,
processing petabytes of input data.
At this point the appeal of the MapReduce/Hadoop approach should be clear. There
are virtually no restrictions on the form of the inputs to the overall job. There only
needs to be some rational basis for creating splits and reading records, in this case
the record identifier in Tom White's example. Actual logic in the mappers and the
reducers can be programmed in virtually any programming language and can be as
simple as the above example, or much more complicated UDFs. The reader should
be able to visualize how some of the more complex use cases (e.g., comparison of
satellite images) described earlier in the paper could fit into this framework.
Tools for the Hadoop environment
What we have described thus far is the core processing component when
MapReduce is run in the Hadoop environment. This is roughly equivalent to
describing the inner processing loop in a relational database management system. In
both cases there's a lot more to these systems to implement a complete functioning
environment. The following is a brief overview of typical tools used in a MapReduce/
Hadoop environment. We group these tools by overall function. Tom White's book,
mentioned above, is an excellent starting point for understanding how these tools are
used.
Getting data in and getting data out
ETL platforms -- ETL platforms, with their long history of importing and
exporting data to relational databases, provide specific interfaces for moving
data into and out of HDFS. The platform-based approach, as contrasted with
hand coding, provides extensive support for metadata, data quality,
documentation, and a visual style of system building.
Sqoop – Sqoop, developed by Cloudera, is an open source tool that allows
importing data from a relational source to HDFS and exporting data from
HDFS to a relational target. Data imported by Sqoop into HDFS can be used
both by MapReduce applications and HBase applications. HBase is described
below.
Scribe – Scribe, developed at Facebook and released as open source, is used
to aggregate log data from a large number of Web servers.
Flume – Flume, developed by Cloudera, is a distributed reliable streaming data
collection service. It uses a central configuration managed by Zookeeper and
supports tunable reliability and automatic failover and recovery.
The Evolving Role of the Enterprise Data Warehouse in the Era of Big Data Analytics 16Programming
Low-level MapReduce programming -- primary code for mappers and
reducers can be written in a number of languages. Hadoop's native language
is Java but Hadoop exposes APIs for writing code in other languages such as
Ruby and Python. An interface to C++ is provided, which is named Hadoop
Pipes. Programming MapReduce at the lowest level obviously provides the
most potential power, but this level of programming is very much like
assembly language programming. It can be very laborious, especially when
attempting to do conceptually simple tasks like joining two data sets.
High level MapReduce programming -- Apache Pig, or simply Pig, is a client-
side open-source application providing a high level programming language for
processing large data sets in MapReduce. The programming language itself is
called Pig Latin. Hive is an alternative application designed to look much more
like SQL, and is used for data warehousing use cases. When employed for the
appropriate use cases, Pig and the Hive provide enormous programming
productivity benefits over low-level MapReduce programming, often by a
factor of 10 or more. Pig and Hive lift the application developer’s perspective
up from managing the detailed mapper and reducer processes to more of an
applications focus.
Integrated development environment – MapReduce/Hadoop development
needs to move decisively away from bare hand coding to be adopted by
mainstream IT shops. An integrated development environment for
MapReduce/Hadoop needs to include editors for source code, compilers, tools
for automating system builds, debuggers, and a version control system.
Integrated application environment – an even higher layer above an integrated
development environment could be called an integrated application
environment, where complex reusable analytic routines are assembled into
complete applications via a graphical user interface. This kind of environment
might be able to use open source algorithms such as provided by the Apache
Mahout project which distributes machine learning algorithms on Hadoop
platform.
Cascading -- Cascading is another tool that is an abstraction layer for writing
complex MapReduce applications. It is best described as a thin Java library
typically invoked from command line to be used as a query API and process
scheduler. It is not intended to be a comprehensive alternative to Pig or Hive.
HBase -- HBase is an open-source, nonrelational, column oriented database
that runs directly on Hadoop. It is not a MapReduce implementation. A
principal differentiator of HBase from Pig or Hive (MapReduce
implementations) is the ability to provide real-time read and write random-
access to very large data sets.
Oozie -- Oozie is a server-based workflow engine specialized in running
workflow jobs with actions that execute Hadoop jobs, such as MapReduce,
Pig, Hive, Sqoop, HDFS operations, and sub-workflows.
The Evolving Role of the Enterprise Data Warehouse in the Era of Big Data Analytics 17 ZooKeeper – ZooKeeper is a centralized configuration manager for distributed
applications. Zookeeper can be used independently of Hadoop as well.
Administering
Embedded Hadoop admin features – Hadoop supports a comprehensive
runtime environment including edit log, safe mode operation, audit logging,
filesystem check, data node block verifier, data node block distribution
balancer, performance monitor, comprehensive log files, metrics for
administrators, counters for MapReduce users, metadata backup, data
backup, filesystem balancer, commissioning and decommissioning nodes.
Java management extensions – a standard Java API for monitoring and
managing applications
GangliaContext – an open source distributed monitoring system for very large
clusters
Feature convergence in the coming decade
It is safe to say that relational database management systems and MapReduce/
Hadoop systems will increasingly find ways to coexist gracefully in the coming
decade. But the systems have distinct characteristics, as depicted in the following
table:
Relational DBMSs MapReduce/Hadoop
Proprietary, mostly Open source
Expensive Less expensive
Data requires structuring Data does not require structuring
Great for speedy indexed lookups Great for massive full data scans
Deep support for relational semantics Indirect support for relational semantics, e.g.
Hive
Indirect support for complex data structures Deep support for complex data structures
Indirect support for iteration, complex Deep support for iteration, complex branching
branching
Deep support for transaction processing Little or no support for transaction processing
In the upcoming decade RDBMSs will extend their support for hosting complex data
types as "blobs”, and will extend APIs for arbitrary analytic routines to operate on the
contents of records. MapReduce/Hadoop systems, especially Hive, will deepen their
support for SQL interfaces and fuller support of the complete SQL language. But
neither will take over the market for big data analytics exclusively. As remarked
earlier, RDBMSs cannot provide "relational" semantics for many of the complex use
cases required by big data analytics. At best, RDBMSs will provide relational structure
surrounding the complex payloads.
The Evolving Role of the Enterprise Data Warehouse in the Era of Big Data Analytics 18Similarly, MapReduce/Hadoop systems will never take over ACID-compliant
transaction processing, or become superior to RDBMSs for indexed queries on row
and column oriented tables.
As this paper is being written, significant advances are being made in developing
hybrid systems using both relational database technology and MapReduce/Hadoop
technology. Figure 4 illustrates two primary alternatives. The first alternative delivers
the data directly into a MapReduce/Hadoop configuration for primary non-relational
analysis. As we have described, this analysis can range the full gamut from complex
analytical routines to simple sorting that looks like a conventional ETL step. When the
MapReduce/Hadoop step is complete, the results are loaded into an RDBMS for
conventional structured querying with SQL.
The second alternative configuration loads the data directly to an RDBMS, even when
the primary data payloads are not conventional scalar measurements. At that point
two analysis modes are possible. The data can be analyzed with specially crafted
user-defined functions, effectively from the BI layer, or passed to a downstream
MapReduce/Hadoop application.
In the future even more complex combinations will tie these architectures more
closely together, including MapReduce systems whose mappers and reducers are
actually relational databases, and relational database systems whose underling
storage consists of HDFS files.
Figure 4. Alternative hybrid architectures using both RDBMS and Hadoop.
It will probably be difficult for IT organizations to sort out the vendor claims which will
almost certainly claim that their systems do everything. In some cases these claims
The Evolving Role of the Enterprise Data Warehouse in the Era of Big Data Analytics 19are "objection removers" which means that they are claims that have a grain of truth
to them, and are made to make you feel good, but do not stand up to scrutiny in a
competitive and practical environment. Buyer beware!
Reusable analytics
Up to this point we have begged the issue of where does all the special analytic
software come from. Big data analytics will never prosper if every instance is a
custom coded solution. Both the RDBMS and the open-source communities
recognize this and two main development themes have emerged. High-end statistical
analysis vendors, such as SAS, have developed extensive and proprietary reusable
libraries for a wide range of analytic applications, including advanced statistics, data
mining, predictive analytics, feature detection, linear models, discriminant analysis,
and many others. The open source community has a number of initiatives, the most
notable of which are Hadoop-ML and Apache Mahout. Quoting from Hadoop-ML’s
website:
“ Hadoop-ML (is) an infrastructure to facilitate the implementation of parallel
machine learning/data mining (ML/DM) algorithms on Hadoop. Hadoop-ML
has been designed to allow for the specification of both task-parallel and data-
parallel ML/DM algorithms. Furthermore, it supports the composition of
parallel ML/DM algorithms using both serial as well as parallel building blocks
-- this allows one to write reusable parallel code. The proposed abstraction
eases the implementation process by requiring the user to only specify
computations and their dependencies, without worrying about scheduling,
data management, and communication. As a consequence, the codes are
portable in that the user never needs to write Hadoop-specific code. This
potentially allows one to leverage future parallelization platforms without
rewriting one's code.”
Apache Mahout provides free implementations of machine learning algorithms on
Hadoop platform.
Complex event processing (CEP)
Complex event processing (CEP) consists of processing events happening inside and
outside an organization to identify meaningful patterns in order to take subsequent
action in real time. For example, CEP is used in utility networks (electrical, gas and
water) to identify possible issues before they become detrimental. These CEP
deployments allow for real-time intervention for critical network or infrastructure
situations. The combination of deep DW analytics and CEP can be applied in retail
customer settings to analyze behavior and identify situations where a company may
lose a customer or be able to sell them additional products or services at the time of
their direct engagement. In banking, sophisticated analytics might help to identify the
10 most common patterns of fraud and CEP can then be used to watch for those
patterns so they may be thwarted before a loss.
At the time of this white paper, CEP is not generally thought of as part of the EDW,
but this author believes that technical advances in continuous query processing will
The Evolving Role of the Enterprise Data Warehouse in the Era of Big Data Analytics 20cause CEP and EDW to share data and work more closely together in the coming
decade.
Data warehouse cultural changes in the coming decade
The enterprise data warehouse must absolutely stay relevant to the business. As the
value and the visibility of big data analytics grows, the data warehouse must
encompass the new culture, skills, techniques, and systems required for big data
analytics.
Sandboxes
For example, big data analysis encourages exploratory sandboxes for
experimentation. These sandboxes are copies or segments of the massive data sets
being sourced by the organization. Individual analysts or very small groups are
encouraged to analyze the data with a very wide variety of tools, ranging from serious
statistical tools like SAS, Matlab or R, to predictive models, and many forms of ad hoc
querying and visualization through advanced BI graphical interfaces. The analyst
responsible for a given sandbox is allowed to do anything with the data, using any tool
they want, even if the tools they use are not corporate standards. The sandbox
phenomenon has enormous energy but it carries a significant risk to the IT
organization and EDW architecture because it could create isolated and incompatible
stovepipes of data. This point is amplified in the section on organizational changes,
below.
Exploratory sandboxes usually have a limited time duration, lasting weeks or at most
a few months. Their data can be a frozen snapshot, or a window on a certain segment
of incoming data. The analyst may have permission to run an experiment changing a
feature on the product or service in the marketplace, and then performing A/B testing
to see how the change affects customer behavior. Typically, if such an experiment
produces a successful result, the sandbox experiment is terminated, and the feature
goes into production. At that point, tracking applications that may have been
implemented in the sandbox using a quick and dirty prototyping language, are usually
reimplemented by other personnel in the EDW environment using corporate standard
tools. In several of the e-commerce enterprises interviewed for this white paper,
analytic sandboxes were extremely important, and in some cases hundreds of the
sandbox experiments were ongoing simultaneously. As one interviewee commented,
"newly discovered patterns have the most disruptive potential, and insights from them
lead to the highest returns on investment."
Architecturally, sandboxes should not be brute force copies of entire data sets, or
even major segments of these data sets. In dimensional modeling parlance, the
analyst needs much more than just a fact table to run the experiment. At a minimum
the analyst also needs one or more very large dimension tables, and possibly
additional fact tables for complete "drill across" analysis. If 100 analysts are creating
brute force copy versions of the data for the sandboxes there will be enormous
wasting of disk space and resources for all the redundant copies. Remember that the
The Evolving Role of the Enterprise Data Warehouse in the Era of Big Data Analytics 21You can also read