Economic history of industrialization in Cambodia
←
→
Page content transcription
If your browser does not render page correctly, please read the page content below
Working Paper No. 7

Economic history of industrialization in
Cambodia
            1              2
Sokty Chhair and Luyna Ung

Abstract
The industrialization which started in 1953 had been completely disrupted by the chronic civil
war and closed-door policy of successive communism/socialism regimes. Since 1993
Cambodia has embraced a market economy heavily dependent on foreign capital and foreign
markets. As a result, the economy has experienced high economic growth rate yet with low
linkage to domestic economy. The government’s Rice Export Policy introduced in 2010 to
diversify its economy, maximize its value added and job creation was highly evaluated to
bring those benefits under the environment of weak governance. Whether similar kind of such
a policy for other sectors is successful remains to be seen.

Keywords: industrialization, mixed economy, cooperative, garment sector, Cambodia
JEL classification: L2, L52

                                                                                        1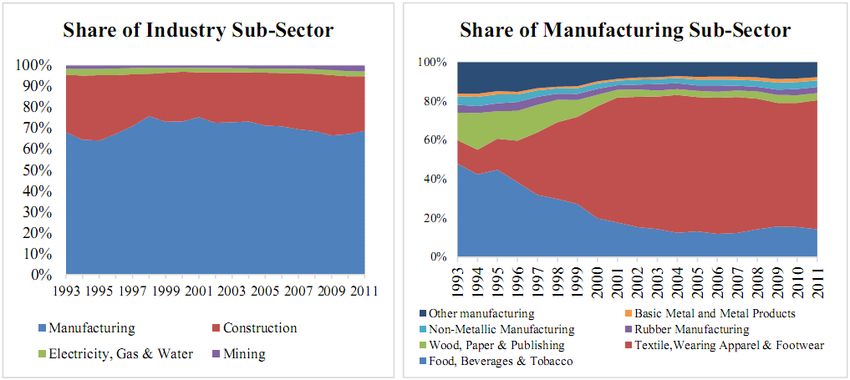
1                                   2
     Cambodian Economic Association; Supreme National Economic Council; corresponding author email:
    chhairsokty@yahoo.com.

        The Brookings Institution is a private non-profit organization. Its mission is to conduct high-quality,
independent research and, based on that research, to provide innovative, practical recommendations for policymakers
and the public. Brookings recognizes that the value it provides is in its absolute commitment to quality, independence
and impact. Activities supported by its donors reflect this commitment and the analysis and recommendations are not
determined or influenced by any donation.
        Learning to Compete (L2C) is a collaborative research program of the Africa Growth Initiative at Brookings
(AGI), the African Development Bank, (AfDB), and the United Nations University World Institute for Development
Economics Research (UNU-WIDER) on industrial development in Africa. Outputs in this Working Paper Series have
been supported by all three institutions.
        AGI-Brookings is grateful for the contribution of an anonymous donor for funding its work under the
collaborative research program.
          The views expressed in this publication are those of the author(s), and do not reflect the views of the
Institution, its management, or its other scholars. Publication does not imply endorsement by any of the collaborating
institutions or their program sponsors of any of the views expressed.
1 Introduction
Cambodia emerged a newly independent nation in 1953 with ambitions for growth and
development through the expansion of industry. Sixty years after, following decades of war and
destruction, these ambitions are beginning to be realized with double-digit growth rates and an
expansion of business and economic activity.
This paper sets out the historical evolution of the economy of Cambodia and documents the
political and economic events that led to its current economic structure. Over the last 60 years
Cambodia has experienced a number of very different political ideologies which strongly
influenced its industrial policy of the time. In Section 2 we describe each of these regimes,
focusing on the development of the industrial sector and the successes and failures that
characterize the time. The main regimes are: (i) the Sihanouk Regime (1953–70), which
attempted to foster industrial development through a mixed approach of encouraging private
capital and enterprise coupled with state investment; (ii) the Khmer Republic (1970–75), which
adopted a laissez faire approach but was ravaged by civil war; (iii) Democratic Kampuchea
(1975–79), which saw the rise to power of the Khmer Rouge leading to nationalization,
deindustrialization, genocide, and the destruction of all private capital; (iv) the People’s Republic
of Kampuchea (PRK) (1979–89), a socialist regime with a focus on agriculture that remained
closed to the world economy; (v) the State of Cambodia and the UN Period (1989–93), a
transition period to a market economy; and (vi) the Kingdom of Cambodia (1993 to present day),
a market economy mainly based on foreign investment and foreign markets.
For the period before the civil war in 1970 limited documented evidence exits and so we rely on
three leftist economic scholarly works by Hou (1955), Khieu (1959), and Hu (1963). Among
them, only Khieu (1959) focuses on industry. Moreover, most historians tend to focus on political
history rather than economic history due to the incidence of chronic civil war, genocide, the UN-
brokered international peace settlement, democracy, governance, and other political issues during
the last four decades. Exceptions include Slocomb (2010), Ear (1995), and Vickery (1986). We
draw heavily from these works in our review of the industrial sector and economy in general in
the period up to 1993. After 1993, many additional sources are available.
Since the 1993 election, overseen by the United Nations (UN), Cambodia has been in transition to
a full market economy, following decades of war and isolation from international markets by a
socialist regime. It is since then that an expansion of industry has been observed. In Section 3 we
document this growth and development focusing on the structure of industry in terms of output
and employment and the characteristics of enterprises. We also document the key sunrise sectors
including tourism, banking, rice production and processing, and rubber plantations. Particular
focus is also placed on the garment sector, the sector for which Cambodia is perhaps most known
from an international perspective.
In Section 4 we provide an overview of the various policies in place to address the growing needs
and priorities of this industrializing nation. We address industrial policies specifically but also
discuss the various macroeconomic, trade, regulatory and labour market policies of relevance.
The paper concludes with a discussion of the key opportunities and challenges facing Cambodia,
1most notably the need to develop industry further and in a new direction that promotes local
business, produces more value added, creates more links with the domestic economy and meets
international labour standards.
2 Evolution of industry: a historical perspective
2.1 Sihanouk regime (1953–70)
Cambodia gained full independence from France in 1953. During the French colonial era (1863–
53) emphasis was placed on agriculture and as such the newly independent Cambodian economy
began with a low industrial base. The colonial administration focused on household-based rice
cultivation, the development of large rubber plantations and the integration of the economy of
Cambodia to the French economy.1 Some factories were established to supply the domestic
market, including textiles, paper and foundries, but most depended on imports for raw materials
and were foreign-owned or owned by the elite Chinese ethnic group.
The focus of the newly independent Cambodian state that emerged in 1953 was on building
Cambodia’s industrial base. It was attempted to achieve this through a policy of modernization
which was the trend in the newly independent states in Asia and Africa at that time. The Two-
Year Plan (1956–57), also known as the ‘Plan of study, reflection and experimentation’ and the
first Five-Year Plan (1960–64) were introduced. The Two-Year Plan (1956–57) concentrated on
developing infrastructure while the Five-Year Plan (1960–64) focused more on building factories
(Delvert 1963). Slocomb (2010) documents how during the Sihanouk regime, Cambodia largely
accepted economic coexistence with foreign interests, hiring foreign personnel to fill the posts
formally staffed by the French administration during the French colonial era and accepting
foreign capital investments. The economy could best be described as a mixed-economy which
merged individual capital and enterprise with state capital and supervision. The state created
enterprises to break the monopoly of local Chinese merchants in purchasing agricultural products
and selling them to villagers. State co-operatives in the countryside also operated their own credit
programmes which historically were monopolized by the Chinese. Table 1 shows a significant
increase in the number of factories between 1955 and 1968, from none to 28 state-owned factories
and 29 joint-venture factories (private and public ownership) while small and medium private
factories increased dramatically from 650 in 1965 to 3,700 in 1968.
Table 1: The number and classification of factories between 1955 and 1968
1955 1968
State-owned factories 0 28
Joint-venture factories (private and public ownership) 0 29
Small and medium private factories 650 3,700
Source: based on Cambodge (1970) cited in Ear (1995: 49).
1 The first railway was built in 1922 by France connecting the northeastern part of the country, known as the rice
bowl of Cambodia, to Phnom Penh, the capital city. The purpose of the railway was to integrate Cambodia’s
economy to the world, rather than to promote development within Cambodia. In 1939, according to Khieu (1959), 80
per cent of the volume of products transported by the railway were destined for abroad. Only remaining 20 per cent
were shipped to the rest of the country.During the Cold War, Cambodia experienced significant investment in infrastructure largely financed by donor interests. As a peaceful island surrounded by war-torn countries in Indochina it was a strategically important location from a military perspective, particularly given the neutral foreign policy adopted by Prince Sihanouk during the 1960s. As a result Cambodia saw its foreign assistance increase from donors on both sides of the Cold War. With this heavy assistance, several megaprojects were built: the highway linking the capital city, Phnom Penh, and the port city of Sihnoukville was built with American aid and the port itself with French funding; France and Germany jointly funded railway construction connecting Phnom Penh to Sihnoukville; a 10,000 kilowatts Kirirom hydroelectric plant was constructed with a loan from Yugoslavia; while a plywood factory was built with Chinese aid (Slocomb 2010). In addition, the Chinese built a 5,000 ton paper mill, a textile factory, and a large cement factory. Three other factories were built by the Czech: a palm sugar refinery in Kampong Speu, a tire factory at Takhmau in Kandal, and a tractor assembly plant in Sihanoukville. In the Five-Year economic plan (January 1960 to December 1964), only 2 per cent of the budget was contributed by Cambodia, 57 per cent of the contribution was from the USA, 23 per cent from China, and 17 per cent from France. While infrastructure improved, along with the number of enterprises, there was little by way of structural change evident in the aggregate figures. As illustrated in Table 2, manufacturing accounted for 8.6 per cent of GDP in 1962, increasing to 10.5 per cent in 1966, and 12 per cent (including mining) in 1968 (see Figure 1). Agriculture remained at around 41 per cent of GDP throughout these years. Overall, the economic structure changed very little between 1966 and 1968. Cambodia’s exports overwhelmingly depended on primary products. Rice and rubber were by far the largest exports, accounting for more than half of total exports. The removal of protective tariffs at the end of 1969 heavily hit small enterprises, which accounted for 90 per cent of firms at this time. Due to the protective industrial policies many firms could not compete when being exposed to foreign markets. Only a handful of large investors benefited from the policy change but they too were affected by inflation and rising labour costs. Efforts were made to industrialize further through a policy of import-substitution but this had little success due to the prevailing inefficiencies of state-owned enterprises. The survival of these enterprises had mainly been sustained by heavily protected tariffs. By the end of this era the economic structure of Cambodia appeared similar to the economy of the newly independent economy in 1953.
Table 2: Sector share of GDP at 1966 prices, in %
                                                                         1962            1966
            Agriculture                                                  30.7            30.3
            Animal husbandry                                             4.3             4.9
            Fishing                                                      2.4             2.3
            Forestry                                                     3.9             3.5
            Salt mining                                                  0.1             -
            Manufacturing                                                8.6             10.5
            Energy and water supply                                      0.9             1.1
            Construction                                                 6.8             5.3
            Transportation                                               2.0             2.1
            Commerce                                                     23.8            22.2
            Public administration, defense, and financial institutions   13.1            14.4
            Other services                                               3.4             3.4
Source: Ministry of Planning (1966) cited in Slocomb (2010).

Figure 1: Sector share of GDP in Cambodia, 1968

Source: based on Chantrabot (1993) cited in Ear (2009: 49).

2.2 Khmer Republic (1970–75)

From 1970 Cambodia was plunged into a civil war with each side supported by either China or
the USA. However, even before the regime change in 1970, the leaders of the coup, General Non
Nol and Sisowath Sirik Matak, who would be the new leaders in the new regime, led the national
salvation government from August 1969 charged with the responsibility of reviving the stagnant
economy which emerged from the Sihanouk regime.
The new policy, which embraced laissez fair, involved devaluing the currency, removing state
controls on foreign trade and banking, and reducing state involvement in enterprise. In other
words, the most significant change to industrial policy was the disengagement of the public sector
and the emphasis on private enterprises as the mechanism for commercial and industrial
development (Slocomb 2010). Rice and maize production were liberalized with the dissolution of
state monopoly over the export of grains and cereals. The state only remained the monopoly
power in the production and distribution of electricity above 500 kilowatts, military-related
sectors, railway, postal services, and telecommunication services.
These policies were, however, short-lived and their implementation was interrupted by the civil
war. The price of necessities was fixed and controlled by the state and the state kept its exclusive
monopoly over all main primary products such as rice, maize, rubber, and precious or semi-
precious stones. The wartime economy depended solely on foreign assistance, mostly from the
USA, for survival.
Table 3 highlights the impact that the civil war had on the agricultural production for rice, rubber,
and corn leading to significantly lower yields. The manufacturing index which had been 100 in
1960 fell to 73 in 1972.
Table 3: Agricultural production in hundreds of thousands of metric tons, 1968–74
1968/69 1969/70 1970/71 1971/72 1972/73 1973/74
Rice 2,503 3,814 2,732 2,138 953 762
Rubber (tons) 51 52 13 1 15 12
Corn 117 137 121 80 73 -
Palm sugar - 34 23 - - -
Source: based on Ear (1995).
2.3 Closed economy (1975–89)
The period spanning 1975 and 1989 consisted of two rival regimes both of which followed a
Marxist ideology. Slocomb (2010) describes Cambodia during this period as a revolutionary
economy. Both regimes closed the door to foreign investment and markets and their priority
sector was agriculture with industry playing only a supporting role in supplying agricultural
implements and processing agricultural products. The extent to which the two regimes adopted
Marxism was their main distinction. The former was much harsher and dogmatic while the latter
was more pragmatic and responsive to local conditions.
Democratic Kampuchea (1975–79)
The Khmer Rouge came to power influenced heavily by Maoist ideology. The ambition was to
make the transition to communism in Cambodia in the shortest possible time period. The
economic policy was to demolish capitalists, enslave the labour force and focus on the rapid
development of agriculture. To achieve this, the regime completely and immediately collectivized
agriculture, nationalized all sectors of the economy, and adopted a policy of self-reliance. All
assets were owned by the state and all international involvement was removed. This new policy
completely reversed the economic policy adopted by the previous regime which represented ashift from one extreme pole of economic ideology to the other. Phnom Penh and other provincial cities were emptied and the urbanites were forced to work as collective farmers in the countryside. Private ownership was completely banned and money was eliminated. From 1975 to 1979, the bourgeoisie class was considered an enemy of the state and entrepreneurship disappeared. The regime also banned all international trade leaving only very limited trade with a few allied communist countries. People’s Republic of Kampuchea (1979–89) After the liberation of Cambodia from the Khmer Rouge regime, the new regime, the PRK was left with little to restore the Cambodian economy. The economy was dominated by subsistence agriculture with little or no industry2. The first priority of the PRK was food and self-sufficiency in an economy where human and physical infrastructure had been destroyed, and a guerrilla war with the Khmer Rouge, who was still at large along Cambodia’s border with Thailand, persisted. Engineers, skilled workers, and other human resources had either fled to other countries as war refugees or fell victims of genocide. From 1979–89, economic policy focused on food security and the eradication of hunger throughout the country. State-owned enterprises were re-established, which included tobacco, cotton, and electricity companies, a mechanical workshop, spare parts, beverage and glassware factory, and a tire factory, all with the aim of providing basic consumer goods and public utilities. State enterprises frequently sold products at subsidized prices and/or offered them as rations for government officials. The state subsidized prices for some basic commodities such as kerosene, cigarettes, soap, rice, sugar, and condensed milk. During the 1980s, informal trade and smuggling were widespread. According to Vickery (1986: 128–29), there were three economic organizations that coexisted in the economic system adopted by the PRK. First, there was the state which controlled large industry, finance, transport, official foreign commerce, and some large agricultural plantations. Second, there were the collectives, called solidarity groups, which controlled agricultural production such as land and agricultural equipment. Third, there was the family which involved small trade, handicraft, and side agricultural works which households could engage in once they finished their obligations to the solidarity group. In 1986, 97 per cent of the rural population were in the collective sector which was composed of more than 100,000 solidarity groups each of which consisted of seven to fifteen families. This was not enough, however, to feed the population of Cambodia and immediate food relief was provided by Vietnam, the Soviet-bloc countries and international humanitarian aid organizations. In 1988, the total value of industrial production, including handicraft was only US$20 million but it was dominated by state-owned enterprises (Slocomb 2010: 215). The share of industry in GDP was only 5 per cent in 1985 compared to 19 per cent in 1969 (Cosslet 1990) while the share of agriculture in GDP increased to 90 per cent in 1985. Until 1985, only about half of the pre-war plants had reopened and the ones that did produced far below full capacity due to frequent 2 During the period of the PRK regime, only 63 out of 85 enterprises in Cambodia were potentially operational but only 12 factories were functioning producing textiles, tires, plastics, and iron tools with raw materials supplied by international non-governmental aid agencies (Slocomb 2010: 215).
electricity power cuts and a lack of spare parts and raw materials (Cosslet 1990). In 1988, the
share of state-owned manufacturing output was around two-thirds of all manufacturing output.

2.4. State of Cambodia and the UN period (1989–93)

With the fall of the Soviet Union and the Eastern Bloc and the reform of Vietnam’s economic
policy, Doi Moi, beginning in 1986, Cambodia began the gradual process of economic reform.
The process of reform toward becoming a market economy was compounded by the signing of
the Paris Peace Accords in October 1991. As part of the peace agreement the government of
Cambodia relinquished the role of rehabilitation and reconstruction to the UN. The priority for the
rehabilitation phase was social development and the provision of basic needs such as food
security, health, housing, training, education, public utilities, and basic transport infrastructure.
During the reconstruction phase entrepreneurship and private sector development was also
promoted to prepare for entry into a free market economy.

The International Committee on the Reconstruction of Cambodia, a consultative body which
included the government, donors, and other involved parties, monitored the process of transition.
This body, which later evolved into the consultative group, met annually to provide loans and
grants for development, on the condition of reforms being implemented by the government.
Through these reforms Cambodia’s political and economic development moved from a command
to a laissez faire capitalist economy, from a large to a small bureaucracy, and from domestic to
export-oriented production (Slocomb 2010: 289). In the mid-1980, Cambodia introduced private
property leading to the gradual privatization of state-owned companies and the de-collectivization
of agriculture.

Table 4 illustrates some of the success of this period with GDP experiencing strong growth in
1988 at 9.8 per cent, a slowdown in 1989 and 1990, and a recovery thereafter largely driven by
the buildup of the UN operation. Agriculture contributed slightly over half of GDP during this
time while the service sector accounted for around 33 per cent of output and industry 15 per cent.

These successes and market reforms were, however, undermined by macroeconomic imbalances
caused by declining state revenue due to the increased unit cost of goods and services procured
for operations and investments, the removal of humanitarian aid and credit from the Soviet Union,
and high inflation caused by monetary financing of the budget deficit (Royal Government of
Cambodia 2009). As a result, the inflation rate accelerated from 70 per cent in 1989 to 200 per
cent in 1992 (see Table 5). Inflation was stabilized in 1993 through reductions in the government
deficit (Irvin 1993) but the high inflation rate of the previous years led to a decline in public
confidence in the national currency and the permanent dollarization of the economy.
Table 4: Real GDP growth and share of GDP, 1988–92

                                   1988         1989        1990         1991         1992
 Real GDP growth rate
 GDP                               9.8          3.5         1.2          7.6          6.9
  Agriculture                      5.9          7.1         1.2          6.7          4.8
  Industry                         15           1.8         -2.1         8.9          8.4
  Services                         13.6         -1.1        2.7          8.4          9.5
 GDP by sector
  Agriculture                      50.5         52.2        52.3         51.8         50.8
  Industry                         15.7         15.4        14.9         15.1         15.3
  Services                         33.8         32.4        32.8         33.1         33.9
Source: based on Irvin (1993).

Table 5: Inflation rate, 1989–92
 Year           1989                     1990            1991                  1992
 Rate (%)       70                       157             121                   200
Source: based on Ear (1995).

2.5 Kingdom of Cambodia (1993–present)

After the first general election in 1993, the Government prepared and implemented a
comprehensive macroeconomic policy and structural reform programme with efforts to integrate
Cambodia’s economy into the region and the world. In the late 1980s, Cambodia began the
process of market liberalization. The state monopoly to foreign trade was abolished in 1987, and
the foreign investment law was brought into force in 1989, enabling private companies to engage
in foreign trade. In the early 1990s, trade policies were further liberalized, largely removing
restrictions on firms and individuals engaged in international trade. Most quantitative restrictions
and the licensing of imports were eliminated. In the late 1990s, there was a more deliberate phase
of positive steps towards a highly liberal trade regime.

To promote industrial development, the government provided generous incentives to attract
foreign direct investment (FDI) and at the same time strived to find export markets for FDI-
manufactured products. Tax exemptions were provided on imported intermediate goods and on
the exporting of finished goods. Cambodia became a member of the ASEAN Free Trade Area in
1999 and eventually the World Trade Organization (WTO) in 2003. Membership of these
organizations placed further requirements on Cambodia to liberalize trade in goods and services
and foreign capital ownership. FDI has played a significant role in creating a production base,
especially to exploit trade opportunities in advanced economies. The inflow of FDI increased
from just US$124 million in 1993 to US$520 million in 2009 and to over 1,500 million in 2012
(author’s calculations based on database of the Ministry of Economy and Finance).

Many state-owned activities have been terminated and only economically viable enterprises are
allowed to continue. Public enterprises compete with the private sector in the area of utilities,
education, and transportation and most only survive due to geographical constraints to regional
and world competition. According to authors’ calculation based on the Economic Census (EC 2011) conducted by the National Institute of Statistics (NIS) and the Ministry of Planning in March 2011, private establishments accounted for 96 per cent of the total number of establishments and 90 per cent of the number of persons engaged in 2011, while state-owned establishments accounted for less than 3 per cent of the total number of establishments and 8 per cent of the number of persons engaged. Economic growth during 2004–08 averaged 10.3 per cent (Hang 2009). Cambodia’s growth performance ranked 7th across all countries in the world and has higher exports per capita than other countries at Cambodia’s level of economic development (World Bank 2009). While the ratio of investment and saving to GDP is low it has been increasing. Key risk factors for Cambodia’s economic development include its dependence on a few key sectors such as garments, agro-processing, tourism and construction, which are vulnerable to international markets, coupled with the fact that technological spillovers and economic linkage from foreign firms to other sectors of economy are low. The government in recent years has begun to promote local micro, small, and medium enterprises, and increase the value added of the production chain. 3 The structure of industry 3.1 Sectoral composition Section 2 documented the evolution of industrial policy and industry since independence in 1953. As highlighted it was not until the early 1990s that industrial development was given prominence in economic policy. As illustrated in Figure 2, the share of industry increased from 12.6 per cent in 1993 to around 22.6 per cent in 2011. The growth in the importance of industry in GDP can be categorized into four different phases of development summarized in Table 6. Figure 2: Share of industry and manufacturing sub-sector Source: author’s calculations based on database of the National Account from NIS.
Table 6: Phase of industrial development
           Period               Ratio of manufacturing to             Remarks
                                GDP, in %
           1993–                12–16                                 First general election to Asian
           98                                                         Financial Crisis
           1999–                18–25                                 Full peace period, ASEAN
           2003                                                       Membership
           2004–                >25                                   Post-WTO accession
           07
           2008–                21–22                                 Global financial crisis
           present
Source: authors’ calculations based on database of the National Account from NIS.

The first phase, 1993–98, saw an increase in the share of manufacturing to GDP from 12 per cent
to 16 per cent. This period begins after the first general election in 1993 and lasted until the Asian
financial crisis and the domestic military clash in 1997 and represented the first growth period for
the manufacturing sector in Cambodia. The second phase was from 1999–2003, when growth in
the manufacturing sector escalated after Cambodia achieved full peace throughout in 1998 and
successfully integrated into ASEAN in 1999. The ratio of manufacturing to GDP reached almost
25 per cent. At the end of 2003, growth in the garment sector, the driver of the manufacturing
sector, faced uncertainty due to the expiration of the multi-fiber agreement. The third phase of
manufacturing development began in 2004 when Cambodia became a member of the WTO.
During this phase, the share of the manufacturing sector in the economy reached its peak of more
than 25 per cent of GDP. During the fourth and most recent phase the fast growth rate of the
manufacturing sector has subsided in the aftermath of the global financial crisis.

Cambodia’s industrial sector is dominated by manufacturing and construction, which accounted
for 70 per cent and 20 per cent, respectively, in 2011. Food, beverages and tobacco (FBT) and
textile, wearing apparel and footwear (TWF) together account for 80 per cent of value added of
the manufacturing sector. The share accounted for by TWF has grown from barely 20 per cent in
1993 to around 60 per cent while the share accounted for by FBT has dropped from almost 50 per
cent in 1993 to just about 25 per cent in recent years. It is also worth noting that the
manufacturing of wood, paper and publishing has also been in decline due to the rapid decline of
forested areas.

Table 7 illustrates the percentage of establishments by sub-sector of industry. In 2011, the number
of industrial establishments was 77,048, of which the share of manufacturing was 93 per cent
based on EC2011.
Table 7: The number and percentage of establishments by sub-sector of industry Type of industry ISIC Rev4 Number Percentage Mining & quarrying 0710-0990 178 0.23 Food, beverage and tobacco 1010-1200 32,257 41.87 Textile, wearing apparel and footwear 1311-1520 25,156 32.65 Wood, paper and printing 1610-1820 2274 2.95 Chemical and medicines 1910-2100 159 0.21 Rubber, plastic, cement, metals and casting 2211-2432 2,910 3.78 Machinery components assemblies 2511-2790 4,740 6.15 Vehicle assemblies 2811-3099 104 0.13 Furniture and handicraft 3100-3290 3,031 3.93 Repairs 3311-3320 938 1.22 Electricity, water and waste collection 3510-3900 5,112 6.63 Construction 4100-4390 189 0.25 Total 77,048 100.00 Source: authors’ calculations based on EC2011 from NIS. 3.2 Size of firms The number of enterprises in Cambodia has been increasing gradually, tracking the expansion of the economy, especially during the period of two-digit growth rates from 1999 to 2008. In 1999, the number of small and medium enterprises (SMEs)3 was estimated at about 25,000, and reached 36,000 in 2009. The growth in the number of establishments was about 44 per cent in ten years. During this period, employment in the industrial sector expanded, and labour productivity in the sector increased significantly. Despite rapid growth, the sector is still dominated by micro establishments. In 2011, micro establishments accounted for 92.10 per cent of all establishments providing 47.90 per cent of jobs and generating 40.08 per cent of total value added while large establishments accounted for only 0.32 per cent of the total but provided 29.64 per cent of jobs and generated 42.32 per cent of total value added (see Table 8). Table 8 reveals that there were 524,572 establishments in Cambodia as of March 2011 and the number of persons engaged in these establishments was 1,725,671. Compared to the Nation-Wise Establishment Listing of Cambodia 2009 (EL 2009) which was also conducted by NIS, this was an increase of 27.65 per cent in the number of establishments and of 17.42 per cent in the numbers employed. There were 89,580 new establishments which started business between 01 January 2009 and 01 March 2011. However, 86.1 per cent of the new establishments were enterprises with one or two persons. On average, the number of persons engaged in establishments is 3.4 in 2011. 3 Firms with less than five employees are defined as micro establishments; between five and 20 employees as small establishments; between 20 and 50 employees as medium establishments; and over 50 employees as large establishments.
Table 8: The number of establishments, employment, and annual revenue by firm size, 2011

Firm        Number of                  Number of                   Annual revenue
size        establishments    %        employees          %        US$ ‘000            %
Micro       483,128           92.10    826,579            47.90    5,010,000           40.08
Small       36,177            6.90     283,825            16.45    1,400,000           11.20
Medium      3,612             0.69     103,809            6.02     787,000             6.30
Large       1,655             0.32     511,458            29.64    5,290,000           42.32
Total       524,572           100      1,725,671          100      12,500,000          99.90
Source: authors’ calculations based on EC2011 from NIS.

As revealed in Tables 8 to 11, it is clear that micro establishments dominate the Cambodian
economy. In EC2011, over 92 per cent of all establishments were micro establishments. Likewise
for industrial establishments, micro industrial establishments made up over 90 per cent of total
industrial establishments. SMEs of industrial establishents accounted for about 8.34 per cent and
less than 0.69 per cent of industrial establishments were considered large enterprises.
In Table 9, the share of employment in large industrial establishments is 65.50 per cent and these
establishments generate 78 per cent of value added. This suggests that the foundations for large
industry are strengthening while micro, small and medium industrial establishments are struggling
to survive. Moreover, in Table 12, we see that 406 out of 612 large industrial establishments are
in TWF.

Considering only industrial establishments in Table 11, we observe a 16 per cent decline in the
number of establishments between 2009 and 2011. Subdividing by firm size, these figures mask a
20 per cent increase in the number of large industrial establishments.

Table 9: Number of industrial establishments, employment and annual revenue by firm size, 2011

             Number of                 Number of                     Annual revenue
Firm size    establishments    %       employees           %         US$ ‘000          %
Micro        70,008            90.86   131,845             23.80     310,000           9.34
Small        5,898             7.65    44,031              7.95      216,000           6.51
Medium       530               0.69    15,279              2.76      204,000           6.14
Large        612               0.79    362,903             65.50     2,590,000         78.01
Total        77,048            100     554,058             100       3,320,000         100
Source: authors’ calculations based on EC2011 from NIS.
Table 10: Growth in number of establishments and employees by firm size, 2009–11
Firm size Number of establishments Total employment
EL2009 EC2011 Growth rate % EL2009 EC2011 Growth rate %
Micro 330,528 483,128 32.96 642,230 826,579 28.70
Small 41,282 36,177 -12.37 306,139 283,825 -7.29
Medium 3,512 3,612 2.85 99,431 103,809 4.40
Large 1,439 1,655 15.01 421,912 511,458 21.22
Total 376,761 524,572 27.65 1,469,712 1,725,671 17.42
Source: authors’ calculations based on EL2009 and EC2011 from NIS.
Table 11: Number of industrial establishments and employees by firm size, 2009–11
Firm size Number of establishments Total employment
EL2009 EC2011 Growth rate % EL2009 EC2011 Growth rate %
Micro 80,931 70,008 -13.50 166,954 131,845 -21.03
Small 9,516 5,898 -38.02 64,332 44,031 -31.56
Medium 540 530 -1.85 15,365 15,279 -0.56
Large 509 612 20.24 298,980 362,903 21.38
Total 91,496 77048 -15.79 545,631 554,058 1.54
Source: authors’ calculations based on EL2009 and EC2011 from NIS.
Table 13 compares the proportion of industrial establishments by firm size in 2003 in the
Investment Climate Survey in 2003 (ICS2003) conducted by the World Bank. If truly
representative of economic activity the figures suggest that the share of small and medium
industrial establishments declined from 42.5 per cent and 11.25 per cent to only 10.43 per cent
and 3.62 per cent, respectively in 2011. However, the share of value added of small and medium
industrial establishments increased from 1.27 per cent and 2.80 per cent in ICS2003 to 7.18 per
cent and 6.78 per cent, respectively in 2011. It should be noted, however, that we exclude
establishments with less than five employees from the EC2011 data to be comparable with
ICS2003, which did not include establishments with less than five employees. This suggests that
SMEs have an increasing role in generating value added.Table 12: The number of establishments in selected industrial sectors by size
Type of industry ISIC Rev4 Micro Small Medium Large
Mining & quarrying 0710-0990 83 69 19 7
Food, beverage and tobacco 1010-1200 30,396 1,742 76 43
Textile, wearing apparel and footwear 1311-1520 23,306 1,323 121 406
Wood, paper and printing 1610-1820 1,919 283 33 39
Chemical and medicines 1910-2100 84 50 9 16
Rubber, plastic, cement, metals and casting 2211-2432 2,023 658 184 45
Machinery components assemblies 2511-2790 3,843 877 12 8
Vehicle assemblies 2811-3099 74 25 1 4
Furniture and handicraft 3100-3290 2,734 277 8 12
Repairs 3311-3320 851 84 2 1
Electricity, water and waste collection 3510-3900 4,616 421 51 24
Construction 4100-4390 79 89 14 7
Total 70,008 5898 530 612
Share of total 90.86% 7.65% 0.69% 0.79%
Source: authors’ calculations based on EC2011 from NIS.
Table 13: Share of employment and value added of industrial establishments by firm size, in %
Employment Value added
Employment Employment Employment Employment
Firm size All All
5 or more 5 or more 5 or more 5 or more
ICS2003 EC2011 EC2011 ICS2003 EC2011 EC2011
Micro - 23.80 - 9.34
Small 42.50 10.43 7.95 1.27 7.18 6.51
Medium 11.25 3.62 2.76 2.80 6.78 6.14
Large 46.87 85.95 65.50 95.75 86.05 78.01
Source: authors’ calculations based on ICS2003 from World Bank and EC2011 from NIS.
3.3 Employment
Estimates of employment in Cambodia are less reliable due to high levels of migration both
within Cambodia and internationally. In this section we use data from many selected years of the
annual Cambodia’s Socio-Economic Surveys (CSESs), which ask the main occupation within the
12 months of each member of the households surveyed, to measure the percentage share of the
three main sectors in the economy. According to this estimation, the share of employment in
agriculture declined from nearly 72 per cent in 1993 to 65 per cent in 2010. The increasing rate of
industrial development is reflected in employment generation in the sector with industry
accounting for 11 per cent of employment in 2010. These changes highlight the transformation of
the economy from an agriculture base to an industrial and service base.Figure 3: Share of employment by three main sectors
Agriculture Industry
100%
23% 18% 23% 19% 22% 24%
80% 4% 9%
5% 9% 11% 11%
60%
40% 72% 77% 72%
68% 67% 65%
20%
0%
1993 1998 2004 2008 2009 2010
Source: authors’ calculations based on database of CSESs in 1993, 1998, 2004, 2008, 2009, and 2010
from NIS.4
Table 14 reveals that there were 77,048 establishments in the industrial sector which employed
554,058 persons in 2011.5 TWF accounted for 67.56 per cent of industrial employment and FBT
accounted for 15.16 per cent. The share of employment in construction was low at 0.37 per cent.
Table 14: Share of employment in sub-sectors of industry, 2011
Number of Number of
Type of industry %
establishment employment
Mining & quarrying 178 2,036 0.37
Food, beverage and tobacco 32,257 84,008 15.16
Textile, wearing apparel and footwear 25,156 374,339 67.56
Wood, paper and printing 2,274 12,467 2.25
Chemical and medicines 159 9,814 1.77
Rubber, plastic, cement, metals and casting 2,910 20,014 3.61
Machinery components assemblies 4,740 15,643 2.82
Vehicle assemblies 104 1,895 0.34
Furniture and handicraft 3,031 10,492 1.89
Repairs 938 2,393 0.43
Electricity, water and waste collection 5,112 18,909 3.41
Construction 189 2,048 0.37
Total 77,048 554,058 100
Source: authors’ calculations based on EC2011 from NIS.
It is possible that the EC2011 suffers from underreporting on the number of workers employed by
enterprises. The estimation of industrial employment is only 550,000 comparing to 600,000
according to the 2008 population census 2008. Based on the CSES in 2010, the numbers
employed in industry should be at approximately 900,000 suggesting that there may be
establishments (most likely informal) that are not captured by EC2011. According to the CSESs,
4 Based on the same question on last year’s main occupation.and as revealed in Figure 4, the share of employment in TWF increased from around 20 per cent
in 1993 to a peak of 53 per cent in 2001. The drop in share in 1997 was due to a political conflict
that forced many garment factories to close. The share dropped to about 31 per cent in 2004
during discussions on the expiration of the MFA agreement that led to direct competition between
Cambodia and China. The share of employment in TWF reached 40 per cent again in 2010. The
FBT maintained a relatively stable share of employment of around 20 per cent from 1993 to 2001.
The share dropped in 2004 and 2007 but increased again in 2008 around the time of the
international food price increases. However, the share dropped back to around 10 per cent in
2010.
The share of employment in construction was around 20 per cent in 1993 and reached 25 per cent
in 2010. It should be noted that employment in construction is seasonal in nature which is one
possible reason why EC2011 under-reports the number of construction workers. Most
employment in construction is project-based and so does not involve a permanent and secure job
in a particular establishment. The estimate of permanent employment in the population census in
1998 and the population census in 2008 is 22 per cent and 24 per cent, respectively.
Figure 4: Share of the manufacturing sector
FBT TWF Construction
60% 52% 53%
46%
50%
39% 39%
40% 33% 35%
32%
29%
26%
30%
20% 26% 25%
23% 19% 19% 23% 21% 23%
20% 20% 18% 21% 20%
18% 18% 16%
18% 14%
10% 17%
14% 14% 13% 11%
0%
1993 1996 1997 1999 2000 2001 2004 2007 2008 2009 2010
Source: authors’ calculations based on CSESs in 1993, 1996, 1997, 1999, 2004, 2008, 2009, and 2010
and Labour Force Surveys in 2000 and 2001 from NIS6.
3.4 Age of firms
The oldest possible establishments in Cambodia are those that were established in 1979 after the
Khmer Rouge regime. About 55 per cent of industrial establishments have operated for five years
or less. The proportion by sub-sectors is illustrated in Table 15.
As illustrated in Table 16, the age of industrial firms represented in ICS2003 is similar to that of
EC2011 from which we exclude micro establishments to be comparable. In 2003, 43.6 per cent of
industrial firms had been established for five years or less, compared to 52.40 per cent in EC2011.
The share of establishments which survived more than 20 years in EC2011 is 8.63 per cent which
is higher than the 1.16 per cent of firms in ICS2003. This is not surprising given the eight year
difference between the two periods.
6 This estimate of employment is based on short-term employment by asking respondents about the type of
employment they were engaged in within last week.Table 15: Number of establishments by sub-sector and age group, 2011
0–5 6–10 11–20 20+
All years years years years
Mining & quarrying 177 97 26 33 21
Food, beverage and tobacco 31,891 17,384 6,667 5,613 2,227
Textile, wearing apparel and footwear 24,872 14,207 3,826 3,881 2,958
Wood, paper and printing 2,250 944 313 465 528
Chemical and medicines 155 82 30 33 10
Rubber, plastic, cement, metals and casting 2,867 1,411 555 581 320
Machinery components assemblies 4,684 2,673 797 787 427
Vehicle assemblies 101 51 23 19 8
Furniture and handicraft 2,993 1,590 588 648 167
Repairs 924 560 152 159 53
Electricity, water and waste collection 5,049 3,063 943 841 202
Construction 187 101 36 41 9
Total 76,150 42,163 13,956 13,101 6,930
Source: authors’ calculations based on EC2011 from NIS.
Table 16: Age of firms, in %
Employment 5 or more All
ICS2003 EC2011 EC2011
0–5 years 43.6 52.40 55.37
6–10 years 34.3 18.74 18.33
11–20 years 20.93 20.24 17.20
20+ years 1.16 8.63 9.10
Total sample 177 6943 76,150
Source: authors’ calculations based on ICS2003 and EC2011 from NIS.
3.5 Spatial distribution
Phnom Penh, Takeo, and Kampong Cham have the most industrial establishments of all
provinces. Takeo, however, is dominated by micro establishments. The number of establishments
correlates with the provincial population density. The provinces with low population density, such
as Mondolkiri, Kratie, Ratanakiri and Stung Treng, have the fewest establishments. Kampong
Cham Province has a medium level of industrial development. It has a large fertile area of rubber
and other crop plantations and the Mekong River flows through it. It is located 156 kilometers
northeast of Phnom Penh.
The spatial distribution by firm size is presented in Figure 5 and shows that larger firms tend to
locate in Phnom Penh and Kandal which circles Phnom Penh. Phnom Penh is a cluster for
industrial establishments of all sizes. This is likely due to the availability of infrastructure
including road, electricity, water supply, qualified human resources and better access to public
services, which make Phnom Penh and its surrounding provinces more favourable places to
locate.Considering the two most important sub-sectors, FBT and TWF, Figure 6 reveals that 40 per cent
of establishments of medium and large FBT establishments are in Phnom Penh. The next three
provinces of importance are, Kampong Cham, Battambang, and Kandal which have a share of 14,
10, and 9 per cent, respectively. Kampong Cham is rich with tobacco and rice millers while
Battambang is a rice basket of Cambodia. Kandal circles Phnom Penh and benefits from its
proximity to Phnom Penh. It is also a province that is rich with fish. It is likely that the location of
establishments in the FBT sub-sector is dependent on the availability of agricultural inputs in the
respective province.
Figure 5: Provincial spatial distribution of firms in the manufacturing sector by firm size
Micro Small Medium Large
Banteay Meanchaey Battambang Kampong Cham Kampong Chnang Kampong Speu
Kampong Thom Kampot Kandal Koh Kong Kratie
Mondul Kiri Phnom Penh Preah Vihear Prey Veng Pursat
Ratana Kiri Siem Reap Sihanuk Vill Stung Treng Svay Rieng
Takeo Oddar Meanchey Kep Pailin
Source: authors’ calculations based on EC2011 from NIS.
Figure 6: Spatial distribution of medium and large firms in FBT (left) and TWF (right)
Svay Rieng
Banteay Prey Pursat Siem Reap
Meanchaey 0% 2%
1% Takeo 2%
Veng
Sihanuk Vill
6% 1% 1%
Sihanuk Vill Svay
Phnom
Battambang 1% Rieng
Siem Reap Penh
10% 1%
7% Kamong 61% Takeo
Cham Banteay
14% 3%
Prey Veng Meanchaey
Battamban
2% Kampong 2%
Kamong g
Chnang
2% 1%
Cham Kampong
Kampong 2% Chnang
Speu Kampong 2%
3%
Phnom Penh Thom
40% Kandal Kampot
2% 1%
9% Kampong
Koh Kong Kandal Kampot
1% Speu
20% 1%
2%
Source: authors’ calculations based on EC2011 from NIS.
61 percent of the medium and large TWF establishments are in Phnom Penh, and 20 per cent of
them are in Kandal. This sector is relatively new to Cambodia. As a result establishments have
decided not to locate far from Phnom Penh. This may be due to a number of factors. First, during
the early establishment of these factories in 1994, security was an issue in Cambodia and Phnom
Penh was considered the safest place to locate. Second, infrastructure was in bad condition in
other parts of the country. Third, electricity was only available in Phnom Penh. Fourth, public
service was mainly available in the capital city. There has been some increase in the location of
firms in provinces that are close to Phnom Penh including Kandal, Kampong Speu, and Kampong
Chnang. It should be noted that Svay Rieng, Sihanoukville and Koh Kong are new productionbases for medium and large establishments due to the establishments of special economic zones in
these provinces. These provinces are located along land and sea borders which facilitates
exporting.
3.6 Ownership
The ownership structure of industrial establishments in Cambodia varies by size of establishment
and sub-sector as revealed in Figure 7. Figure 8 disaggregates ownership by nationality for FBT
and TWF. Almost all micro and small industrial establishments are owned by Cambodians while
only 37 per cent of large industrial establishments are. This is compared with 47 per cent owned
by Chinese and 12.5 per cent owned by Korean and other Asian nationalities. Only 13.5 per cent
of employees of micro establishments are under foreign ownership while 44.76 per cent of
employment of large establishment are under foreign ownership. Cambodians own about 90 per
cent of medium and large industrial establishments for FTB but only 41 per cent of TWF
establishments which is dominated by Chinese (48 per cent). This suggests that Cambodian
ownership remains strong in traditional sectors, but does not have enough vigor to jump into new
industries. In the TWF sub-sector, FDI from China has contributed significantly to growth of the
sector.
Figure 7: Foreign ownership by size and industrial type
Electricity, water
Repairs and waste Mining &
Furniture and
Large handicraft
4.97 4.44 quarrying
Medium Construction 2.15
44.76 10.08
Vehicle
7.12 assemblies 0
0.13 Food, beverage
Machinery and tobacco
components 10.62
assemblies
6.05
Rubber, plastic,
cement, metals
and casting
4.17
Small Chemical and
13.58 medicines
0.67
Textile, wearing
Micro Wood, paper and apparel and
printing footwear
34.54 4.57 49.73
Source: authors’ calculations based on EC2011 from NIS.
By age of firm, more than 62.5 per cent of foreign firms were established within five years. There
are only 21 foreign firms that have been established longer than twenty years. Among them, seven
are in machinery component assembly, five in FBT and three are in TWA. Most foreign firms are
located in Phnom Penh and its surrounding areas.Figure 8: Ownership of medium and large industrial establishments in TWF and FTB by nationality
100%
4
80%
253
60%
107
40%
20% 218
0%
TWF FTB
Cambodian Chinese
Korean Vietnamese
Other Asian Countries American and European
Source: authors’ calculations based on EC2011 from NIS.
3.7 Sunset and sunrise industries
According to the World Bank (2009: 18), forestry and fisheries sectors accounted for 19 per cent
of GDP growth in 1993–98 but only 2 per cent in 2003–08. Forest production accounted for 43
per cent of exports in 1994 and less than 1 per cent in 2006. Out of concern for the rapid
degradation of forest resources and fish stocks, the government banned logging in 2000 and
reformed large commercial fishing lots in 2002. The concept of community approach to forestry
and fishing has been promoted since then. These two sectors which thrived in the 1990s became
sunset industries in the 2000s.
As these sectors have declined in importance there are many sectors that are expected to grow in
the coming years. Of these, the most significant are expected to be tourism, garments, banking,
rice processing, and rubber processing.
The tourism sector in Cambodia has been growing at a steady and exponential rate in the last
decade and has become the second largest income source for the Cambodian economy, after the
garment sector (Kim and Tong 2010). The development of this sector is mainly driven by political
stability, World Heritage monuments, especially Angkor Wat, improved tourism infrastructure,
close proximity to tourism hubs, and the government’s policies on tourism, most notably the
Open Sky Policy. The number of international tourists has gradually increased from less than
118,183 in 1993 to over three million in 2012. This is expected to reach over four million in 2013
(Ministry of Tourism 2012).
The garment sector has also experienced significant growth in the last number of years as has
been illustrated by the growth of the TWF sector documented in the analysis presented above.
Accoding to the Garment Manufacturing Association in Cambodia (2011), the number of garment
factories in Cambodia increased from just seven in 1994 to about 300 employing 314,784 workers
in 2011. It is worth noting that Cambodia has not yet reaped the full benefits from growth in this
sector since inputs are mostly imported from other countries and the most activities involve
merely cutting and making yarns and fabrics into finished products where value added and profit
margins are relatively low. Domestic supply of such inputs would not only result in more jobs and
value addition for the economy but would also help make Cambodian garment products morecompetitive. According to Economic Institute of Cambodia (2009), the garment factories in Cambodia focused on ‘cut, make, and trim’—the lowest end of the garment value chain—while most of the new materials and accessories are imported from China, Hong Kong, and Taiwan. However, the garment sector has contributed to employment generation for young female workers from rural areas, in particular. Based on a few examples from small sample surveys of garment workers, more than 90 per cent of garment workers remit home with the average annual amount ranging from US$246 in 2007 (Cambodia Development Resource Institute 2007) to US$508 in 2009 (Luch 2009). The amount of remittances is 29 per cent of salaries earned in 2007 (CDRI 2007) and 40 per cent of the salaries in 2009 (Yagura 2011). In Luch (2009), the amount of remittances from garment workers is estimated at 33 per cent and 44 per cent of household income in 2007 and 2009, respectively. 40 percent of remittances are used for food consumption and 20 per cent for the purchase of productive assets (CDRI 2007). It is clear that while the sector has not benefited the economy to the extent that it could, it plays an important role in employment generation and the well-being of the rural poor throughout Cambodia. Up to 2005 Cambodia’s financial system was very underdeveloped compared with other countries at a comparable stage of development. The commercial banking sector has since caught up. Due to Cambodia’s relatively small GDP, commercial banking remains small in absolute terms. Lending by commercial banks and micro-finance institutes (MFIs) has risen even faster. Access to credit has increased and a few banks have expanded their branches, automatic teller machine, and consumer credit substantially. A larger number of banks have expanded credit for real estate development and construction. Development has been disrupted by the world financial crisis but commercial loans have begun to gradually grow again. According to National Bank of Cambodia (NBC) (2011: 17), there are 29 commercial banks, six specialized banks, two foreign-subsidiary offices, and 27 MFIs (of which six take deposits), and 28 rural credit operators in Cambodia. While the role of the banking sector in promoting growth remains small, and most of the growth achieved to date has been without bank finance (growth in credit has been largely directed to consumption, working capital, and real estate, see World Bank 2009: 14), there are signs that this sector will grow in the future. For example, as land titles are issued to farmers, it is expected that loans to farmers will increase dramatically as they can be used as conventional collateral. According to NBC (2010), solvency ratios were on average 31.4 per cent (NBC’s regulation requires that the solvency ratio is greater than 15 per cent of net worth); non-performing loans decreased from 6 per cent to 3 per cent between 2009 and 2010; and the liquidity ratio remained stable at 90.6 per cent. Total loans and advances to customers grew by 26.7 per cent while the number of borrowers increased by 7.5 per cent. The total amounts of deposits increased by 26.3 per cent while the number of depositors increased by 12.2 per cent from 968,472 to 1,067,404 depositors. Finally, the number of ATMs increased 35 per cent from 371 to 501 terminals nationwide. Rice production and processing has benefitted from trade preferences given by the EU to rice exported from Cambodia. In addition, the government further supported rice exports through the introduction of the (milled) rice export policy in 2010 to support the rice-processing industry which has a large paddy surplus but low rice exports. The official rice export figure in 2009 was only 15,500 tons with paddy production of 7,586,000 tons (Committee for Economic and Financial Policy 2011). This policy will bring benefits such as the promotion of local rice milling, employment, and other value added activities from the rice value chain. This government policy
is the first to be purely written by the Cambodian administration. The experience of the rice
export policy will be used as a model for other potential crops, notably rubber processing.

Land for rubber plantation and productivity have been increased due to increases in the world
demand for rubber. Importantly, Cambodia still has potential for an expansion in the amount of
land used for rubber plantation and up to now Cambodia has mainly exported raw rubber. Rubber
processing will be the most likely industry to be targeted by the government to follow the model
of rice export promotion. The total land area cultivated for rubber was 170,000 ha throughout the
country in 2010 (Hang 2010). Exports of rubber reached 40,583 tons in 2011 compared to 26,460
tons during the same period in 2010. The rubber is mainly exported to China, Vietnam, and
Malaysia.7 The cultivated land for rubber plantation was 181,454 ha in 2011.8 The overall
available acreage suitable for cultivation of rubber trees is estimated to be up to 350,000 ha and
this potential cultivated area will be expended further because some places which were not
previously considered as ideal for rubber production became suitable for rubber production. These
developments suggest that rubber processing will also be one of the sunrise industries in
Cambodia.

Table 17 compares the share of export and value added across the various sunset and sunrise
industries highlighted above. Based on export performance, the share of textiles in total exports
increased in the period of 2000–04 and 2005–07, but declined in the 2008–10 period. In the latest
period, Vegetable products, rubbers and food stuffs are rising in importance, primarily due to the
Everything but Arms (EBA) scheme that allows Cambodia to export agricultural goods to Europe
tariff-free. Footwear/headgear was also rising both in the 2005–06 and 2008–10 periods.

Export of raw hides, skins, leather, and furs, animal and animal products, plastics/rubbers and
wood and woods products are low performing sectors as measured by the reduction in their share
of total exports between 2000 and 2004. The export share of animal and animal products and
wood and wood products continued to drop during 2005–07. During 2008–10, textiles, metals and
stone/glass have also seen their share decline. The financial crisis hit the export of garments
strongly, particularly in 2009.

Overall, based on export performance between 2000 and 2010, textiles and footwear are among
the rising industries, while wood and wood products and animal and animal products are those in
the sunset industries.

7 OSK, Cambodia investment research daily news, dated on 22 December 2011.
8 Based on http://businessnewscambodia.com/2011/08/rubber-prices-increasing/
You can also read