Lao PDR Economic Monitor - Supporting Economic Recovery Thematic section: Livelihoods in the Time of COVID-19 - Pubdocs.worldbank.org.
←
→
Page content transcription
If your browser does not render page correctly, please read the page content below
Lao PDR
Economic Monitor
Supporting Economic Recovery

Thematic section:
Livelihoods in the Time of COVID-19
January 2021
Macroeconomics, Trade and Investment Global Practice
East Asia and Pacific Region

Acknowledgements

The Lao PDR Economic Monitor January 2021 was prepared by a team comprising Fang Guo
(co-Task Team Leader, Economist), Somneuk Davading (co-Task Team Leader, Senior Economist),
Tanida Arayavechkit (Economist, Poverty), Keomanivone Phimmahasay (Economist) and Chandana
Kularatne (Senior Country Economist) ; with inputs and comments from Ekaterine T. Vashakmadze
(Senior Country Economist), Ergys Islamaj (Senior Economist), Duong Trung Le (Research Analyst),
Vera Vencheva Kehayoya (Consultant), Michael Corlett (Senior Financial Sector Specialist), Vidaovanh
Phounvixay (Financial Sector Analyst), Melise Jaud (Senior Economist), Konesawang Nghardsaysone
(Economist), Khampao Nanthavong (Private Sector Specialist), Shinya Nishimura (Senior Financial
Specialist), Melania Lotti (Analyst), Elena Georgieva-Andonovska (Senior Public Sector Management
Specialist), Viengmala Phomsengsavanh (Public Sector Specialist), Andre Proite (Senior Debt
Specialist), Francesca Lamanna (Senior Economist), Sandor Karacsony (Senior Economist), Nicholas
Keyes (Senior External Affairs Officer), and Alounny Vorachakdaovy (Consultant).

This report comprises two parts: Part I: Recent Economic Developments and Outlook, and Part II:
Livelihoods in the Time of COVID-19. The team worked under the guidance of Mariam Sherman
(Country Director), Deepak Mishra (Practice Manager), Nicola Pontara (Country Manager), Rinku
Murgai (Practice Manager, Poverty), and Hans Anand Beck (Program Leader). We gratefully
acknowledge the production and dissemination assistance provided by Boualamphan Phouthavisouk
(Team Assistant) and Aiden Glendinning (External Affairs Officer).

The team would like to express its gratitude to the Government of the Lao PDR, particularly the
Ministry of Finance, Bank of the Lao PDR, Ministry of Planning and Investment, Ministry of Industry
and Commerce, Ministry of Energy and Mines, other line ministries, and representatives of the Lao
National Chamber of Commerce and a number of companies and banks for sharing their valuable
views and input.

The Lao PDR Economic Monitor provides updates on macroeconomic developments and sectoral
issues in the country. It is produced biannually and distributed widely to government agencies,
development partners, the private sector, think tanks, civil society organizations, and academia.

The findings and interpretations expressed here are those of the authors and do not necessarily
reflect the views of the World Bank Group, its Executive Directors, or the countries they represent.

For inclusion on the email distribution list, please contact Boualamphan Phouthavisouk:
bphouthavisouk@worldbank.org.

                                                                            Lao PDR Economic Monitor   i
Abbreviations

   BCEL		           Banque Pour Le Commerce Exterieur Lao Public
   BoL		            Bank of the Lao PDR
   COVID-19         Coronavirus disease 2019
   EDL		            Electricité du Laos
   EMDEs		          Emerging Market and Developing Economies
   FDI 		           Foreign direct investment
   GoL		            Government of the Lao PDR
   GSP		            Generalized System of Preferences
   ICBC		           Industrial and Commercial Bank of China
   MoF		            Ministry of Finance
   MOIC		           Ministry of Industry and Commerce
   NC		             Non-concessional
   NPV		            Net present value
   PBOC		           People’s Bank of China
   PMI		            Purchasing Managers’ Index
   RCEP		           Regional Comprehensive Economic Partnership
   TESDA		          Technical Education and Skills Development Authority
   UNDESA		         United Nations Department of Economic and Social Affairs
   yoy		            year-on-year

   All dollar ($) amounts are US dollars unless otherwise indicated

ii Lao PDR Economic Monitor

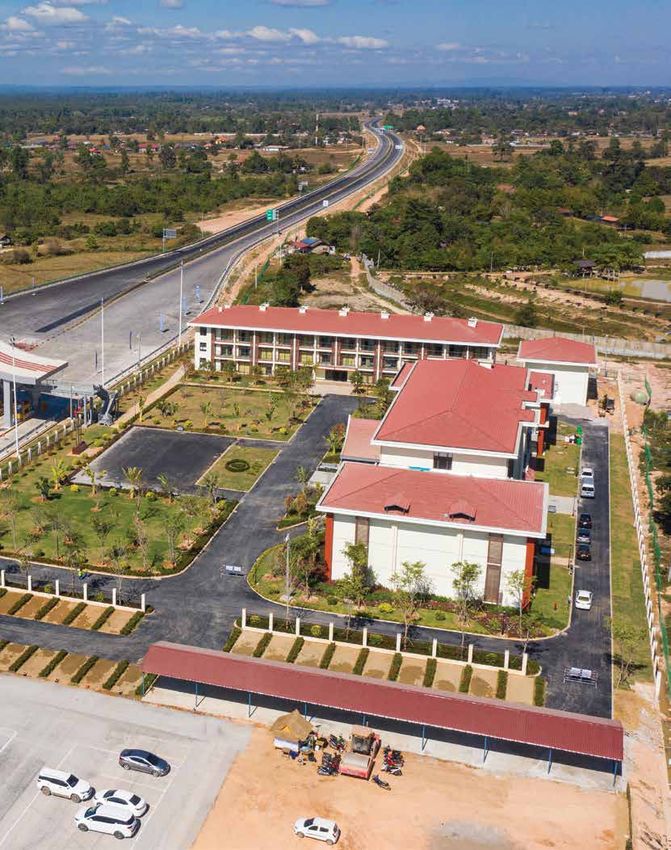
Photo: Phoonsab Thevongsa
Contents

     Acknowledgements ................................................................................................................................................................                          i
     Abbreviations ..............................................................................................................................................................................              ii
     Executive Summary ....................................................................................................................................................                                   10
           Lao PDR: Key Macroeconomic Indicators at a Glance ....................................................................................                                                             15
     A. Recent Economic Development ..........................................................................................................                                                                17
           I. Global Economic Developments ...................................................................................................................                                                18
           II. The Real Sector ..........................................................................................................................................................                     19
           The COVID-19 outbreak has turned the slowdown into a recession ...................................................                                                                                 19
           Agricultural growth, despite export market disruption, has been positive .....................................                                                                                     20
           Disruption of supply chains and weakening global demand have affected industry .......................                                                                                             20
           Behavioral change among consumers alters demand for services .........................................................                                                                             21
           The pandemic threatens to reverse gains made in poverty reduction ...............................................                                                                                  23
           III. The External Sector .............................................................................................................................................                             25
           The pandemic has led to a further widening of the current account deficit ...................................                                                                                      25
           Pandemic-linked supply chain disruptions may cause a decline in trade volumes .............................                                                                                        26
           In the foreign exchange market, the spread remains large ........................................................................                                                                  28
           New measures have been introduced by BoL to control exchange bureau operations ................                                                                                                    29
           FDI inflows have been relatively resilient .............................................................................................................                                           29
           IV. Inflation and the Financial Sector .............................................................................................................                                               31
           Headline inflation has remained high in recent months ..............................................................................                                                               31
           Monetizing of the deficit has led to a significant increase in money supply ...................................                                                                                    32
           V. Fiscal Developments ............................................................................................................................................                                34
           Low domestic revenue mobilization has been exacerbated by the economic slowdown ..........                                                                                                         34
           Growing difficulties in meeting debt service payments ................................................................................                                                             35
           VI. Debt Dynamics ........................................................................................................................................................                         37
           VII. Outlook and Risks ................................................................................................................................................                            41
           Outlook ...................................................................................................................................................................................        41
           Risks ..........................................................................................................................................................................................   43
     B. Thematic Section: Livelihoods in the Time of COVID-19 ...........................................                                                                                                     45

IV   Lao PDR Economic Monitor
FIGURES

Figure 1. Latest GDP growth data in selected countries ......................................................................................                       18
Figure 2. New export order sub-index of Purchasing Managers’ Index (PMI) ........................................                                                   18
Figure 3. Baseline and downside growth scenarios ..............................................................................................                     19
Figure 4: Expected real GDP growth at market prices in 2020 ........................................................................                                19
Figure 5. Real GDP growth and its contributors .......................................................................................................              20
Figure 6. Tourist arrivals has dropped sharply .........................................................................................................            22
Figure 7. …with the biggest drops from Thailand, Vietnam and China ......................................................                                           22
Figure 8. Air traffic into Vientiane airport is limited .............................................................................................               23
Figure 9. Internet search interest plummeted .........................................................................................................              23
Figure 10. Returning migrants’ interest in vocational training .......................................................................                              23
Figure 11. The current account deficit is expected to widen in 2020 .........................................................                                       25
Figure 12. Trade deficit has narrowed ...........................................................................................................................   26
Figure 13. Export performance among region peers .............................................................................................                      26
Figure 14. Exports by products to 3 countries ..........................................................................................................            27
Figure 15. Imports by products to 3 countries .........................................................................................................             27
Figure 16. Parallel market premium of Kip/$ and Kip/Baht .............................................................................                              28
Figure 17. Kip/$ spread remains high ..........................................................................................................................     28
Figure 18: Changes in real effective exchange rate ................................................................................................                 29
Figure 19. FDI grew by 24 percent in Q1-Q3 2020 and mainly flew to infrastructure sector ...........                                                                30
Figure 20. FDI inflows rose in Q1 2020 .........................................................................................................................    30
Figure 21: Capital flows exposure in EAP region ......................................................................................................              30
Figure 22. Headline inflation has fallen from recent high ..................................................................................                        31
Figure 23. Inflation comparison among regional peers ......................................................................................                         31
Figure 24. Money supply and monetary base growth ..........................................................................................                         32
Figure 25. Credit growth in the public and private sectors ..............................................................................                           32
Figure 26. Credit to the private sector slows in Q3 2020 ...................................................................................                        33
Figure 27. Baseline and downside fiscal deficit scenarios .................................................................................                         34

                                                                                                                                  Lao PDR Economic Monitor               V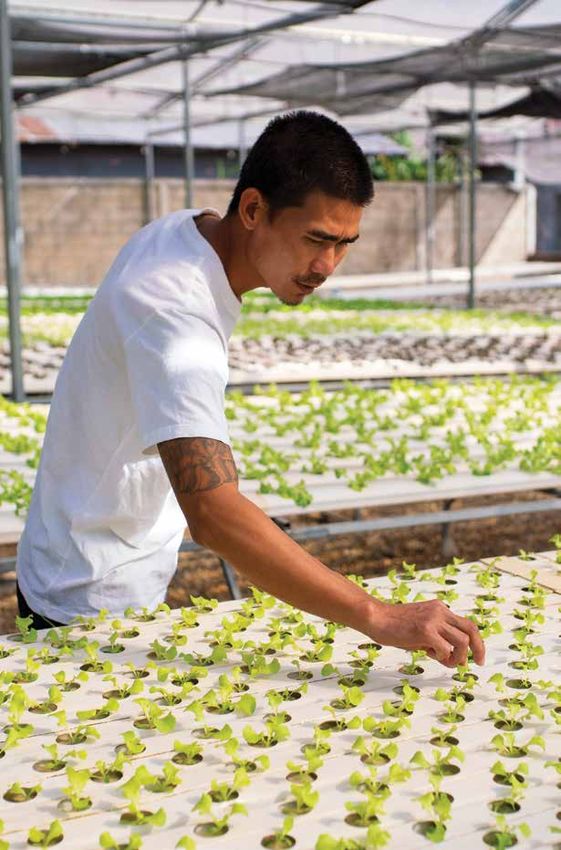
Contents

     Figure 28. Baseline and downside public debt scenarios ..................................................................................                                                             35
     Figure 29. Government external debt by concessionality, creditor and instrument, 2019 ...............                                                                                                 37
     Figure 30. Amortization of govt. external debt by concessionality, creditor and instrument,
                      2020 .............................................................................................................................................................................   37
     Figure 31. Cost of borrowing by concessionality, creditor and instrument, 2020 .................................                                                                                      38
     Figure 32. EDL’s Forecast Principal and Interest Payments for 2019-2038 .............................................                                                                                 38
     Figure 33. Public sector external debt servicing is around $ 1.1 billion per year
                       during 2021-25 ...................................................................................................................................................                  39
     Figure 34. with concessional debt ratio expected to also rise ........................................................................                                                                39
     Figure 35. Global growth by year ....................................................................................................................................                                 41
     Figure 36. Level of output relative to January 2020 projections .....................................................................                                                                 41
     Figure 37: Employment status in June–July 2020 (percent of pre-pandemic employment) .............                                                                                                     47
     Figure 38: Change in income between March and June–July 2020
                       (percent of non-farm workers who remained in the same job) .............................................                                                                            47
     Figure 39: Nonfarm source of livelihood and job loss in June–July 2020 .................................................                                                                              48
     Figure 40: Informality and job loss of the non-farm sectors ............................................................................                                                              49
     Figure 41: Family business revenue status in June–July 2020 relative to pre-pandemic levels .....                                                                                                     51
     Figure 42: Percentage of households affected by rising food prices .............................................................                                                                      53
     Figure 43: Behavioral adjustments to rising food prices (% of affected households) ..............................                                                                                     53
     Figure 44: Remittances as a source of household livelihoods ........................................................................                                                                  55
     Figure 45: Share of (international) remittance-receiving households by province ...............................                                                                                       55
     Figure 46: Gaps in social security ......................................................................................................................................                             56

VI   Lao PDR Economic Monitor
TABLES
Table 1. Regional comparisons of Financial Soundness Indicators                                                         ..............................................................   33
Table 2. Lao PDR: Government budgetary operations, Jan-Nov 2020 .........................................................                                                                35
Table 3. Interest rates for bond issuance ...................................................................................................................                            40
Table 4. Economic Outlook Indicators ..........................................................................................................................                          43

BOXES
Box 1: Lao PDR could benefit significantly from the Regional Comprehensive
           Economic Partnership .............................................................................................................................................            27
Box 2: The government explains the rising debt burden ...................................................................................                                                36

                                                                                                                                               Lao PDR Economic Monitor                       VII
Executive Summary
    The COVID-19 outbreak has intensified the growth slowdown, plunging Lao PDR’s economy into
    its first recession since the Asian financial crisis in 1998. The World Bank estimates that Lao PDR’s
    growth will decline drastically in 2020 to −0.6 percent. The pandemic has mainly affected labor-
    intensive service sectors and those linked to global and regional value chains, having an especially
    negative effect on tourism-related services, wholesale and retail trade, and manufacturing. It has
    affected livelihoods and poses a serious risk to Lao PDR’s progress on poverty reduction. The pov-
    erty rate (measured as $3.2 a day, 2011 PPP) is expected to increase by at least 1.7 percentage
    points in 2020, as compared with a non-COVID-19 scenario. The sharp drop in domestic revenue
    mobilization has led to worsening of the fiscal situation and a growing debt problem. Under the
    baseline scenario, Lao PDR’s GDP growth rate is projected to rise to 4.9 percent in 2021, assuming
    that the domestic spread of the virus is brought under control, that the government’s small but
    targeted COVID-19 fiscal support measures are implemented effectively, and that there are no
    new interruptions to the global economy recovery. The anticipated recovery will be supported by
    investment in infrastructure, and growth in services, exports, and private consumption. However,
    risks are tilted heavily to the downside, as unpredictable evolution of the pandemic and therefore
    its threats to macroeconomic stability could delay the resumption of regular economic activity.
    Under the downside scenario, which assumes some of these risks are realized, the growth rate is
    estimated to rebound to only 2.8 percent in 2021.

    Recent Developments
    The global economy is expected to slide into its deepest recession since the World War II. Global
    activity has begun to rebound following a gradual relaxation of lockdown measures. However, the
    renewed spread of COVID-19 in some regions of the world is weighing on the nascent recovery.
    Global output is projected to contract by 5.2 percent in 2020, despite unprecedented policy
    support. Countries in East Asia, with some exceptions, have contained the disease well by acting early
    and decisively. They have used a combination of mobility restrictions, testing-based strategies, and
    information programs to encourage precautionary behavior. Nevertheless, the pandemic is likely
    to have long-lasting impacts on multiple areas of economic activity, including lower investment and
    innovation, erosion of human capital, and retreat of global trade and supply chains.

    It is estimated that Lao PDR’s GDP growth will decline to −0.6 percent in 2020, as all sectors
    experience adverse effects of varying intensity. The service sector has been hardest hit, due to
    lockdown measures and the decline in travel and tourism. Supply chain disruptions have negatively
    affected industry, especially manufacturing, while the agriculture sector has stayed resilient despite
    COVID-19 related disruptions and is expected to grow by 2 percent in 2020, up from −0.9 percent in
    2019, supported by forestry and wood pulp exports. Service sector output is expected to contract
    by 4.5 percent in 2020, down from an expansion of 6.7 percent in 2019, as precautionary behavior
    and travel bans negatively affect tourism-related services and transportation. Cautious spending
    patterns and weakened supply chains are slowing wholesale and retail growth but the information
    and communication sector has been less exposed to the direct effects of the pandemic. Industrial
    production growth is expected to decline to 2.9 percent in 2020, down from 4.7 percent in 2019,
    following contraction in mining and manufacturing activities.

10 Lao PDR Economic Monitor
Photo: Phoonsab Thevongsa
The current account deficit is expected to increase in 2020 because of the sharp decline in tourism
activities, overflight fees,1 remittances, and higher debt service obligations, despite an improved
trade balance. The current account deficit is expected to increase to 11.3 percent of GDP in 2020
from 8 percent in 2019. Over the first nine months of 2020, imports dropped by 10.2 percent
compared to the same period of 2019, while exports fell by 0.5 percent. COVID-19 is negatively affecting
tourism-related activities and is expected to reduce tourism income by more than $500 million in
2020. At the same time, remittances are projected to decline by about 50 percent (or $100 million)
in 2020. With a low foreign currency reserve buffer, the country faces heightened balance of pay-
ment pressures and difficulties in meeting external debt obligations.
Pressure on the Lao kip remains high. In the foreign exchange market, the gap between the official
exchange rate and the rate quoted by exchange bureaus remains large, reaching 9.1 percent in the
second week of December 2020. This was slightly down from a peak of 9.7 percent at the end of
July, following stricter controls on the parallel foreign exchange market and depreciation of the US
dollar against major currencies.
1 Lao PDR receives overflights fees of around $100 million annually from various airlines. However, overflight fees
are expected to reach only about $10 million in 2020 due to the limited number of international flights caused by the
pandemic.
Lao PDR Economic Monitor 11Headline inflation has moderated in recent months but remains high because of rising food prices
and kip depreciation. Although headline inflation declined from a peak of 6.9 percent in January
2020 to about 2.8 percent in November, it remains high, averaging 5.3 percent over the first eleven
months of 2020. Food inflation has been the main driver, increasing by an average of 4.1 percent in
the first eleven months of 2020, compared with an average of 1.9 percent over the same period in
2019. The depreciation of the kip in the parallel market has also played a significant role in stoking
inflation.
The government is facing unprecedented fiscal challenges. Revenue collection over the first eleven
months of 2020 was disappointing, at 76.9 percent of the revised budget and 62.4 percent of the
original budget. The government has spent 22.5 trillion kip over the past eleven months, which is
68.3 percent of the revised budget and 63.2 percent of the original budget. If the expenditure plan
is maintained and there is no further build up in arrears, the fiscal deficit is projected to increase to
7.6 percent of GDP in 2020, from an estimated 5.1 percent of GDP in 2019. Because of lags between
recorded capital expenditure and actual capital expenditure, and in payment of salaries and wages,
World Bank estimates for the fiscal deficit have been consistently above the Government of the Lao
PDR (GoL) number. The deficit is being financed through external borrowing, T-bonds and T-bills,
and borrowing from domestic and foreign commercial banks (foreign branches in Lao PDR).
Exacerbated by the pandemic, Lao PDR’s structural vulnerabilities have led to a significant
increase in the public debt burden and difficulties in servicing debt. Public debt is expected to
increase to at least 69 percent of GDP in 2020, up from 59 percent in 2019. Rising debt levels and
increasing proportion of less concessional debt have significantly increased external debt-service
payments, which stood at $1.2 billion for 2020. The weak fiscal framework, a low foreign currency
reserve buffer, and limited financing opportunities following sovereign rating downgrades by
Moody’s Investor Services in August 2020 and by Fitch Ratings in September 2020, have led to
significant difficulties in meeting debt service obligations.
Economic Outlook and Risks
Under the baseline scenario, growth in 2021 is expected to rebound to 4.9 percent, up from
−0.6 percent in 2020. Despite economic contraction caused by the pandemic in 2020, growth is
projected to gradually recover in the medium term on the back of infrastructure investment allied with
growth of services, exports, and private consumption. Infrastructure includes two major transport
projects, the China-Laos Railway — expected to commence commercial operations in 2021 — and
the Vientiane-Vang Vieng Expressway, which opened in December 2020. Service sector activity is
likely to be boosted by increasing demand. Export activities will be positively affected by China
recovery and its offering the Generalized System of Preferences (GSP) for 97 percent of Lao export
products and by the signing of the Regional Comprehensive Economic Partnership (RCEP). Private
consumption is expected to resume with economic recovery.
Downside risks challenge the growth outlook. Under the downside scenario, the 2021 growth rate
is estimated at only 2.8 percent. Key downside risks include a prolonged COVID-19 outbreak, delays
in rolling out the vaccines, a more sluggish recovery in Lao PDR’s key trading partners, heightened
difficulties in meeting external public debt-service obligations, adverse weather-related events, and
financial sector vulnerabilities. Rising food prices and job uncertainty for the poor and vulnerable
are also major risks.
12 Lao PDR Economic MonitorThematic Section: Livelihoods in the Time of COVID-19
The COVID-19 pandemic and its containment measures have affected livelihoods in Lao PDR. While
efforts to contain the pandemic have been largely successful, the negative impacts of the lockdown
have lingered. The poverty rate (measured as $3.20 a day, 2011 PPP) is expected to increase by at
least 1.7 percentage points in 2020, as compared with a non-COVID-19 scenario.
A decline in trading volumes and tourism have put thousands of jobs at risk, threatening
livelihoods. Lao PDR’s labor market was weak at the onset of the pandemic, with vulnerable
households short of livelihood diversification opportunities. The pandemic and the effects of the
lockdown have resulted in employment and income losses. With international borders closed,
the hospitality and transportation sectors have witnessed extensive job losses. Declining foreign
and domestic demand battered the construction and manufacturing sectors, in which one-third of
workers lost their jobs by July 2020. This negative economic impact has disproportionately affected
informal workers, who lack social protection. The livelihoods of farming households have been only
moderately affected by the pandemic, but weather-related shocks have posed a significant risk to
farming activities.
Rising food prices have exacerbated food insecurity. Food and nutrition insecurity is a pressing
problem, especially among low-income households and non Lao-Tai ethnic groups. Soaring
inflation has eroded households’ purchasing power and welfare, with rising food prices increasing
food insecurity among the poorest, particularly the urban poor.
Photo: Phoonsab Thevongsa
Lao PDR Economic Monitor 13As remittances declined, some households have lost their main source of livelihoods while others
have seen one of their coping strategies disappear. For many Lao people, remittances represent
a main source of income and their sharp drop during the pandemic has created a significant
challenge. This negative impact has been most pronounced for rural households in central and
southern Laos. Restoration of international remittances is expected to be slow.
The COVID-19 pandemic has exposed gaps in the social safety net. In response to the pandemic,
the government enacted several measures to protect those whose livelihoods were affected.
However, the social protection system coverage is limited and lacks the capacity to sufficiently
respond to the scale of the pandemic. Coverage of social assistance programs remains low and is
insufficient to safeguard the livelihoods of those households severely affected by the pandemic.
Policy options to safeguard the livelihoods of the most vulnerable during the pandemic include
expanding coverage of cash and in-kind food transfers, facilitating transport of agricultural inputs
and outputs, and promoting skill development for laid-off workers and returning migrants.
Photo: Phoonsab Thevongsa
14 Lao PDR Economic MonitorLao PDR: Key Macroeconomic Indicators at a Glance
Real GDP growth and its contributors Tourist arrivals have dropped sharply
(percentage point) (LHS: arrival number; RHS: yoy change)
Sources: Lao Statistics Bureau, World Bank staff estimates. Sources: Lao Tourism Office
Trade deficit has narrowed Kip/$ spread remains high
(million $) (LHS: exchange rate; RHS: percent)
Sources: DOTS, IMF Sources: IMF International Financial Statistics, CEIC database
Headline inflation has fallen from recent Baseline and downside public debt
high (percentage) scenarios (% of GDP)
Sources: Lao Statistics Bureau Sources: MoF, World Bank staff estimates.
Note: 2020PE – Preliminary estimate for 2020
Lao PDR Economic Monitor 15A.
Recent Economic Development
Photo: Phoonsab ThevongsaGlobal Economic Developments
Global activity has begun to rebound following a gradual relaxation of lockdown measures.
However, the accelerating spread of COVID-19 in some regions is weighing negatively on economic
recovery. Global output is set to contract sharply in 2020, at nearly three times the contraction rate
experienced in 2009 during the global financial crisis, which was the deepest recession since World
War II (World Bank 2020). China continues to be a bright spot in the global economy (Figure 1) and
the global goods trade continues to recover, although trade in services is lagging. The manufacturing
of new export orders recovered to 51.7 points in September, compared with its nadir of 27.1 points
in April (Figure 2). International tourist arrivals in 2020 remain more than 90 percent below 2019’s
levels in many countries. The number of daily commercial flights in 2020 recovered to about half of
2019’s levels by early August, but showed no further increase in September and October.
Central banks around the world have aggressively eased monetary policy and provided liquidity
support to avoid shortages in credit markets. The Federal Reserve cut its policy rates to almost
zero. Capital outflows from emerging markets and developing economies (EMDEs), which at the
outset of the pandemic exceeded those during the worst period of the global financial crisis, have
subsided. Debt sustainability concerns are rising as sovereign credit ratings have continued to
deteriorate even though yields remain low. Commodity markets have been following diverging
trends. Oil prices fell nearly 7 percent in September before stabilizing in October, with the price of
Brent crude oil averaging $40 per barrel. Base metal prices, led by copper, continued to recover in
October and are now nearly 6 percent higher than their pre-pandemic peak in January. This increase
in prices has been supported by the strengthening of global economic activity, particularly in China.
Agricultural commodity prices increased by 6 percent in September and are now above their
January levels.
Figure 1. Latest GDP growth data in selected Figure 2. New export order sub-index of
countries (percent) Purchasing Managers’ Index (PMI) (index)
Sources: Haver Analytics.
A. Figures show quarter-on-quarter annualized growth rate for 2020Q2 for selected countries. Red bar indicates the 2020
Q3 quarter-on-quarter non-annualized growth rate for China.
B. Manufacturing and services are measured by PMI. PMI readings above 50 indicate expansion in economic activity;
readings below 50 indicate contraction. Last observation was September 2020.
18 Lao PDR Economic MonitorII. The Real Sector
The COVID-19 outbreak has turned the slowdown into a recession
The Lao economy is expected to register its slowest growth rate in three decades, with growth
estimated to decline dramatically to −0.6 percent in 2020 (Figure 3).2 The agricultural sector and
industry overall are estimated to grow moderately but the services sector has been severely affected
by the pandemic. Lao PDR has so far suffered less from the disease than many of its regional
peers, and the lockdown has been relatively mild. This, in addition to the fact that the economy is
less integrated with the rest of the world compared to some of its East Asian peers, means that Lao
PDR has experienced a relatively milder slowdown than some of its neighbors (Figure 4).
Figure 3. Baseline and downside growth sce- Figure 4: Expected real GDP growth at market
narios (percent) prices in 2020 (percent)
Sources: World Bank staff estimates. Sources: Global Economic Prospects, January 2021
Note: 2020PE – Preliminary estimate for 2020
The output effects of the pandemic have varied considerably across sectors. The agricultural sector
is estimated to grow by 2 percent in 2020, up from −0.9 percent in 2019, supported by forestry and
logging activities. While the agricultural sector has remained resilient despite COVID-19 related
disruptions, supply chain disturbances have negatively affected the performance of the
manufacturing sector (Figure 5). With a contraction in mining, due to lower ore quality and
availability, and export-oriented manufacturing activities partially offsetting robust growth in
electricity consumption and exports, overall industrial production is expected to grow by about 2.9
percent in 2020, compared with 4.7 percent in 2019. The service sector has been the hardest hit
by the lockdown measures and their resulting decline in travel and tourism. The sector is expected
to contract by about -4.5 percent in 2020, compared to growth of 6.7 percent in 2019. The
information and communication sector benefited from social distancing measures as more
people use internet and online facilities to communicate and run businesses, but cautious spending
patterns and weakened tourism related activities and supply chains are slowing the growth of the
wholesale and retail sectors.
2 The growth estimate is based on the fact that real economic performance during the first 9-10 months has
converged towards the baseline scenario, which assumes that the economy remains closed until Q3 2020 and will gradually
open in Q4, with external demand (especially from China, Thailand and Vietnam) gradually picking up from Q4 2020.
Lao PDR Economic Monitor 19Figure 5. Real GDP growth and its contributors
(percentage point)
Source: Lao Statistics Bureau, World Bank staff estimates.
Agricultural growth, despite export market disruption, has been positive
Despite export market disruption in the first half of 2020, the agricultural sector is expected to
grow by an estimated 2 percent in 2020, up from −0.9 percent in 2019. Forestry and logging, fishing,
crop, and livestock production are expected to rebound.3 This is partly helped by reduced imports
of food and closure of customary checkpoints due to the lockdown which has reduced competition
and facilitated local production. Forestry and logging are expected to grow by an estimated 7.5
percent in 2020, aided by strong external demand for wood and wood pulp. In the first eleven
months of 2020, wood pulp export grew by 15.2 percent from the same period last year. Fishing,
crop, and livestock production are expected to grow at 3.2 percent, 3 percent and 1.5 percent
respectively in 2020. The flooding experienced in Savannakhet and other southern provinces in
October had some negative impacts and moderated overall agricultural growth for 2020.
Disruption of supply chains and weakening global demand have affected industry
Industrial output is estimated to contract in 2020 due to a decline in manufacturing and mining
activities. The industrial sector’s growth rate will fall from 4.7 percent in 2019 to an estimated 2.9
percent in 2020, reflecting a sharp drop in mining and export-oriented manufacturing activities
(garments, electronics, cameras, plus their parts and accessories and other manufactured goods)
during the pandemic. Mining sector growth is expected to decline sharply from −2.4 percent in
2019, to −29.4 percent in 2020. This contraction reflects the production of lower-quality ore and
the termination of a major copper mine, which transitioned to a gold operation towards 2020.
Meanwhile the growth rate in textile manufacturing will fall from 2.5 percent in 2019, to an
estimated −21.2 percent in 2020. The decline in manufacturing activity is also reflected in low
import demand for cement, construction materials, iron, and steel (see section III).
3 Flooding and drought in various provinces resulted in a contraction in the agriculture sector in 2019.
20 Lao PDR Economic MonitorThe electricity sector is expected to grow in 2020, despite adverse weather conditions. The sector
is expected to grow by 33 percent in 2020, with electricity output and exports increasing due to the
contribution of new power projects, especially the four key plants, such as Xayaburi, Nam Ngiep 1,
Xe Pian — Xe Namnoy, and Don Sahong with a combined installed capacity of 2,245 MW. The country
should have a combined installed capacity of about 10 GW by the end of 2020. Lao PDR exports
almost 7,000 MW - of which almost 6,000 MW is exported to Thailand, 570 MW to Vietnam, 320
MW to Cambodia, and 10 MW to Myanmar. Another 100 MW goes to the ASEAN Grid via Thai-
land and Malaysia. Drought and erratic rainfall in 2019 resulted in insufficient water inflows and
caused actual power generation in the first half of 2020 to be lower than the set target. More robust
outputs and exports are expected in the second half of 2020 due to better rainfall. Electricity ex-
ports for the first nine months of 2020 increased by 17 percent and domestic sales by 31 percent.
Behavioral change among consumers alters demand for services
The service sector is estimated to have negative growth of about -4.5 percent in 2020, down from
6.7 percent in 2019, with the pandemic profoundly affecting the types of services consumed.
Activities involving transportation, hotels and restaurants, and entertainment have been adversely
affected by contagion fears and social-distancing measures. The accommodation and transportation
sectors are expected to contract by 39.9 percent and 23.4 percent respectively in 2020. In contrast,
the information and communication sector has continued to perform well, with estimated growth
of 28.8 percent in 2020. Cautious spending patterns and weakened supply chains are slowing the
growth of the wholesale and retail sector, which is expected to expand by 2.2 percent in 2020, down
from 8.7 percent in 2019. Increasingly cautious consumers appear to be prioritizing essential items
and delaying non-essential purchases.
Photo: Phoonsab Thevongsa
Lao PDR Economic Monitor 21The pandemic is having a deeply negative impact on travel- and tourism-related services, as travel
bans and precautionary behavior constrain activity in the sector. From January to September 2020,
Lao PDR saw a 74 percent year-on-year (yoy) decrease in total tourist arrivals.4 Within that same
period, arrivals from Asia and the Pacific saw the largest decline of 76 percent against the same
period last year. Arrivals from Europe, the Americas, Africa, and the Middle East also experienced
a large decline over the same period (Figure 6). Arrivals from the three largest sources—Thailand,
Vietnam and China—dropped by 77 percent, 73 percent and 82 percent respectively (yoy, Figure
7). Meanwhile, the number of domestic flights remained low in October (Figure 8). The downward
trend in internet search interest (Figure 9) corresponded to the decline in tourism-related earn-
ings from hotels, restaurants, rentals, overland transportation, and other services. Furthermore,
because of precautionary behavior, the transportation, hospitality, and tourism industries are
expected to recover more slowly than other sectors, even after pandemic-related restrictions have
been lifted. Tourism and hospitality operators have massively cut the cost of their services and package
tours to encourage domestic travel within Lao PDR. Special promotions are targeted at local visitors
in a bid to make up for the absence of foreign tourists during the pandemic.
Figure 6. Tourist arrivals have dropped sharply Figure 7. …with the biggest drops from
(LHS: arrival number; RHS: yoy change) Thailand, Vietnam and China
(LHS: arrival number; RHS: yoy change)
Source: Tourism Office Source: Tourism Office
Photo: Phoonsab Thevongsa
4 Some argue that the total tourist arrival number contains non-tourism purpose arrivals.
22 Lao PDR Economic MonitorFigure 8. Air traffic into Vientiane airport is Figure 9. Internet search interest plummeted
limited (scheduled flights to Vientiane airport) (index)
Source: https://www.flightradar24.com/data/airports/ Source: Mobility Data. Note: The numbers are a relative
vte/statistics representation of search interest relative to the highest
value on the graph for a particular region and time period.
A value of 100 indicates that the keyword is the most
popular, and a value of 50 indicates that the keyword is
half as popular. A value of 0 indicates that there was not
enough data for that keyword.
The pandemic threatens to reverse gains made in poverty reduction
The contraction in growth is adversely affecting poverty reduction efforts. The contraction in GDP
growth in 2020 has led to the unemployment rate reaching 25 percent in July 2020, up from 16
percent in 2018. With policy space highly constrained, the ability of the authorities to mitigate the
impact of COVID-19 is limited. More households are therefore at risk of slipping into poverty. The
poverty rate (measured as $3.2 a day, 2011 PPP) is expected to increase by at least 1.7 percentage
points in 2020, compared with a non-COVID-19 scenario.
Figure 10. Returning migrants’ interest in vocational training
Source: Lao People’s Democratic Republic Returning Migrants Survey
Lao PDR Economic Monitor 23The COVID-19 pandemic may have a long-term impact on the migration pattern in Lao PDR. It
was estimated that 0.9 million Lao nationals lived abroad in 2019. Approximately 9 percent of
households receive remittances from abroad, with remittances constituting an average 60
percent of their household income. However, since the pandemic, anecdotal evidence indicates
that the wave of returning migrants is likely to alter the local economic landscape with more than 50
percent of returning migrants surveyed indicating that they have no plans to leave Lao PDR for work
again, or that they are unsure of their future plans.5 On the other hand, approximately 36 percent
of those surveyed were willing to upskill for better opportunities (Figure 10), especially through
vocational training in vehicle mechanics (19%), sewing/tailoring (12%), and cooking (10%). GoL
needs to provide new employment opportunities by funding job creation and job-matching, and
improve structural conditions for low-skilled returning workers.
Photo: Phoonsab Thevongsa
5 According to “Lao People’s Democratic Republic Returning Migrants Survey” by International Organization for
Migration, 2020.
24 Lao PDR Economic MonitorIII. The External Sector
The pandemic has led to a further widening of the current account deficit
The current account deficit is expected to increase in 2020 because of sharp declines in tourism
activities, overflight fees, remittances, and due to higher debt-service obligations despite an
improved goods trade balance. The current account deficit is expected to increase to 11.3
percent of GDP in 2020 from 8 percent in 2019 (Figure 11). The trade deficit declined in 2020 due to a
combination of imports dropping faster than exports because of supply disruptions, along with lower
oil prices and lower demand for fuel during the lockdown. However, the COVID-19 pandemic is also
negatively affecting the services sector, with the tourism-related income coming into the economy
expected to decline by more than $500 million. At the same time, remittances are projected to
decline by about 50 percent (about $100 million) in 2020 because of the pandemic. With a low
foreign currency gross reserve buffer, the country faces heightened balance of payment pressures
and difficulties in meeting debt obligations. There is a shortage of foreign currency in the official
foreign exchange market, which combined with misalignment of the official exchange rate, results
in a large gap between the official and parallel market exchange rates.
Figure 11. The current account deficit is expected to widen in 2020
(percent of GDP)
Source: BOL, MOIC, DOTS (IMF), trading partners’ customs data; and World Bank staff estimates.
The trade deficit decreased in January-September 2020, compared with the same period in 2019,
as imports dropped faster than exports. The goods trade deficit declined by $517 million, from
$955 million in Jan-Sep 2019 to $438 million in Jan–Sep 2020 (Figure 12). Imports declined by 10.2
percent from $5,297 million in Jan-Sep 2019 to $4,757 million over the same period in 2020. Exports
fell by 0.5 percent over the same period, from $4,342 million to $4,319 million. Compared with
nearby countries, Lao export performance contraction was mild in the first nine months of 2020
(Figure 13).
Lao PDR Economic Monitor 25Figure 12. Trade deficit has narrowed Figure 13. Export performance among region
(million $) peers (percent, yoy)
Source: DOTS, IMF Source: DOTS, IMF
Pandemic-linked supply chain disruptions may cause a decline in trade volumes
Supply chain disruptions from Q2 2020 followed by contracting external demand have led to a
severe decline in trading volumes between Lao PDR and its major trading partners, China, Thailand,
and Vietnam.6 Border closures have led to delays in delivering inputs to export-oriented manufac-
turing industries. In addition, electronic parts and garment exports have been adversely affected
by lower demand from Thailand and the EU while mining exports have decreased, mainly due to
lower copper outputs. However, wood pulp exports to China performed well between January and
November 2020, rising by 15.2 percent compared with the same period last year (Figure 14).
Electricity exports also continued to grow by 22.1 percent between January and November 2020,
year-on-year. Lower demands in the manufacturing sectors drove lower imports from China,
Thailand, and Vietnam. These sectors include cement and construction materials, car and motorbike
assembly, iron and steel, and other light manufacturing (Figure 15). Overall import performance
from January to November remained weak and was exacerbated by the pandemic. In the future
however, trade volumes in Lao PDR are expected to benefit from the RCEP Agreement (Box 1).
Photo: Phoonsab Thevongsa
6 Lao PDR commodity exports to the major trading partners of China, Thailand, and Vietnam accounted for 88 percent
of total exports in 2019. Imports from these countries made up about 91 percent of total imports over the same period.
26 Lao PDR Economic MonitorFigure 14. Exports by products to 3 countries Figure 15. Imports by products to 3 countries
(percent) (percent)
Source: Custom agencies of China, Thailand, and Vietnam Source: Custom agencies of China, Thailand, and Vietnam
Box 1: Lao PDR could benefit significantly from the Regional Comprehensive Economic
Partnership
The RCEP — which led to the creation of the world’s largest trading bloc—was signed among
fifteen countries on November 15, 2020. RCEP negotiations started in 2012 with 16 countries:
China, Japan, India, South Korea, Australia, New Zealand and the ten ASEAN countries.
Despite India’s withdrawal in 2019, the agreement is the world’s largest, comprising 30 percent
of global GDP, 27 percent of global merchandise trade and over 18 percent of services trade.
RCEP aligns rules of origin for all member countries, enabling them to integrate into the same
production chain. This may help RCEP attract a larger share of global value chains, with each
country deepening its specialization.
Lao PDR is expected to benefit considerably from RCEP, if supported by reform progress.
Member countries will benefit from RCEP as global value chains relocate. Reduced trade
and investment barriers would increase economic integration among all 15 counties. RCEP is
expected to strengthen regional trade and investment cooperation, which would enable Lao
PDR to boost trade and investment while mitigating the economic impact of the pandemic.
In addition, Lao PDR will gain in terms of the confidence created among foreign investors.
However, the benefits from trade agreements are neither automatic nor assured: it is critical
for Lao PDR to invest in complementary investments and policy changes, including expediting
improvement of the business environment and facilitating the relocation of foreign firms.
Lao PDR Economic Monitor 27In the foreign exchange market, the spread remains large
Pressure on the Lao kip remains high in the foreign exchange market. The Lao kip/US dollar daily
reference rate reached Kip9,257/$1.00 on November 20, depreciating by 4.7 percent year-on-year.
The commercial banks followed a similar rate of depreciation against the US dollar over the same
period. However, in the parallel market, the kip depreciated at a faster rate and the spread between
commercial banks and exchange bureaus reached 9.1 percent in the second week of December
(Figure 16). The spread declined slightly from its peak of 9.7 percent at the end of July 2020 because
of stricter controls on the parallel foreign exchange market coupled with the depreciation of the US
dollar against all major currencies (Figure 17).
Gross official reserves increased from $864 million in June to $1,352 million in September. This
was made possible as the People’s Bank of China (PBOC) extended a 6 billion renminbi (equivalent
to $900 million) swap line to Bank of the Lao PDR (BoL) with a maturity of 3 years.7 However, there
is indication that the funds are earmarked for specific uses, in particular to facilitate imports from
China. Accordingly, funds which are earmarked and whose use is determined by PBOC cannot be
included as foreign currency reserves, and more importantly cannot be used for debt service
payments.8
Figure 16. Parallel market premium of Kip/$ Figure 17. Kip/$ spread remains high
and Kip/Baht (percent) (LHS: exchange rate; RHS: percent)
Source: IMF International Financial Statistics Source: IMF International Financial Statistics, CEIC
database
The real effective exchange rate depreciated from Q2 2020 in line with trends in the nominal rate.
With significant depreciation of the nominal exchange rate, Lao PDR’s real effective exchange rate
has shown a downward trend since April 2020, partly due to a reversal of REER appreciation for a
long period (Figure 18).
7 BoL has indicated that the increase in reserves is for accounting purposes. According to the IMF’s standard recording
of swap transactions, no transaction should be recorded until the funds are put at the disposal of BoL. Thus, until the money
is disbursed, the swap is considered as a contingent asset (i.e., like an undrawn line of credit or guarantee), and not a financial
asset. This implies that as the funds have not yet been received, they should not be included as FX reserves.
8 According to standard IMF recording of swap transactions, when BoL receives funds through this swap agreement, if
the use of the actual funds is subject to authorization by PBOC, the funds do not conform to the definition of reserve assets and
should be recorded as “other investment” in external sector statistics. Given that BoL has indicated that the swap agreement
is to support imports from China, even when the money is transferred to BoL, POBC may effectively authorize how the
Renminbi should be allocated.
28 Lao PDR Economic MonitorFigure 18: Changes in real effective exchange rate
(index)
Source: https://www.bruegel.org/publications/datasets/real-effective-exchange-rates-for-178-countries-a-new-database/
Note: An increase in the index indicates appreciation of the home currency against the basket of currencies of trading partners
New measures have been introduced by BoL to control exchange bureau operations
Responding to the elevated parallel market premium, the BoL imposed new regulations in July.
The new restrictions are as follows: (i) individuals and legal entities who want to operate a currency
exchange business must obtain a license from BoL; (ii) only legal entities—which conduct business
related to hotels and tourism and meet specified requirements—are eligible to obtain currency
exchange business licenses from BoL under this new rule; (iii) once approved, businesses which
disregard the rules of BoL will be first warned, with repeat offenders fined or forced to close; (iv)
currency exchanges must not offer services outside of their declared business venues or will face
fines of 3 million kip per offence; (v) currency exchanges may not engage in direct currency
exchange activities with commercial banks (fine of 5 million kip per offence); (vi) businesses must
set their exchange rates in accordance with the regulations and the central bank’s rate or face fines
of 5 million kip; and (vii) businesses must display their exchange rates so that central bank officials
can easily inspect rate fluctuations. Businesses also need to report their exchange rate to the central
bank daily or face fines of 100,000 kip per day per infringement.
FDI inflows have been relatively resilient
Foreign direct investment (FDI) inflows stayed relatively resilient in the first nine months of 2020
(yoy), driven mainly by construction of the Laos-China railway, the Vientiane-Vang Vieng highway,
and several small and medium-sized power projects (Figure 19). However, the overall trend has
declined from 2019 due to the previous completion of various large hydropower projects and the
pandemic (Figure 20). Inflows of FDI to Lao PDR have remained stable when compared to those in
other regional countries (Figure 21), a fact that may be attributed to government efforts to smooth
the path for investors. The government has pledged to further improve the business climate to
attract more domestic and foreign investment, especially form the private sector, citing a “three
open” policy, that will open “minds”, “doors” and “barriers”.
Lao PDR Economic Monitor 29Figure 19. FDI grew by 24 percent in Q1-Q3 Figure 20. FDI inflows rose in Q1 2020
2020 and mainly flew to infrastructure sector (million $)
(LHS: million $; RHS: yoy change)
Source: BoL Source: BoL
Figure 21: Capital flows exposure in EAP region
(Percent of GDP)
Source: EAP Update, October 2020, the World Bank
Photo: Phoonsab Thevongsa
30 Lao PDR Economic MonitorIV. Inflation and the Financial Sector
Headline inflation has remained high in recent months
Headline inflation remains high because of rising food prices and depreciation of the kip. Although
headline inflation declined to 2.8 percent in November (Figure 22), it remains high, increasing from
an average of 3.0 percent in the first eleven months of 2019 to 5.3 percent over the same period
in 2020. Food inflation was the main driver of headline inflation not only in November, but in 2020
overall. Food inflation increased by an average of 4.1 percent in the first eleven months of 2020,
compared with an average increase of 1.9 percent over the same period in 2019. The depreciation
of the kip in the parallel market in 2020 (see Section III) played a significant role in stoking inflation.
Elevated growth in money supply might also contribute to the rising inflation rate. The average
money supply growth rate was 17.9 percent for the first nine months of 2020, compared with the
average rate of 10.8 percent over the same period last year (Figure 24). Additionally, based on
anecdotal evidence, it seems the official inflation numbers do not accurately reflect the exchange
rate pass through to inflation for Lao PDR.9 Inflation is high if compared with rates across the region
(Figure 23).
Figure 22. Headline inflation has fallen from Figure 23. Inflation comparison among
recent high regional peers
(percentage) (percent)
Source: Lao Statistics Bureau Source: International Financial Statistics
9 One possible reason is that the weights attached to the basket of goods are outdated. The weights are based on the
2013 Labour Expenditure and Consumption Survey.
Lao PDR Economic Monitor 31You can also read