BIS Working Papers No 959 Macroeconomic effects of Covid-19: a mid-term review by Phurichai Rungcharoenkitkul
←
→
Page content transcription
If your browser does not render page correctly, please read the page content below
BIS Working Papers
No 959
Macroeconomic effects of
Covid-19: a mid-term review
by Phurichai Rungcharoenkitkul

Monetary and Economic Department

August 2021

JEL classification: E00, I18.

Keywords: Covid-19 pandemic, health-economic
tradeoffs
BIS Working Papers are written by members of the Monetary and Economic
Department of the Bank for International Settlements, and from time to time by other
economists, and are published by the Bank. The papers are on subjects of topical
interest and are technical in character. The views expressed in them are those of their
authors and not necessarily the views of the BIS.

This publication is available on the BIS website (www.bis.org).

©   Bank for International Settlements 2021. All rights reserved. Brief excerpts may be
    reproduced or translated provided the source is stated.

ISSN 1020-0959 (print)
ISSN 1682-7678 (online)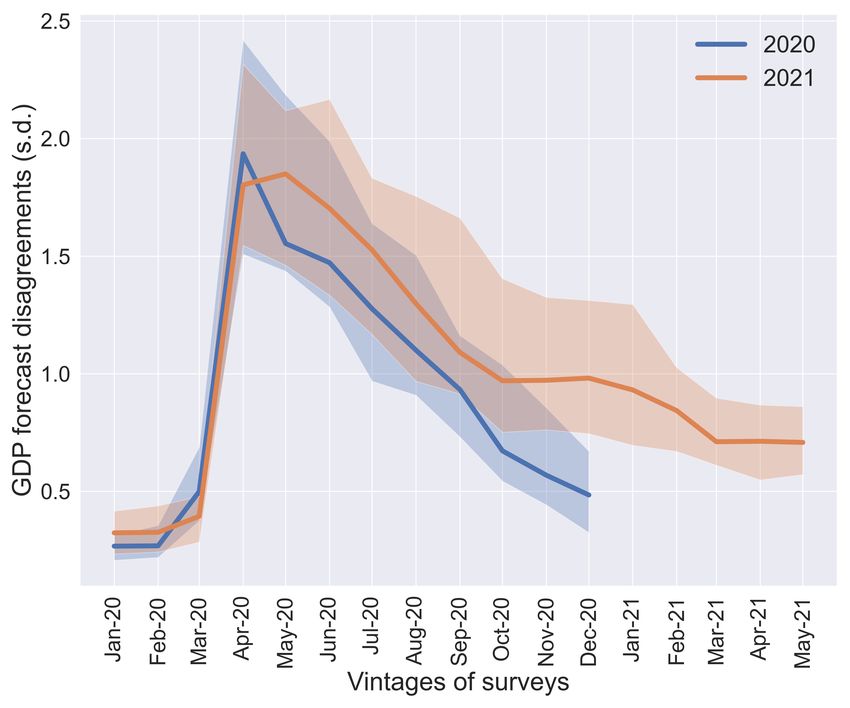
Macroeconomic effects of Covid-19: a mid-term review∗
                                      Phurichai Rungcharoenkitkul†

                                              August 10, 2021

                           Forthcoming in the Pacific Economic Review

                                                   Abstract
       This article provides an interim assessment of the macroeconomic consequences of the Covid-
       19 pandemic. Estimates suggest a median output loss of about 6.5 percent in 2020, a gap
       that is expected to narrow to around 4 percent of the pre-pandemic trend by the end of
       2021. There is however a high dispersion of economic losses across economies, reflecting
       varying exposures to the pandemic and societies’ responses. High-frequency indicators and
       epidemiological models provide some insights into the interactions between the pandemic
       evolution and societies’ strategies of combating it, including the role of vaccination. The
       article draws lessons from experiences thus far and discusses challenges ahead.

JEL Classification: E00, I18
Keywords: Covid-19 pandemic, health-economic tradeoffs

   ∗
      I am grateful to Frederic Boissay, a joint work with whom lays the basis for some materials being used here.
I thank Claudio Borio, Benoit Mojon, Daniel Rees, Hyun Song Shin, Christian Upper, and colleagues at the BIS
for helpful discussion and comments. I also thank the editor Tai-kuang Ho and an anonymous referee for useful
suggestions. All remaining errors are mine. The views expressed are mine and do not necessarily represent those
of the BIS.
    †
      Bank for International Settlements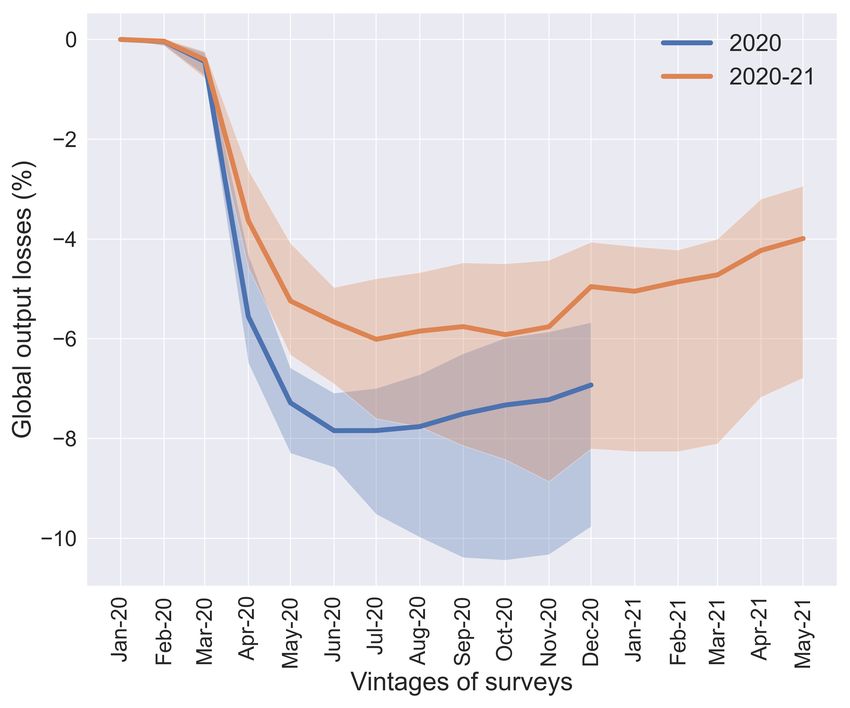
1     Introduction
The Covid-19 pandemic is a twin crisis of truly global proportion. It is first and foremost a
global health emergency, caused by a novel coronavirus that, absent policy actions, could claim
tens of millions of lives.1 The epidemiological root of the crisis makes it particularly perilous:
a virus cannot be negotiated with and does not respect borders. Indeed, no country, rich or
poor, large or small, managed to escape from the pandemic’s disruptive force. And as the world
was galvanised into action in a bid to save lives, the health crisis escalated into an economic
one. The historic large-scale lockdowns designed to contain the virus prompted a collapse in
economic activity never before seen.
       The economic significance of the Covid-19 cannot be overstated. The massive scale of
economic losses alone makes the crisis one of the most pressing and consequential problems,
for many economists in their lifetimes. The unusual character of the crisis, a mixture between
epidemiology and economics, makes the problem a challenging one intellectually. At the same
time, in terms of policy prescription, the stake cannot be higher for economists to get it right.
How costly have the lockdowns been in output terms? How much livelihood is worth sacrificing
to save lives? Does vaccine arrival mean economies can reopen again? These are but some
questions that economists can help shed light on. To be sure, the economics of epidemics is not
a new field. But the Covid-19 has uncertainly made it mainstream.
       It is impossible to do a full justice to a crisis that has spawned a whole new literature,
a book collection and a new journal in a matter of few months.2                       The modest objective
of this article is two-fold. The first goal is to gain a quantitative sense of economic losses
and the channels through which they came about, in the process drawing comparisons with
previous pandemics/epidemics. The second part is devoted to discussing the policy challenges
in managing the Covid-19 pandemic. Of particular interest is the complex two-way interactions
between economic activity and the spread of the virus, and how one could make an informed
data-driven decision in striking a balance between lives and livelihood. I will then briefly discuss
remaining challenges in the next stage of the crisis, with large-scale vaccination in sight but the
virus also mutating continuously.

2     Lessons from past epidemics
Experiences with past epidemics hold a number of lessons that resonate with the Covid-19
crisis. Losses of human capital can cause severe and long-lasting economic damages, especially
in pandemics.3 Epidemics with relatively low fatality rate can also significantly harm economic
activity in affected areas. Economic losses can arise through various channels. Fears and health
concerns can harm sentiments and hold back demand. Public health measures designed to
contain the outbreak, somewhat paradoxically, can be detrimental to economic activity. As
1
  As of June 2021, there have already been 4 million confirmed deaths from the Covid-19. An uncontrolled
  pandemic could have claimed many more, e.g. applying age-specific infection fatality rates to the global
  demographic structure implies 55 million total fatalities. Surges in demand for ICU beds would likely lead
  to additional deaths.
2
  See Brodeur et al. (2021) and Bloom et al. (2021) for literature reviews on the economic impact and comparisons
  with previous epidemics, echoing some of the same themes in this article.
3
  This section draws in part from Boissay and Rungcharoenkitkul (2020).

                                                       1
Table 1: Studies on past epidemics
Epidemics Fatalities Studies and methods Economic losses
Influenza Barro et al. (2020) 6 ppt lower GDP growth
Up to 50
pandemic Cross-country panel regressions 8 ppt lower consumption growth
million
1918-19 Brainerd and Siegler (2003) Mortality significantly lowers growth in
US states data following decade
Correia et al. (2020) 18% decline in manufacturing activity
US states data per year; prompter and more aggressive
containment helped reduce the impact
Global Preparedness Monitoring 4.8% loss in annual global GDP
Board (2019)
Hypothetical
1918-type pandemic
pandemics
Fan et al. (2016) 0.4-1% of GDP loss per year due to ex ante
1918-type pandemic prospects of a pandemic, 86% of which
Include intrinsic cost of mortality is due to mortality and 14% to income
loss. For moderate pandemics, the share
of income loss is larger at 40%
Keogh-Brown et al. (2010) 1.4-6% loss in annual GDP
H1N1 pandemic 0.5-2 ppt of which due to mortality
Multisector CGE, Europe 0.9-4 ppt from school closures and absence
Burns et al. (2006) 3.1% loss in annual global GDP
1918-type pandemic 0.4 ppt of which due to mortality
0.9 ppt from illness and absenteeism
1.9 ppt from efforts to avoid infection
Arnold et al. (2006) 4.25% loss in annual GDP
1918-type pandemic 2.25 ppt from supply side
2 ppt from demand side
SARS Lee and McKibbin (2004) 0.1% loss in global GDP in 2003
774
2003 CGE model
Hai et al. (2004) 1-2 ppt lower GDP growth in China
Chinese surveys
H5N1 455 Burns et al. (2006) 0.1% loss in annual global GDP
2003-19 World Bank estimate 0.4% for Asia
Ebola 11,323 World Bank (2014) 2.1-3.4 ppt lower GDP growth in affected
2014-16 CGE model countries in 1st year of epidemic
in any recession, financial and credit market procyclical developments can amplify and worsen
output losses. The disproportionate effect of an epidemic on the service sector, which depends
particularly on social interactions, is also well-recognised from prior experiences.
A key issue addressed by previous research is the magnitude of economic losses in the
wake of an epidemic. Table 1 summarises selected studies on notable epidemics and estimates
of output losses. The influenza pandemic of 1918 in particular has received much attention in
the literature, being one of deadliest pandemics in modern history.4 Hypothetical studies prior
to the Covid-19 indeed often model a pandemic scenario around the 1918 influenza. At the
same time, there have also been numerous works on more recent epidemics, such as SARS in
2003 and Ebola during 2014-2016, which serve as a basis for comparison.
It is evident from this research that severe pandemics brought about not only extremely
high fatality, but also economics costs that were an order of magnitude larger than those of
4
The world has seen deadlier epidemics in the more distant past. The bubonic plague of the 14th century claimed
up to 200 million lives, while the European viruses in Mexico effectively decimated an entire civilisation. But
much poorer sanitary standards during these times arguably make these episodes less useful as a benchmark for
the current situation.
2typical epidemics. The 1918 influenza led to an output loss of around 6-8% of GDP according
to Barro et al. (2020)) and a 20% decline in manufacturing employment according to Correia
et al. (2020)). Hypothetical studies suggest a present-day repeat of the 1918 pandemic would
lead to an output loss of 3-6% of annual global GDP, (see Global Preparedness Monitoring Board
(2019), Burns et al. (2006) and Keogh-Brown et al. (2010)). Meanwhile, outbreaks of SARS,
H5N1 or Ebola were highly disruptive for the affected countries, but entailed only a negligible
output loss as a percentage of global GDP (See Lee and McKibbin (2004) and Hai et al. (2004)
for SARS, Burns et al. (2006) for H5N1 and World Bank (2014) for Ebola outbreaks).
While most agree on the high cost of the 1918 pandemic, the precise mechanism generating
economic losses remains a subject of debate. One hypothesis is that the pandemic harmed
economies by destroying human lives and associated productive capacity. Illnesses and mortality
risks could also disrupt economic activity.5 An alternative view is that much of output losses
resulted from governments’ non-pharmaceutical intervention (NPIs) such as enforced lockdowns
and closures, introduced to mitigate fatality. Sorting out which of these two factors is more
important requires a natural experiment. For example, Correia et al. (2020) exploit differences in
NPI intensities across states in the US, and find those that implemented NPIs for longer tended
to experience lower mortality and higher manufacturing employment growth. They conclude
that output loss was a direct consequence of the pandemic rather than policies designed to quell
it. Lilley et al. (2020) dispute the finding however, arguing that part of the observed employment
expansion were driven by pre-1918 population growth trend. This debate of whether the cure
may be worse than the disease and whether there is a health-economic trade-off echoes some of
present-day discussion (see next section).
Previous research sometimes divides the transmission mechanism of an epidemic into
demand versus supply channels, recognising that both can play a role. Supply effects may
include a retrenchment in labour supply, by workers who fall ill or refrain from participation
in high-contact jobs due to health concerns. Demand effects include cutbacks in spending on
services, or other goods due to lost income. For example, Arnold et al. (2006) examine the
supply channel in a 1918-like pandemic, by combining an estimated loss of work days with an
estimated productivity per worker. They conclude that, in the first year, the pandemic would
reduce GDP by 2.3%. The same study finds the effect through the demand side to be about
2% of GDP, assuming a larger effect in industries reliant on social interactions. In other words,
both demand and supply channels appear to be similarly important in quantitative terms.
Another important lesson from previous epidemics is the potential long-lasting effects on
the economy. On the supply side, Fan et al. (2016) find that mortality and the reduction of the
labour force made up the largest part of the cost associated with the 1918 influenza pandemic,
due to its persistent effect. A one-time reduction in labour force raised the capital-to-labour
ratio and lowered the rate of return to capital, thus slowing the pace of capital accumulation
and GDP growth for many years.6 Aggregate demand itself could also be persistently depressed.
5
Barro et al. (2020) note that the illness of US President Woodrow Wilson may have contributed to the harsh
terms of the Versailles Treaty in 1919, with tragic ramifications in the following decades.
6
Jordà et al. (2020) also find that real wages remained elevated over more than three decades after major
pandemics. The concurrent World War I presented an identification challenge in quantifying the pandemic’s
contribution to mortality, however (see Barro et al. (2020))
3Table 2: Now and then
Epidemics Death toll Containment Financial Real amplification Context
measures amplification
1918 pandemic 50 million Social distancing Little Little WWI; high share of
manufacturing in GDP
(AEs)
SARS 774 Social distancing Little Little Chinese growth
accelerating
Covid-19, 1 Mar 2996 Wuhan/Lombardy Market selloff Supply chain Globalised
lockdowns disruptions economies; Integrated
Covid-19, 8 Apr 82,220 Global lockdown Tightening financial Supply chain supply/credit chains;
conditions disruptions; Sudden High share of services
stop in demand in GDP for many; High
Covid-19, 9 Oct 1.06 million Global lockdown Stable financial HH/firm balance sheets leverage in parts of real
eased markets, but banks under duress sector
under pressure
Jordà et al. (2020) examine 12 major pandemics in Europe since the 14th century, finding that
they were followed by multiple decades of low interest rates. Their interpretation is that higher
precautionary saving and scarce investment opportunities kept the natural interest rates low.
Unlike wars, pandemics do not destroy physical capital and typically lead to a long period of
excess capital relative to workers.
3 Covid-19: a unique crisis
While many lessons from past pandemics resonate today, the Covid-19 crisis also has several
distinctive characteristics that set it apart from historical benchmarks. Table 2 provides for
some bases for comparison. The context of highly globalised and integrated economies alone
makes a modern-day pandemic more likely and potentially more destructive to begin with.7 But
the most consequential and defining distinction is the large-scale lockdown policies introduced
across the world. The unprecedented health policy response was designed to avert the extremely
high death tolls associated with previous major pandemics. At the same time, the collateral
damage of putting the economy in an induced coma has been staggering. Indeed, the proximate
cause of the economic crisis this time is a conscious policy decision to save lives, rather than an
unforeseen ‘shock’ as typically the case in past recessions.
The unique character of the current crisis means the duration of economic duress is directly
tied to pandemic developments. The latter are uncertain and highly non-linear: small tweaks
to policy could be a difference between infections stabilising or rising exponentially. As Table
2 shows, snapshots from March, April and October painted very different pictures, as the
situation deteriorated quickly despite strong policy responses. This section reviews some of
these challenges and their macroeconomic implications.
7
In 2018 four billion people boarded flights, an average of one in two global citizens. When SARS hit in 2003, flight
passengers totalled just 1.7 billion. Today’s close economic integration also permeates the production network,
as well as cross-border credit and financial market linkages. Increased connectedness amplifies damages of a
pandemic and strengthens the international spillover effects, through both supply and demand.
4(a) Output losses implied by forecasts (b) Disagreement on output projections
Note: Left panel shows output losses implied by Consensus GDP growth forecasts over successive survey vintages.
For each survey, output losses are calculated as the difference between annual GDP growth forecasts and the
corresponding forecasts made in January 2020 before the pandemic. Similarly, the difference between cumulative
GDP growth forecasts over 2020-2021 between pre- and post-pandemic surveys produces the expected output
loss over the 2020-2021 period. Right panel shows GDP forecast disagreement at each survey, measured as the
cross-sectional standard deviations over different forecasters. Lines are cross-country medians, and shaded areas
are cross-country interquartile ranges.
Figure 1: Forecast revisions over time
3.1 The great lockdown
In a prescient 2018 speech, Bill Gates warned of “a significant probability of a large and lethal,
modern-day pandemic occurring in our lifetimes” and that “the health infrastructure we have
for normal times breaks down very rapidly during major infectious disease outbreaks” (Gates
(2018)). The world unfortunately remained little prepared two years on when the Covid-19
struck, and collectively could not prevent a full-blown pandemic. The lack of a prompt and
coordinated global response illustrates the immense difficulty of assessing a rare-event risk in
real time, not least when the last major pandemic was but a distant memory. Indeed, few
anticipated a highly disruptive pandemic even after Italy’s national lockdown and infections
having cropped up in all parts of the world. In early March, most forecasters still expected
global growth in 2020 to hold up well (Figure 1a), and with only few contrarians (Figure 1b).
Unfortunately, the lack of an early decisive action makes much stronger intervention later on
necessary in many cases.
As situation deteriorated rapidly in the course of March, many authorities placed their
countries under lockdowns, including in France and the UK. These stringent measures prompted
a major reassessment of the macroeconomic impact.8 As shown in Table 3, impact assessments
underwent a regime shift around mid March. The usual depiction of economies being subject to
occasional disturbances gave way to sudden-stop economics. The rough-and-ready calculations
of the lockdown implications replaced sophisticated model-based estimates, and suggested a
much larger decline in activity than in previous assessments. The April consensus forecasts
8
For a detailed chronicle of the pandemic and government policy responses, see Bank for International Settlements
(2020) and International Monetary Fund (2020b).
5Table 3: Impact assessments made in March
Studies Methodology Economic losses
McKibbin and Fernando (2020) Hybrid between DSGE and Non-pandemic: 0.3-2.2% annual global GDP loss
2 Mar CGE models Pandemic: 2.5-11% global GDP loss
OECD (2020a) Semi-structural model Baseline: 0.5-1.5 ppt lower annual global GDP growth.
2 Mar Severe: ↓ 2% domestic demand, ↑ 50bps risk premium.
UNCTAD (2020) Analysis of intra-industry Manufacturing affected from China supply disruptions.
4 Mar trade EA, US, JP, KR most affected
Gourinchas (2020) Illustrative calculations 6.5 ppt lower annual GDP growth if 50% is shut down
13 Mar for a month, with 25% shutdown for 2 months
Saez and Zucman (2020) Illustrative calculations 30% loss in US output from shutdown
18 Mar 7.5 ppt lower GDP growth for 1-quarter shutdown
Faria-e Castro (2020) Illustrative calculations 32% US unemployment rate in the 2nd quarter
24 Mar
Gormsen and Koijen (2020) Inference from high-frequency 2.2 and 2.8 ppt lower annual GDP growth in US and
25 Mar data on dividend futures EA respectively
UNWTO (2020) Estimates/judgements 20-30% lower international tourists in 2020
27 Mar $300-450bn tourism revenue (0.3-0.5% of global GDP)
OECD (2020b) Analysis of sectoral output 20-25% GDP loss from shutdown
30 Mar and consumption 2ppt off annual GDP growth for 1-month shutdown
revealed a sharp worsening in 2020 outlook, with output loss estimated to be about 6 percent
for the year (Figure 1a). This order of magnitude is similar to the 1918 pandemic loss, previously
seen by many to be a conservative worst-case scenario (e.g. see Barro et al. (2020)).
Pushing back the first infection wave would end up taking an even heavier toll than
first estimated. Lockdowns put swath of economic activity into a frozen state overnight, and
subjected businesses and households to an unprecedented period of lost incomes. Despite
massive policy support, insolvency risks and unemployment loomed large, especially for most
affected economic sectors. These led to further downward growth revisions between spring and
summer. By June, the expected output loss was 8 percent for the median economy (Figure
1a). Subsequent easing of restrictions in the summer led to some improvements in the economic
outlook, as the median output loss for 2020 was revised to around 6.5 percent. The economic
outlook started to improve more noticeably around late 2020 and early 2021, buoyed by the
sooner-than-expected arrival of vaccines. Even so, the median output level was still projected
to remain 4 percent below the pre-pandemic trend at the end of 2021.
While the Covid-19 is truly a global crisis, the economic impact has also been highly
differentiated across countries. As Figure 1 shows, this became particularly clear in the second
half of 2020, with the range of expected output losses widening markedly across countries,
just as disagreements about individual estimates narrowed. Latest projections of 2020 output
losses vary from around 3 percent in Norway and Korea to more than 10 percent in the United
Kingdom, Spain, India, Peru and the Philippines (Figure 2). This heterogeneity partly reflects
different effectiveness in dealing with the pandemic, e.g. Korea and China managed to contain
the virus spread in 2020 without resorting to prolonged and widespread lockdowns. It is also
related to strengths of policy responses and weights societies attach to health and economic
objectives. Countries moreover differ in their inherent vulnerabilities to the pandemic, e.g.
dependence on tourism and services industries, population density, compliance with government
orders and so on. For countries hardest hit by the pandemic, economic damages have thus been
6Note: Left panel shows implied output losses, computed as cumulative revisions in average Consensus GDP
growth forecasts made between January 2020 and May 2021 (latest survey). ‘2020’ and ‘2020-2021’ are the
periods over which output losses occur (see note to Figure 1). From April 2021, 2020 growth outturns are used in
place of survey results. Right panel shows revisions of 2020-2021 GDP growth forecasts made between October
2020 and April 2021, according to Consensus Economics surveys and the International Monetary Fund.
Figure 2: Output losses and growth forecast revisions
7extremely large, in some cases surpassing even those of previous financial crises.
3.2 The economic sudden stop
With so much at stake and the situation being highly fluid, tracking economic activity in real
time has become indispensable during the pandemic. Traditional macroeconomic statistics were
not timely enough for monitoring events that could take a sharp turn in a matter of days. Various
high-frequency indicators have thus been adapted for macroeconomic monitoring and to guide
policy decisions. Since the first lockdown in Hubei, indicators such as electric consumption,
daily underground passengers and traffic congestion indices have all been used to gauge the
economic fallout from the large-scale containment. Similarly as the containment measures were
relaxed, these indicators helped illuminate how quickly economic activity resumed.
One simple and useful set of high-frequency indicators is based on location history of
mobile devices, exceptionally made available by Apple and Google in the wake of the Covid-19
crisis.9 They provide a timely pulse of economic activity, proxied by the extent to which people
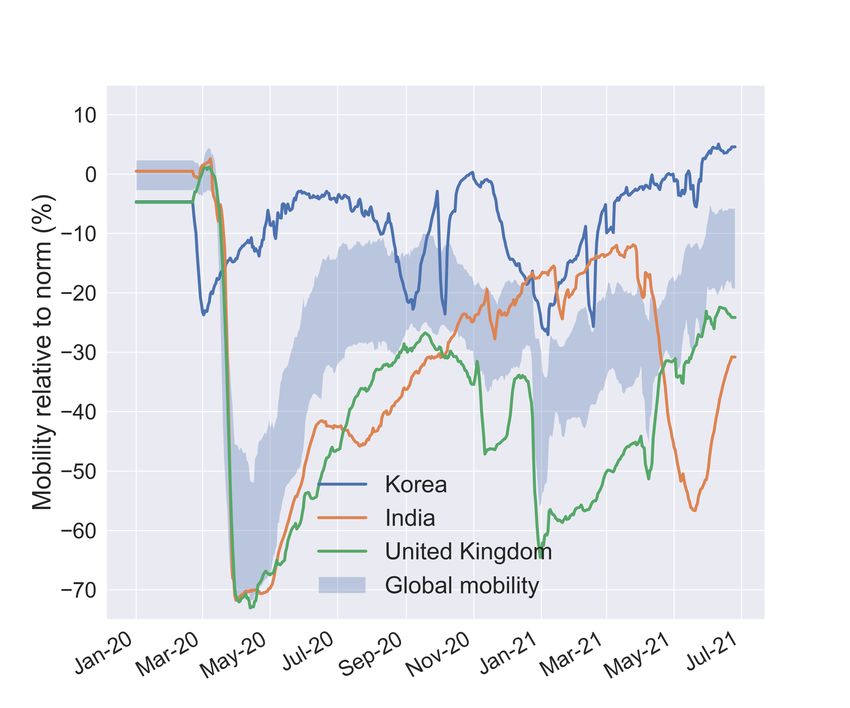
frequent recreational spots and their workplaces. Figure 3 shows the Google mobility indices
for a range of countries, illustrating how economic activity came to a sudden stop in real time.
Mobility in most countries dipped sharply in late March and April as restrictions came into
effect, before gradually recovering in subsequent months. Mobility declined again toward the
end of 2020 as countries faced the second wave of infection, and recovered in early 2021 as
the vaccine rollout accelerated. Mobility continued to increase through the second quarter of
2021, though remained more than 15 percent below pre-pandemic levels as of June 2021 in most
countries.
Readings from mobility indices and other high-frequency indicators align reasonably
closely, at least in the initial phase of the pandemic. As shown in Figure 3a, alternative measures
of real-time activity such as the Global Activity Factor (GAF) based on a dynamic factor model
of Leiva-Leon et al. (2020), export shipment from transponder data due to Cerdeiro et al. (2020)
and the weekly Tracker based on Google Trends of Woloszko (2020), all pointed to a sharp output
contraction in the spring of 2020 and a gradual recovery in the summer. Mobility indices and
the Tracker are arguably the most timely indicators, having reacted most promptly during
both contraction and recovery phases. At the same time, mobility appears less correlated with
other indicators over the more recent sample – mobility plunged during the second wave while
both GAF and Weekly Tracker held up well. One interpretation is that societies may have
adapted to the pandemic over time, making output less sensitive to mobility restrictions. That
said, structural breaks between high-frequency indicators and aggregate output are potential
problems for most of these measures.
In addition to its timeliness, another advantage of the mobility indices is their standardised
format and availability for a large group of economies, which allow cross-country comparisons.
Figure 3b shows selected countries at both tails of the distribution - those whose mobility
declined the most, such India and the United Kingdom, versus the other end of spectrum such
as South Korea and the Nordic countries. This cross-country heterogeneity provides a basis
for policy evaluation and comparative analysis. E.g. what are the implications of different
9
See https://covid19.apple.com/mobility and https://www.google.com/covid19/mobility/
8(a) High-frequency indicators (b) Mobility indices
Note: Left panel shows the cross-country interquartile ranges of Google mobility indices (shaded area), alongside
three other high-frequency indicators. Each Google mobility index is the average of retail and recreation, transit,
and workplace activities subindices. ‘GAF’ is the cumulative Global Activity Factor from Leiva-Leon et al.
(2020), a proxy for global economic activity based on a dynamic factor model. ‘Export shipment’ is the deadweight
tonnage of exports relative to 2017-2019 from Automatic Identification System (AIS) transponder data, computed
by Cerdeiro et al. (2020). ‘Tracker’ is the cross-country interquartile ranges of OECD Weekly Tracker which uses
Google Trends as predictors of GDP growth – see Woloszko (2020). Right panel shows the same cross-country
mobility ranges together with mobility indices of selected countries.
Figure 3: Tracking real-time activity
approaches to lockdown in terms of health and macroeconomic outcomes?
Differences in average mobility indeed explain almost 40 percent of cross-country
variations in growth outcomes in 2020, suggesting that the mobility index has performed
relatively well as a nowcasting tool at least in the early stage of the pandemic. Figure 4a
shows average mobility on the horizontal axis and the corresponding growth forecast revisions
for 2020 on the vertical axis. There is a positive relationship as one might expect, with 10
percentage points of mobility being equivalent to about 2.4 percentage points of GDP growth
on average. The estimate is statistically significant, despite leaving out many relevant factors.
Countries such as Spain, Italy, Greece and Thailand experience larger falls in expected GDP
growth than suggested by their average mobility alone, which could be explained by their heavy
reliance on tourism.
The mobility index is sometimes interpreted as a policy variable, a measure of government
restriction stringency. Mobility is indeed negatively correlated with the ‘stringency index’ as
shown in Figure 4b: countries whose governments impose more stringent measures than others
tend to have lower mobility. That said, mobility and policy stringency are strictly distinct
concepts. Public health policies could be ineffective in reducing mobility if public compliance is
low. By the same token, relaxing restrictions does not guarantee free-flowing economic activity
if the general public remains concerned about the virus. In fact, the mobility index reflects
both government policies and preferences of the general public, and is better thought of as the
society’s policy choice rather than that of the government alone.
9(a) Mobility as a nowcasting tool (b) Mobility as a policy stance measure
Note: ‘Mobility’ on the horizontal axes is the Google mobility index (computed as in Figure 3), averaged over the
first 60 days since first confirmed case. ‘Growth revision’ is the difference between December and January 2020
Consensus forecasts of GDP growth, in percentage points. ‘Stringency index’ is the sample average of aggregate
policy stringency index from Hale et al. (2021).
Figure 4: Two interpretations of mobility indices
3.3 The lives versus livelihood tradeoff
Most scientists including the WHO considered strict containment measures including lockdowns
as necessary on medical grounds to counter rapidly rising new infections.10 Ferguson et al
(2020) is an early influential study showing that in the absence of a ‘suppression’ strategy,
surges of new patients could overrun hospital capacity and lead to more deaths - Bill Gates’
doom scenario. The conclusion follows from a simple epidemiological arithmetic: if each
infected person continues passing the virus on to more than one person, infections will continue
rising at an exponential rate. With the inherent infectiousness of SARS-CoV-2, the explosive
reproductive dynamic will continue until much of the population has either developed immunity
or died. Lockdowns are designed to drastically reduce the infection rate and avoid exposing a
large fraction of population to the virus. Some scientists have argued against strict lockdowns
in response to the first wave on the grounds that a significant part of the population may
likely acquired immunity naturally (see Boissay et al. (2020) for a review of the debate). But
subsequent infection waves have by and large dispelled any perception that the ‘herd immunity’
was close to being achieved early on in the pandemic.
Controversies surrounding lockdowns also arise from the potential conflict between health
and economic objectives. One view is that there is a health-economic tradeoff, between ‘lives
and livelihood’. Lockdowns are detrimental to the economies but help save lives. The question
is whether severe lockdowns go too far along the latter dimension from a welfare perspective.
One approach to answering this question is to quantify lives saved in economic terms, using the
Value of a Statistical Life (VSL), which measures how much a person values his or her own life.
10
The health emergency proviso in important. Some countries have managed to avoid severe lockdowns, through
a combination of earlier responses, extensive uses of masks and aggressive test-and-quarantine strategy.
10(a) Reduced-form empirical relationship (b) Tale of two forces
Note: On the left panel, the horizontal axis is the average mobility over the first 60 days after the first confirmed
case. The vertical axis shows deaths per million population, as of end of October 2020.
Figure 5: Health-economics tradeoff
The VSL is one metric of the social welfare, on the ground that a priori a pandemic could affect
just anyone. Greenstone and Nigram (2020) applies this approach in the case of the United
States, and found that saving 530,000 lives is worth over one third of US annual GDP, achievable
through moderate social distancing. Cutler and Summers (2020) use the VSL to calculate losses
from long-term and mental health problems, finding that these are as large as the economic costs
of mortality. See Boissay et al. (2020) for further discussion of the VSL approach and its limits.
A different approach to quantifying the tradeoff is to examine the impact of livelihood on lives.
Recessions could also have harmful effects on health and mortality, especially in economies with
weak social safety nets and limited fiscal resources. These considerations tend to nudge the
balance towards the economic objective - see Hausmann and Schetter (2020) and Doerr and
Hofmann (2020).
Another view on the debate is that there may not be a tradeoff at all. The argument is
that normal economic activity cannot resume as long as a pandemic is still raging. Households
conscious of health risks cannot freely spend while businesses will put off investment until the
coast is clear. In this environment where a more severe health crisis only leads to a deeper
economic fallout, the solution is to do whatever it takes to beat the pandemic - see Portes
(2020) and Chang and Velasco (2020). Indeed, the data seem to support this view, as the
supposed tradeoff between economic activity and health outcomes is elusive. Figure 5a shows
the cross-country scatter plot of deaths per million on average mobility during the early phase
of the pandemic.11 The negative slope suggests that on average those countries that suffer more
economically are also the one with worse health outcomes. There is seemingly no tradeoff.12
One way to reconcile these viewpoints is to distinguish two independent forces. The
11
I allow for some time lag between mobility and eventual health outcomes because of epidemiological inertia,
but other lag choices deliver similar results. This supposedly ‘perverse’ relationship has also been widely
documented by others, including in the press.
12
See also Oliu-Barton et al. (2021) which uses weekly Tracker of Woloszko (2020) instead of GDP and arrive at
the same conclusion.
11(a) Tradeoffs across countries (b) Tradeoffs across scenarios
Note: Simulation from the epidemiological-economic model of Rungcharoenkitkul (2021), estimated as of end-
June 2021. Each line represents the feasible set of health and economic outcomes, respectively new fatalities and
average mobility projected in the second half of 2021. The left panel shows the feasible sets for four selected
countries. The right panel presents results for India under baseline and two other scenarios. Under ‘Slow
vaccination’, the vaccine supply/take-up slows to a third of the baseline, while under ‘Virus mutation’, each
vaccinated/recovered person loses immunity after 60 days.
Figure 6: Feasible set from model simulations
first is the epidemiological link between social interactions and the pandemic severity – more
interactions lead to higher infections and deaths. This is summarised schematically by the
upward-sloping ‘pandemic curve’ in Figure 5b, where greater activity implies more deaths.
The second force is the society’s preferences over health-economic outcomes, represented by
the ‘Society’s response’ schedule. It is downward-sloping because the society exercises greater
precaution in response to a worsening pandemic, by curtailing economic activity.13 The
relative positions of these two schedules then dictate differences in cross-country outcomes. An
explanation for the negative slope in Figure 5a is that shifts in the pandemic curve dominate
those of society’s response. Large epidemiological variations across countries thus trace out
the average societies’ response curve, revealing the estimated downward-sloping relationship.
In truth, the society as a whole still faces an epidemiological constraint as defined by the
pandemic curve, as the pandemic inescapably narrows the set of feasible health-economic
outcomes available to the society.14
Having an estimate of the pandemic curve would provide useful information about the
feasible health-economic set for policymakers whatever their preferences may be. Recovering it
requires a structural epidemiological model that internalises how the infection rate interacts with
the society’s choice.15 Figure 6a shows the estimated pandemic curves for selected countries,
13
In keeping with the previous section, I refer to the society to make clear that such decision is jointly made
by the general public and the government. More precisely, the society’s response curve is defined by the more
stringent of the two. If government regulations are laxer than the public prefers, the public response curve will
prevail, and vice versa assuming perfect compliance.
14
From this perspective, the argument of Portes (2020) may be more about the relevance rather than the existence
of a tradeoff. If the society cannot tolerate very high level of fatality (its response curve has a ceiling), then
the upper portion of the pandemic curve is never binding.
15
A number of papers have explored this interaction in a stylised setting – see Álvarez et al. (2021), Eichenbaum
12based on the epidemiological-economic model of Rungcharoenkitkul (2021) which augments an
SEIR-type model with an optimising unit representing the societies’ preferences over lives and
livelihood. The model is fit to daily health data (cases and deaths) and mobility, using a
fast filtering method (see https://github.com/phurichai/covid19macro for the open-source
code). The estimated model is used to construct counterfactual scenarios by simulating over
alternative live-vs-livelihood preference parameters. As shown in Figure 6a, the feasible set is
always upward sloping at any given moment – saving more lives comes at the expense of lower
mobility.
The terms of health-economic tradeoff can vary across economies depending on context
and initial conditions. As illustrated by Figure 6a, reducing mobility by 5 percent can save
more than 200 lives per million in India (almost 300 thousand lives), but less than 100 lives per
million in the United States. Country-specific factors such as population density ad effectiveness
of policy may partly explain these differences. Also important is the size of susceptible
population. Those that have already experienced previous large infection waves and/or have
made substantial progress in vaccination would be less exposed to additional deaths. In these
cases, restricting mobility would entail lower marginal benefits.
The terms of tradeoff can also vary over time in a given country as the situation evolves.
The arrival of vaccination, by granting immunity to individuals without exposing them to
the virus, eases the terms of tradeoff and allows economies to remove restrictions at fewer
fatalities. Improving treatment standard, by suppressing the case-fatality rate, can similarly
deliver better outcomes. Conversely, any setback to the vaccination programme could justify a
reenactment of restrictions. The tradeoff could also deteriorate if new virus strains emerge that
overcome existing immunity in the population. The epidemiological-economic model can again
provide some quantitative implications of these contingencies. Figure 6b depicts the tradeoff
schedules under the baseline and two downside scenarios, using India as an illustration. If
vaccination progress stalls or virus mutations compromise immunity, mobility may need to be
further reduced by 5-10 percent if new deaths were to be kept below 300 per million.
3.4 The new normal
At the time of writing (summer 2021), many countries were still grappling with rising new
cases and most countries still had some form of restrictions in place. As foreshadowed by
the 1918 flu pandemic, subsequent infection waves proved to be the deadlier ones. At the same
time, containment measures have generally become less stringent compared to the first infection
wave. One reason was greater perceived effectiveness of even moderate and targeted lockdowns,
given better sanitation practices (e.g. public mask wearing), improved treatment protocols, and
more rigorous trace-and-quarantine practices. Another reason was a concern that another strict
lockdown could be much more debilitating economically than in the early stage, especially due
to higher risks of bankruptcies.16 Lockdown fatigue and dwindling political support in some
et al. (2021), Glover et al. (2020), Jones et al. (forthcoming) and Krueger et al. (2020) among others and
Boissay et al. (2020) for a review of this new literature.
16
Firms and households have drawn on much of their liquidity and equity cushions during the first lockdown,
though bankruptcies have so far been fewer than suggested by output (see Banerjee and Kharroubi (2020) and
Banerjee et al. (2020)). Extraordinary government support has clearly played an important role as a shock
13cases may have also played a role.
A quick end of the pandemic is far from assured. The early arrival of vaccines promised
to be a game changer, but scaling vaccination globally has been an immense challenge. Under
pressure to contain infections at home, many countries rushed to secure vaccine doses amid
limited global supply. Relatively few managed to obtain more than adequate supply for their
population, while others had to contend with infection surges with little vaccine protection. The
lack of a global coordination has likely made it easier for new virus variants to emerge and take
hold. The much more contagious Delta variant has already become rampant in many countries,
and is capable of causing breakthrough infections among those vaccinated. As the race between
vaccination and virus mutations gets protracted, eradication appears further out of reach while
an endemic Covid-19 in the longer term becomes an increasingly likely prospect.
Looking beyond the pandemic, it is likely that the global economy would not return
to what it once was. For one, the large and uneven impact on the economy is providing
strong impetus for resource allocations. Those industries reliant on face-to-face interactions,
hardest hit by the pandemic, may face a more protracted recovery and falling output share (see
Rees (2020)). Meanwhile, winning sectors from the pandemic could benefit from permanent
preference shifts e.g. towards conducting virtual meetings and working from home. The
pandemic also disproportionately affected smaller firms and low-income group, which could
have long-term ramifications on employment prospects and income distribution (see Yonzan
et al. (2020)).
The pandemic could also leave lasting impressions on people’s beliefs and influence their
behaviour long after it is gone. Kozlowski et al. (2020) argue that, because a pandemic is so
rare, once it happens its perceived likelihood jumps and persists. And because a pandemic
precipitates resource allocations and capital obsolescence, concerns about future pandemics can
have significant effects on today’s risk premium and investment. They estimate that this ‘belief
scarring effect’ could generate a long-term cost 10 times larger than the short-term GDP loss.
Finally, the pandemic could cast a long shadow on the policy landscape for years if
not decades to come. The provision of fiscal backstop during lockdowns totalled $12 trillion
globally, equivalent to 12 percent of global GDP (International Monetary Fund (2020a)).
Most of the stimulus is accounted for by advanced economies, whose public debt is now at
over 120 percent of GDP, the highest level since World War II. Emerging market economies
have been more constrained fiscally, but have themselves seen public debt rising to historical
high at over 60 percent. Any major bankruptcy events, a non-negligible risk, could make
further fiscal commitments necessary. High public debt levels coupled with low growth could
present challenges for central banks when the time comes to rebuild policy space (Borio
(2020)). Monetary policy normalisation, even if justified on macroeconomic grounds, could
be subordinate to fiscal sustainability concerns. As a result, the low-for-long interest rate
environment could be further entrenched by the pandemic, putting even more burden on
macroprudential policies to deliver on financial stability (Rungcharoenkitkul (2020)). It is not
clear if they can achieve this by themselves.
absorber, but scope to provide a blanket backstop has significantly narrowed.
144 Conclusions: lessons from the Covid-19
The pandemic is by no means over and there may be more surprises in store. Nonetheless, the
last 18 months already hold some useful lessons for the future.
First, it is now clear that a highly disruptive pandemic remains a possibility today and
underestimating its risk can come at great cost. This urgently calls for enhancing global
preparedness to quickly identify and thwart future threats, as well as a concrete well-orchestrated
contingency plan of actions once an outbreak has occurred. Second, severe lockdowns of the
type seen in the spring of 2020 can be introduced only so many times over the course of a
pandemic. Economic damages and policy resources needed to alleviate them are extremely
high and tend to increase nonlinearly as restrictions are repeated. This last-resort solution
must therefore be accompanied by other less disruptive measures as part of the overall strategy.
Third, maximising effectiveness of these other measures is key for limiting the total pandemic
cost. Draconian but targeted policies are far less expensive than indiscriminate measures, but
there may be only a small window of opportunity where they are effective. Enforcing strict
quarantine rules, tightening border controls and conducting extensive contact tracing very early
on in an outbreak could be the key difference.
15References
Álvarez, F., D. Argente, and F. Lippi (2021): “A simple planning problem for COVID-19
lockdown,” American Economic Review: Insights.
Arnold, R., J. De Sa, T. Gronniger, A. Percy, and J. Somers (2006): “A potential
influenza pandemic: possible macroeconomic effects and policy issues,” report to the
Congressional Budget Office.
Banerjee, R. and E. Kharroubi (2020): “The financial vulnerabilities driving firms to the
exit,” BIS Quarterly Review.
Banerjee, R., E. Kharroubi, and U. Lewrick (2020): “Bankruptcies, unemployment and
reallocation from Covid-19,” BIS Bulletin, 31.
Bank for International Settlements (2020): BIS Annual Economic Report, Basel,
Switzerland.
Barro, R., J. Ursua, and J. Weng (2020): “The coronavirus and the Great Influenza
Pandemic: lessons from the ‘Spanish flu’ for the coronavirus’ potential effects on mortality
and economic activity,” NBER Working Papers 26866.
Bloom, D., M. Kuhn, and K. Prettner (2021): “Modern infectious diseases:
macroeconomic impacts and policy responses,” CEPR Discussion Papers 15997.
Boissay, F., D. Rees, and P. Rungcharoenkitkul (2020): “Dealing with Covid-19:
understanding the policy choices,” BIS Bulletin, 19.
Boissay, F. and P. Rungcharoenkitkul (2020): “Macroeconomic effects of Covid-19: an
early review,” BIS Bulletin, 7.
Borio, C. (2020): “The Covid-19 economic crisis: dangerously unique,” National Association
for Business Economics, Perspectives on the Pandemic Webinar Series.
Brainerd, E. and M. Siegler (2003): “The economic effects of the 1918 influenza epidemic,”
CEPR Discussion Papers 3791.
Brodeur, A., D. Gray, A. Islam, and S. Bhuiyan (2021): “A literature review of the
economics of Covid-19,” Journal of Economic Surveys.
Burns, A., D. van der Mensbrugghe, and H. Timmer (2006): “Evaluating the economic
consequences of avian influenza,” World Bank Working Paper 47417.
Cerdeiro, D. A., A. Komaromi, Y. Liu, and M. Saeed (2020): “World seaborne trade in
real time: a proof of concept for building AIS-based nowcasts from scratch,” IMF Working
Papers 20/57.
Chang, R. and A. Velasco (2020): “Economic policy incentives to preserve lives and
livelihoods,” Covid Economics, 33–56.
Correia, S., S. Luck, and E. Verner (2020): “Pandemics depress the economy, public
health interventions do not: evidence from the 1918 flu,” mimeo.
Cutler, D. and L. Summers (2020): “The Covid-19 pandemic and the $16 trillion virus,”
Journal of American Medical Association, 324.
Doerr, S. and B. Hofmann (2020): “Recessions and mortality: a global perspective,” BIS
Working Paper 910.
16Eichenbaum, M. S., S. Rebelo, and M. Trabandt (2021): “The Macroeconomics of
Epidemics,” The Review of Financial Studies, hhab040.
Fan, V., D. Jamison, and L. Summers (2016): “The inclusive cost of pandemic influenza
risk,” NBER Working Papers 22137.
Faria-e Castro, M. (2020): “Back-of-the-envelope estimates of next quarter’s unemployment
rate,” On the economy blog, Federal Reserve Bank of St. Louis.
Ferguson et al, N. (2020): “Impact of non-pharmaceutical interventions (NPIs) to reduce
COVID-19 mortality and healthcare demand,” Imperial College COVID-19 Response Team
Report 9.
Gates, B. (2018): “Shattuck Lecture,” https://www.gatesfoundation.org/
Media-Center/Speeches/2018/04/Shattuck-Lecture-Innovation-for-Pandemics,
Boston, Massachusetts.
Global Preparedness Monitoring Board (2019): “A world at risk: annual report on
global preparedness for health emergencies,” Tech. rep.
Glover, A., J. Heathcote, D. Krueger, and J. Rios-Rull (2020): “Health versus
Wealth: On the Distributional Effects of Controlling a Pandemic,” Centre for economic policy
research.
Gormsen, N. J. and R. S. J. Koijen (2020): “Coronavirus: Impact on stock prices and
growth expectations,” Working paper, University of Chicago Booth School of Business.
Gourinchas, P. O. (2020): “Flattening pandemic and recession curves,” mimeo.
Greenstone, M. and V. Nigram (2020): “Does social distancing matter?” Becker Friedman
Institute Working Paper 26.
Hai, W., Z. Zhao, J. Wang, and Z. G. Hou (2004): “The short-term impact of SARS on
the Chinese economy,” Asian Economic Papers, 3.
Hale, T., N. Angrist, R. Goldszmidt, B. Kira, A. Petherick, T. Phillips,
S. Webster, E. Cameron-Blake, L. Hallas, S. Majumdar, and H. Tatlow (2021):
“A global panel database of pandemic policies (Oxford Covid-19 Government Response
Tracker),” Nature Human Behaviour, 5, 529–538.
Hausmann, R. and U. Schetter (2020): “Horrible trade-offs in a pandemic: lockdowns,
transfers, fiscal space, and compliance,” CID Faculty Working Paper 382.
International Monetary Fund (2020a): Fiscal Monitor, October 2020 - Policies for the
Recovery, Washington, DC.
——— (2020b): World Economic Outlook, Chapter 1, the Great Lockdown, Washington, DC.
Jones, C., T. Phillipon, and V. Venkateswaran (forthcoming): “Optimal Mitigation
Policies in a Pandemic,” Review of Financial Studies.
Jordà, O., S. Singh, and A. Taylor (2020): “Longer-run economic consequences of
pandemics,” mimeo.
Keogh-Brown, M., R. Smith, J. Edmunds, and P. Beutels (2010): “The macroeconomic
impact of pandemic influenza: estimates from models of the United Kingdom, France,
Belgium and The Netherlands,” European Journal of Health Economics, 11.
17Kozlowski, J., L. Veldkamp, and V. Venkateswaran (2020): “Scarring body and mind:
the long-term belief-scarring effects of COVID-19,” Economic policy symposium proceedings,
the federal reserve bank of kansas city.
Krueger, D., H. Uhlig, and T. Xie (2020): “Macroeconomic Dynamics and Reallocation
in an Epidemic: Evaluating the “Swedish Solution”,” Centre for economic policy research.
Lee, J. W. and W. McKibbin (2004): “Estimating the global economic costs of SARS,”
in Learning from SARS: preparing for the next outbreak, ed. by S. Knobler, A. Mahmoud,
S. Lemon, A. Mack, L. Sivitz, and K. Oberholtzer, The National Academies Press.
Leiva-Leon, D., G. Perez-Quiros, and E. Rots (2020): “Real-time weakness of the global
economy: a first assessment of the coronavirus crisis,” ECB Working Paper Series 2381.
Lilley, A., M. Lilley, and G. Rinaldi (2020): “Public health interventions and economic
growth: revisiting the Spanish flu evidence,” mimeo.
McKibbin, W. and R. Fernando (2020): “The global macroeconomic impacts of Covid-19:
seven scenarios,” CAMA Working Paper 19.
OECD (2020a): “Coronavirus: the world economy at risk,” Oecd interim economic assessment.
——— (2020b): “Evaluating the initial impact of Covid containment measures on activity,”
Tech. rep.
Oliu-Barton, M., B. S. R. Pradelski, P. Aghion, P. Artus, I. Kickbusch, J. V.
Lazarus, D. Sridhar, and S. Vanderslott (2021): “SARS-CoV-2 elimination, not
mitigation, creates best outcomes for health, the economy, and civil liberties,” The Lancet,
10291, 2234 – 2236.
Portes, J. (2020): “Don’t believe the myth that we must sacrifice lives to save the economy,”
The guardian, opinion.
Rees, D. (2020): “What comes next?” BIS Working Papers 898.
Rungcharoenkitkul, P. (2020): “An integrated macroprudential framework in the post-
pandemic world,” in How do monetary, micro- and macroprudential policies interact?
Proceedings of OeNB Workshops, Oesterreichische Nationalbank, vol. 22.
——— (2021): “Macroeconomic consequences of pandexit,” BIS Working Papers 932.
Saez, E. and G. Zucman (2020): “Keeping business alive: the government will pay,” Social
europe.
UNCTAD (2020): “Global trade impact of the coronavirus (Covid-19) epidemic,” Report.
UNWTO (2020): “Impact assessment of the Covid-19 outbreak on international tourism,”
Report.
Woloszko, N. (2020): “Tracking activity in real time with Google trends,” OECD Economics
Department Working Papers 1634.
World Bank (2014): “The economic impact of the 2014 ebola epidemic: short and medium
term estimates for West Africa,” Report.
Yonzan, N., C. Lakner, D. G. Mahler, R. A. C. Aguilar, and
H. Wu (2020): “The impact of COVID-19 on global poverty under
worsening growth and inequality,” https://blogs.worldbank.org/opendata/
impact-covid-19-global-poverty-under-worsening-growth-and-inequality, world
Bank Data Blog.
18Previous volumes in this series
958 Sharing asymmetric tail risk Giancarlo Corsetti, Anna Lipińska
August 2021 smoothing, asset pricing and terms of trade and Giovanni Lombardo
957 Ripple effects of monetary policy Frederic Boissay, Emilia Garcia-
August 2021 Appendini, and Steven Ongena
956 Are households indifferent to monetary Fiorella De Fiore, Marco Lombardi
August 2021 policy announcements? and Johannes Schuffels
955 Quantifying the high-frequency trading “arms Matteo Aquilina, Eric Budish and
August 2021 race” Peter O’Neill
954 Fiscal and monetary policy interactions in a Boris Hofmann, Marco J Lombardi,
July 2021 low interest rate world Benoît Mojon and Athanasios
Orphanides
953 Limits of stress-test based bank regulation Isha Agarwal and Tirupam Goel
July 2021
952 Passive funds affect prices: Karamfil Todorov
July 2021 Evidence from the most ETF-dominated asset
classes
951 Distrust or speculation? The socioeconomic Raphael Auer and
July 2021 drivers of US cryptocurrency investments David Tercero-Lucas
950 Fiscal regimes and the exchange rate Enrique Alberola, Carlos Cantú,
June 2021 Paolo Cavallino and Nikola Mirkov
949 The natural interest rate in China Sun Guofeng and Daniel M Rees
June 2021
948 Central bank digital currency: the quest for Raphael Auer and Rainer Böhme
June 2021 minimally invasive technology
947 Money, technology and banking: what Michael Chui
June 2021 lessons can China teach the rest of the world?
946 The pricing of carbon risk in syndicated loans: Torsten Ehlers, Frank Packer and
June 2021 which risks are priced and why? Kathrin de Greiff
945 US monetary policy and the financial channel Shesadri Banerjee and M S
May 2021 of the exchange rate: evidence from India Mohanty
All volumes are available on our website www.bis.org.You can also read