Economic damage and spillovers from a tropical cyclone - NHESS
←
→
Page content transcription
If your browser does not render page correctly, please read the page content below
Nat. Hazards Earth Syst. Sci., 19, 137–151, 2019
https://doi.org/10.5194/nhess-19-137-2019
© Author(s) 2019. This work is distributed under
the Creative Commons Attribution 4.0 License.

Economic damage and spillovers from a tropical cyclone
Manfred Lenzen1 , Arunima Malik1,2 , Steven Kenway3 , Peter Daniels4 , Ka Leung Lam3 , and Arne Geschke1
1 ISA,School of Physics A28, The University of Sydney, NSW, 2006, Sydney, Australia
2 Disciplineof Accounting, The University of Sydney Business School, The University of Sydney, NSW, 2006, Sydney,
Australia
3 School of Chemical Engineering, The University of Queensland, St Lucia, 4072, Australia
4 School of Environment, Griffith University, Brisbane, 4222, Australia

Correspondence: Arunima Malik (arunima.malik@sydney.edu.au)

Received: 13 December 2017 – Discussion started: 5 January 2018
Revised: 29 August 2018 – Accepted: 31 August 2018 – Published: 21 January 2019

Abstract. Tropical cyclones cause widespread damage in              1   Introduction
specific regions as a result of high winds and flooding. Di-
rect impacts on commercial property and infrastructure can
lead to production shortfalls. Further losses can occur if          On Tuesday 28 March 2017, severe Tropical Cyclone Deb-
business continuity is lost through disrupted supply of in-         bie made landfall at Airlie Beach, in North Queensland, Aus-
termediate inputs from, or distribution to, other businesses.       tralia (QLD-N). As a Category 4 system (equivalent to a ma-
Given that producers in modern economies are strongly in-           jor hurricane or a typhoon), it hit coastal communities with
terconnected, initially localised production shortfalls can rip-    torrential rain and wind gusts up to 265 km h−1 , destroy-
ple through upstream supply-chain networks and severely af-         ing or damaging homes, businesses, crops and infrastructure
fect regional and wider national economies. In this paper, we       and, tragically, led to 12 fatalities (Queensland Government,
use a comprehensive, highly disaggregated and recent multi-         2017). The initial impact was felt mainly on the iconic Great
region input–output framework to analyse the negative im-           Barrier Reef coral ecosystems of the Whitsunday Coast and
pacts of Tropical Cyclone Debbie, which battered the north-         the surrounding communities including Bowen and Proser-
eastern Australian coast in March 2017. In particular, we           pine. Within 24 h, Debbie was approximately 250 km inland
show how industries and regions that were not directly af-          and had degenerated into a high-rainfall low-pressure sys-
fected by storm and flood damage suffered significant job           tem. The system progressively tracked over 1000 km south,
and income losses throughout upstream supply chains. Our            where it moved back out to sea around the Queensland–
results indicate that the disaster resulted in the direct loss of   New South Wales border on 31 March after significant flood-
about 4802 full-time-equivalent jobs and AUD 1544 million           ing across the region. Rainfall of 150–250 mm was recorded
of value added, and an additional indirect loss of 3685 jobs        regionally, with peaks of 400–1000 mm, swamping remote
and AUD 659 million of value added. The rapid and detailed          rural, coastal and urban communities. More than a week
assessment of the economic impact of disasters is made pos-         later, widespread flooding was still being felt in the region
sible by the timely data provision and collaborative environ-       (Queensland Government, 2017).
ment facilitated by the Australian Industrial Ecology Virtual          Dubbed the “lazy cyclone”, Debbie moved at under
Laboratory (IELab).                                                 6 km h−1 at times, causing atypically high levels of social,
                                                                    economic and environmental destruction. Over 63 000 emer-
                                                                    gency calls were made and over 50 000 insurance claims
                                                                    subsequently logged (Queensland Government, 2017). Par-
                                                                    ticular impact was felt in the farming, mining and tourism
                                                                    industries in the northern part of the afflicted region and
                                                                    by flooded businesses in the south. Annual and perennial
                                                                    crops and trees were destroyed, export-oriented coal mines

Published by Copernicus Publications on behalf of the European Geosciences Union.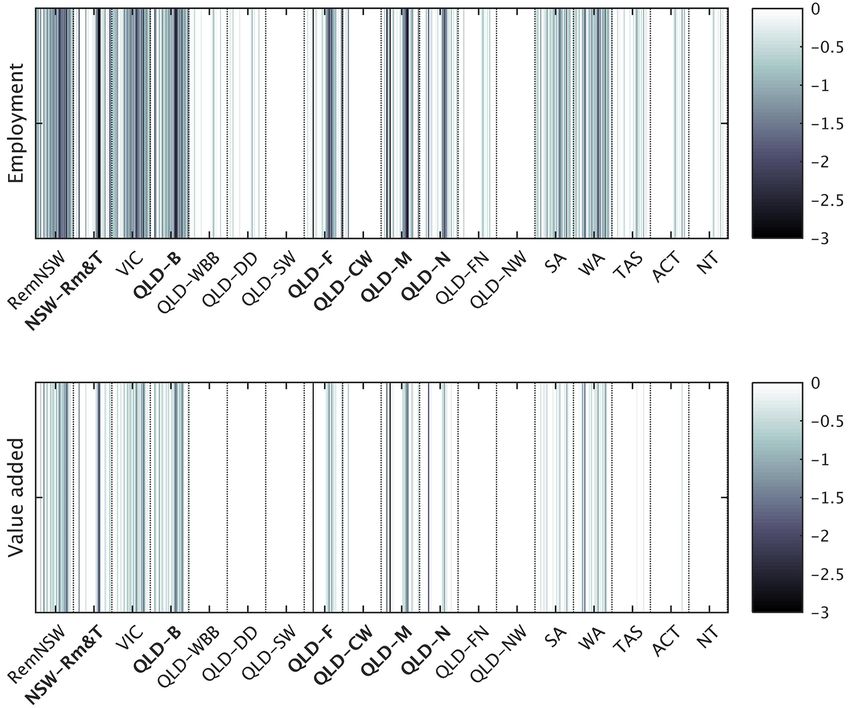
138                                                                      M. Lenzen et al.: Economic damage and spillovers

were closed and tourism industries were heavily impacted.         footprints (Wiedmann, 2009) and global value chains (Tim-
Roads, rail systems and bridges were damaged or destroyed,        mer et al., 2014), and in the disciplines of life cycle assess-
along with community halls, airfields, telecommunications         ment (Suh and Nakamura, 2007) and industrial ecology (Suh,
and other systems. All schools and many businesses were           2009).
temporarily closed. The Australian Government responded              This article is structured as follows: Sect. 2 provides a re-
at all levels including federal military deployment of air, sea   view of relevant prior work and the state of knowledge in IO-
and land support, Queensland Police, Fire and Emergency           based disaster analysis and describes the methodology under-
and State Emergency Systems.                                      lying the disaster analysis undertaken using IO modelling. In
   Severe tropical cyclones are not an isolated phenomenon.       particular, we build on prior work (Schulte in den Bäumen
Past tropical cyclones, in Australia and elsewhere, have dis-     et al., 2015) and present an innovative approach for estimat-
rupted food systems, for example in Madagascar (Cyclone           ing infrastructure damages resulting from the disaster. We
Gafilo in 2004), Vanuatu (Cyclone Pam in 2015) and Fiji           present the results and a discussion of key findings in Sect. 3,
(Cyclone Winston in 2016). In 2006, Cyclone Larry and 2011        followed by conclusions in Sect. 4.
Cyclone Yasi (Staff, 2017) led to shortages of bananas in
Australia (Brown, 2017).
   Direct economic damage caused by Debbie is signifi-
cant: it has been estimated to include AUD 1.5 billion in lost    2   Methods
coal sales and approximately AUD 0.5 billion in agriculture,
with major adverse impacts on sugar cane and winter hor-          In this paper, we determine the supply-chain impacts of Trop-
ticulture supplies to southern Australia. Infrastructure dam-     ical Cyclone Debbie, using highly disaggregated MRIO tools
age has been estimated at over AUD 1 billion (Queensland          (Sect. 2.2 and 2.3) developed within the new Australian In-
Government, 2017). Flood damage to business and trade             dustrial Ecology Virtual Laboratory (IELab) (see Sect. 2.5).
was also significant in northern New South Wales (the state       Our approach incorporates a number of unique and pow-
south of Queensland). Debbie also caused temporary short-         erful capabilities. First, we are able to identify the conse-
ages to water and energy supplies (Parnell, 2017), damaged        quences of the cyclone, not only for the directly affected re-
information technology infrastructure and led to price in-        gions and industry sectors but for the wider Australian econ-
creases for tomatoes, capsicums, eggplants and other veg-         omy. Such indirect effects stem from afflicted businesses be-
etables (Hatch, 2017), affecting winter vegetable supply for      ing unable to supply goods and services and from their in-
Sydney and Melbourne. Across all sectors insurance claims         ability to acquire necessary production inputs from suppli-
of over AUD 300 million were lodged (Underwriter, 2017).          ers. As the economy is an integrated chain of production and
   Given that the frequency of extreme weather events such        consumption, suppliers and consumers associated with dam-
as tropical cyclones will increase due to climate change          aged business are also affected, and economic activity winds
(Mendelsohn et al, 2012), developing and testing methods          down elsewhere. Such effects are called indirect impacts or
for assessing economic consequences of natural disasters is       spillovers (regional and sectoral). Capturing spillovers high-
of growing importance. In our case study, this significance       lights the innovative strength of the Australian IELab, which
is reinforced in view of the importance of northern Australia     offers unprecedented spatial resolution and hence allows for
in plans for the nation’s ongoing economic development, no-       a comprehensive assessment of the direct as well as indirect
tably in mining and agriculture (Regional Institute of Aus-       supply-chain effects of disasters. In addition, the IELab of-
tralia, 2013).                                                    fers sophisticated tools that, to our knowledge, have so far
   In this work, we use multi-region economic input–output        not been applied to disaster analysis: for example, produc-
(MRIO) analysis to investigate the economy-wide repercus-         tion layer decomposition is able to pinpoint the sequence
sions of the biophysical damage wrought by Tropical Cy-           of indirect impacts rippling across the regional supply-chain
clone Debbie upon the North Queensland region of Australia.       network. One additional advanced capability is the in-built
More specifically, we quantify the upstream supply chain im-      data-updating functionality in the IELab, allowing for the in-
pacts of the cyclone using input–output (IO) analysis. As         clusion of recent economic and social data and enabling the
developed from Leontief’s work in the 1930s, IO analysis          timely and cost-effective analysis of disaster impacts to sup-
is capable of interrogating economic data on inter-industry       port expeditious decision-making. Finally, the IELab also of-
transactions, final consumption and value added, in order to      fers data sets and analytical tools for assessing the local and
trace economic activity rippling throughout complex supply-       regional effects in terms of a range of physical indicators,
chain networks and to unveil both immediate and indirect          such as carbon dioxide emissions, water use, energy use and
impacts of systemic shocks (Leontief, 1966). Over the past        waste, to name a few. While such an assessment is beyond
70 years, IO analysis has been used extensively for a wide        the scope of this study, this is surely an area of research that
range of public policy and scientific research questions (Rose    warrants further investigation.
and Miernyk, 1989). Over the past two decades, IO analysis           In the following we will first provide a review of prior
has experienced a surge in applications, especially in carbon     work on IO-based disaster analysis and then explain IO the-

Nat. Hazards Earth Syst. Sci., 19, 137–151, 2019                           www.nat-hazards-earth-syst-sci.net/19/137/2019/
M. Lenzen et al.: Economic damage and spillovers                                                                                139

ory, disaster analysis, our case study, and utilised data and        Using the dynamic version of IIOM, it is possible to assess
updating processes.                                                  recovery times and also to identify and prioritise systems and
                                                                     sectors that are most economically critical for guiding the re-
2.1   Input–output based disaster analysis – a review                covery process (Haimes et al., 2005).
                                                                        One particular type of disaster IO analysis, proposed by
IO analysis studies feature a sub-stream dealing with disas-         Steenge and Bočkarjova (2007) aims to investigate post-
ter analysis. Okuyama (2007) provides a comprehensive re-            disaster consumption possibilities as a consequence of pro-
view of the use of IO analysis for economic analysis of disas-       duction shortfalls resulting from a disaster. As this method
ters. Quantitative disaster analysis is needed for understand-       uses Leontief’s demand-driven model, it captures back-
ing the impacts of a disaster, for driving effective disaster re-    ward, upstream supply-chain impacts resulting from a dis-
sponse, for informing disaster risk reduction and adaptation         aster. Such an assessment has been applied, for example to
efforts and for pre-emptive planning and decision-making             widespread flooding in Germany (Schulte in den Bäumen
(Cannon, 1993; Lesk et al., 2016; Prideaux, 2004; Temmer-            et al., 2015) and electricity blackouts from possible severe
man et al., 2013). It is intuitively clear that a disaster results   space weather events (Schulte in den Bäumen et al., 2014).
in direct losses in the form of infrastructure damages and in-       Here, we apply this method for the first time to undertake
direct higher-order effects in the form of subsequent losses         an estimation of post-disaster consumption possibilities, and
in business activity (Rose, 2004). The ability of IO anal-           subsequent losses in employment and economic value added
ysis to capture the upstream interconnected supply chains            resulting from the 2017 Tropical Cyclone Debbie in Aus-
of an industry or region affected by a disaster makes it an          tralia. To this end, we use the Australian IELab to construct
ideal tool for assessing the full scope of impacts of a dis-         a customised subnational MRIO table for Australia with ex-
aster event. In addition to IO analysis, computable general          tensive detail on regions directly affected by the cyclone. In
equilibrium (CGE) models, econometric models and social              particular, and this is the novelty of our research, we exam-
accounting matrices (SAM) are alternative modelling frame-           ine detailed, disaggregated regional and sectoral spillovers
works for estimating the indirect higher-order effects of a          including the consequences of this cyclone not only for di-
disaster (Cole, 1995; Guimaraes et al., 1993; Koks et al.,           rectly affected regions and industry sectors, but also for the
2016; Koks and Thissen, 2016; Okuyama, 2007; Okuyama                 wider national economy.
and Santos, 2014; Rose and Guha, 2004; Rose and Liao,
2005; Tsuchiya et al., 2007). A discussion of these models is        2.2   Input–output disaster analysis – mathematical
beyond the scope of this study and we focus on IO analysis,                formulation
in particular the post-disaster consumption possibilities and
possible spillovers (explained further below). IO modelling          A specific stream of IO analysis is disaster analysis
has been applied to many disasters such as earthquakes in            (Okuyama, 2014, 2007), focused on IO databases employed
Japan (Okuyama, 2014, 2004), floods in Germany (Schulte              to explore how an economy can be affected by a sudden slow-
in den Bäumen et al., 2015) and London (Li et al., 2013),            down or shutdown of individual industries. Since we are pri-
terrorism (Lian and Haimes, 2006; Rose, 2009; Santos and             marily interested in post-disaster consumption possibilities
Haimes, 2004), hurricanes (Hallegatte, 2008) and blackouts           and ensuing employment and value-added loss, we utilise the
(Anderson et al., 2007) in the USA, as well as diseases and          approach by Steenge and Bočkarjova (2007). In essence, a
epidemics (Santos et al., 2013, 2009), to name a few.                disaster reduces total economic output x 0 of industry sectors
   Prior research on disaster impact analysis, based on IO           1, . . ., N to levels
analysis, has sought ways of improving the standard IO               x = (I − 0) x 0 ,
                                                                     e                                                          (1)
model, for example by extending the standard framework to
include temporal and spatial scales (Okuyama, 2007). For             where 0 is a diagonal matrix of fractions describing sectoral
example, Donaghy et al. (2007) propose a flexible frame-             production losses as a direct consequence of the disaster, and
work for incorporating short- and long-time frames using             I is an identity matrix with the same dimensions as 0. The
the regional econometric IO model (REIM), and Yamano                 entries of 0 are populated on the basis of primary data, in
et al. (2007) apply a regional disaggregation method to a            our case about cyclone Debbie (Sect. 2.4). Post-disaster con-
MRIO model to estimate higher-order effects according to             sumption possibilities y 1 are then the solution of the linear
specific districts. Furthermore, a so-called “inoperability in-      problem
dex” within the inoperability input–output model (IIOM) has          max(1y 1 )s.t. (i) y 1 = (I − A)x 1                        (2)
been proposed as a way of assessing the effect of a disaster         (ii) x 1 ≤ e
                                                                                x , and (iii) y 1 ≥ 0,
or initial perturbation on interconnected systems (Haimes et
al., 2005). Both the static and the dynamic versions of IIOM         where 1 = {1, 1, . . ., 1} is a summation operator, A = Tx 1 −1
have been applied to the case of terrorism for assessing the         is a matrix of input coefficients, T is the intermediate trans-
economic losses resulting from interdependent complex sys-           action matrix, the “ˆ” (hat) symbol denotes vector diagonal-
tems (Lian and Haimes, 2006; Santos and Haimes, 2004).               isation, and x 1 is the post-disaster total economic output.

www.nat-hazards-earth-syst-sci.net/19/137/2019/                                Nat. Hazards Earth Syst. Sci., 19, 137–151, 2019
140 M. Lenzen et al.: Economic damage and spillovers
Constraint (i) in Eq. (2) is the standard fundamental IO ac- 2.4 Case study: Tropical Cyclone Debbie
counting relationship stating that in every economy interme-
diate demand T and final demand y sum up to total output In order to quantify indirect economic impacts of Cyclone
x. This can be seen by writing y 1 = (I − A)x 1 = x 1 − T1 ⇔ Debbie, we first constructed a 19-region-by-34-sector IO
T1 + y 1 = x 1 . Constraint (ii) states that in the short term, model of Australia, with a particular regional detail for the
post-disaster total output is limited by pre-disaster total out- regions close to disaster centres, that is, 10 subregions of
put minus disaster-induced losses. Constraint (iii) ensures Queensland as well as northern New South Wales (see also
that final demand is strictly positive. Fig. 1). The compilation of this table and underlying data are
Condition (i) is different from the approach in Steenge and outlined in Sect. 2.5.
Bočkarjova, because we need to ensure the positivity of final
demand y. Taking these authors’ equation (Eq. 23) and re- 2.4.1 Reduction in industry output and creation of the
calculating for gamma matrix
0.2 0 In order to estimate indirect consequences of Cyclone Deb-
I−0 = ,
0 0.8 bie, we further developed the method of Schulte in den Bäu-
we obtain negative post-disaster consumption possibilities men et al. (2015) and created the so-called gamma matrix,
a diagonal matrix of fractions 0i (see Eq. 1), describing re-
−1 32.4 . duced post-disaster production possibilities (19 × 34 region-
sector pairs). We determined the relative reductions in indus-
Our approach would yield the post-disaster situation
try output by (a) sourcing public information on actual or
estimated financial damages and (b) dividing these by gross
0.25 0.4 20 0 20
+ = , output taken from our MRIO table. Information on damages
0.14 0.12 37.5 30.2 37.5
included (a) the reduction of total industry output (in 2017
with non-negative post-disaster final demand and with post- compared to 2016), plus (b) an annualised value of infras-
disaster output tructure damage, as explained below. A value of 0i = 0.1
20
20
indicates a 10 % loss of production value (including related
x1 = x=
≤e . infrastructure costs) from 2016 to 2017. Information on the
37.5 40
direct damages by the cyclone was sourced from a range of
2.3 Disaster impact on value added and employment published government reports, informal enquiries to govern-
ment offices, government and research websites, media re-
A disaster-induced transition to lower consumption levels leases and many other media and industry reports and on-
y 1 = y 0 − 1y has implications for the state of regional line sources. Table 1 provides a summary of the main im-
economies, as it causes losses in value added and employ- pacts – further details and related data sources are provided in
ment Sect. S2.2 in the Supplement, including a summary of infras-
tructure damage caused by the cyclone shown in Table S2.3
1Q = q1x = q(I − A)−1 1y, (3)
in the Supplement. The reliability of the damage estimates
where q holds value-added and employment coefficients. varies, as they were sourced from different data sets. Cross-
The sequence of these losses can be enumerated by carrying validation using multiple sources was attempted where pos-
out a production layer decomposition, that is by unravelling sible. This was possible for some major sector groups (no-
the inverse in Eq. (3) into an infinite series (see Waugh, 1950) tably coal with its close monitoring by government author-
as ities). The rapid nature of the assessment also creates some
uncertainties and error potential, and the values should be
1Q = q1y + qA1y + qA2 1y + +qA3 1y + . . . (4) treated as estimates. Ideally, they should be validated or up-
X∞
= qAn 1y, dated when the more accurate costs become known.
n=0
where the term q1y represent the job and value-added losses 2.4.2 Estimation of infrastructure damage
borne by producers immediately affected by the reduction
of consumption possibilities due to the cyclone, qA1y de- Infrastructure damage from the cyclone in the state of
scribes first-order losses fielded by suppliers of cyclone- Queensland was estimated at well over a billion dollars
affected producers, qA2 1y 2nd-order losses for suppliers of (Queensland Government, 2017). The localities of Mackay
suppliers and so on for subsequent upstream production lay- and Fitzroy had bridges, roads, airport, community infras-
ers. First- and higher-order upstream losses can in principle tructure, water and wastewater treatment plants that were
occur anywhere in Australia, depending on the reach of the damaged or destroyed. Severe damage was also noted in
supply-chain network of local northern Queensland produc- Richmond–Tweed (from significant flooding) and in the
ers. Brisbane region (over seven bridges were damaged, signif-
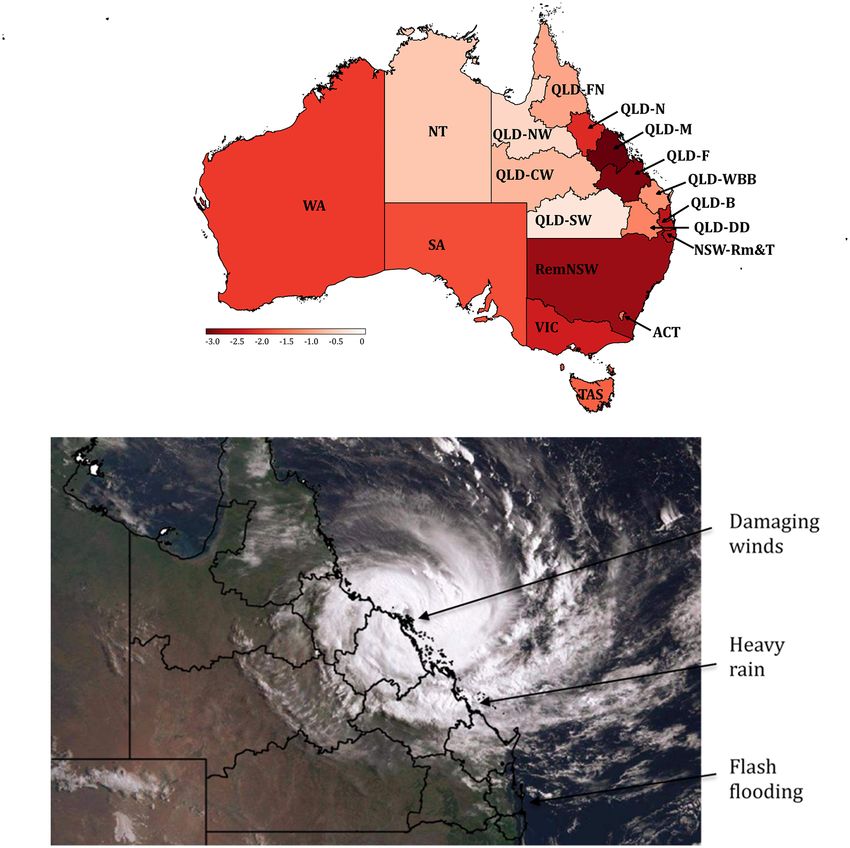
Nat. Hazards Earth Syst. Sci., 19, 137–151, 2019 www.nat-hazards-earth-syst-sci.net/19/137/2019/M. Lenzen et al.: Economic damage and spillovers 141 Figure 1. Geographical distribution of value-added loss caused by Tropical Cyclone Debbie. Value-added (VA) loss is expressed as 1 VA = q VA (I − A)−1 1y. A comparison of our results (top, −log10 (1VA), with 1VA in AUD m) with a satellite image of the cyclone (ABC, 2017) (bottom) shows losses in northern Queensland regions as a direct consequence of the destructive winds and losses in southern Queensland and northern NSW as a result of heavy rain and floods occurring in the cyclone’s wake. Region acronyms: RemNSW is the rest of New South Wales (NSW), NSW-Rm & T is NSW Richmond & Tweed, VIC is Victoria, QLD-B is Queensland (QLD) – Brisbane, QLD-WBB is Wide Bay Burnett, QLD-DD is Darling Downs, QL-SW is South West, QLD-F is Fitzroy, QLD-CW is Central West, QLD- M Mackay, QLD-N is North, QLD-FN is Far North, QLD-NW is North West, SA is South Australia, WA is Western Australia, TAS is Tasmania, ACT is Australian Capital Territory, NT is Northern Territory. Note that the Brisbane region in this study covers and area similar to an area generally referred to as “South-east Queensland”. icant degradation of at least 350 local roads and 200 major ital productivity by the ratio of gross output and gross op- culverts etc.), as well as in northern Queensland (see Supple- erating surplus: πi = xi /GOSi . Values for annual losses of ment Sect. S2 for details). fixed capital inputs 1ci were obtained by annualising the As an innovation of the work of Schulte in den Bäu- total value of infrastructure damages, using a 25-year time men et al. (2015), we estimated infrastructure damage and frame for capital depreciation. A similar, more generalised its attribution to sectors of the economy using an “infras- approach has been outlined by Hallegatte (2008). The total tructure gamma matrix” and added this to the matrix de- production loss coefficients (fractions in 0) were calculated scribing production shortfalls (Sect. 2.4.1). In addition to by adding the current output losses and the losses induced the conventional current output losses, we attempted to es- by infrastructure damage (Table 2). The main infrastructure timate production shortfalls 1x caused by damages to cap- impacts of the cyclone were borne in sectors such as elec- ital infrastructure such as roads. In principle, gamma ma- tricity, gas, water, trade, accommodation, cafes, restaurants, trix entries describing infrastructure damages can be esti- road transport, rail and pipeline transport, other transport and mated using information on the productivity of capital π , communication services. as 0i = 1xi /x0,i = πi 1ci /x0,i , where 1ci are annual losses of fixed capital inputs. To this end, we approximated cap- www.nat-hazards-earth-syst-sci.net/19/137/2019/ Nat. Hazards Earth Syst. Sci., 19, 137–151, 2019
142                                                                               M. Lenzen et al.: Economic damage and spillovers

Table 1. Summary of major direct impacts (see Sect. S2 for details and sourcing).

      Aspect           Region                Industries                Example impact
      Coal exports     All QLD               Coal, oil and gas         Coal exports may have taken a AUD 1.5 billion hit from Cyclone Deb-
                                                                       bie as more than 22 mines were forced to halt production while roads
                                                                       and ports were shut.
      Sugar cane       QLD- Mackay           Sugar cane growing        Damage to Queensland’s sugar industry is expected to cost
                                                                       AUD 150 million (USD 114.4 million). The majority of these costs lie
                                                                       in Proserpine and Mackay.
      Vegetables       QLD-Mackay            Other agriculture         The Queensland Farmers Federation (QFF) said early figures
                                                                       show actual crop damage to Bowen’s vegetable industry is about
                                                                       AUD 100 million, accounting for about 20 percent of the season’s
                                                                       crop.
      Vegetables       NSW Richmond          Other agriculture         Lost nut production of approximately AUD 8 million.
                       & Tweed
      Agriculture,     All QLD regions       Grains                    The National Farmers’ Federation has cited industry groups estimat-
      grains and       and NSW                                         ing damage to crops of up to AUD 1 billion.
      sugarcane        Richmond & Tweed.
                                             Other agriculture
                                             Sugar cane growing
      Business         NSW Richmond          Accommodation, cafes,     50 to 80 percent of these businesses will not reopen in the community
                       & Tweed.              and restaurants, trade    of 50 000 people.
      Dairy            QLD – Brisbane        Dairy cattle and pigs     It is anticipated that the cost to the farming industry in southeastern
                                                                       Queensland will be in excess of AUD 6 million.
      Infrastructure   All QLD               Multiple industries       The cost of recovery would “be in the billions” of dollars, with roads,
                                                                       bridges, crops, homes and schools all needing serious repairs.
      Insurance        All 19 regions        Multiple industries       Insurance losses of AUD 306 million. Over a AUD 1 billion in insur-
                       (with most focus                                ance claims.
                       on QLD and
                       northern NSW)
      Fatalities       –                     –                         12 fatalities.
      Evacuation       –                     –                         25 000 residents evacuated in Mackay and 55 000 in Bowen.
      costs

      Schools          –                     –                         400 schools closed.

      Air flights      –                     –                         Many airline flights were cancelled to and from Townsville beginning
                                                                       March 27. Cyclone Debbie contributes significantly to Virgin Airlines
                                                                       loss of AUD 63 million in the 3 months to the end of March 2017.
      Rail             –                     –                         QLD Rail suspended trains between Rocky and Townsville
                                                                       NQ Bulk Ports closed at Mackay, Abbot Point and Hay Point.
      Emergency        –                     –                         1000 emergency workers deployed, 200 Energex workers.
      workers
      Defence          –                     –                         1200 personnel deployed.
      forces

2.4.3    Qualifications                                                 substitution effects, due to the unavailability of replaceable
                                                                        production inputs. As such, this study covers only a sub-
First, since this study uses Leontief’s demand-driven IOA               set of Oosterhaven (2017) classifications of potential dis-
version, we are only able to quantify backward or upstream              aster impacts. A more comprehensive but also significantly
supply-chain effects, such as impacts from decline of de-               more data-hungry approach would be to use dynamic CGE
mands due to damages to production facilities and changed               modelling; however in this context Steenge and Bočkarjova
consumption possibilities. We are unable to quantify the for-           (2007) warn against overly optimistic assumptions regarding
ward or downstream effects of supply-side shocks, due to                market flexibility and substitution. A promising way forward
the unavailability of non-replaceable production inputs, or

Nat. Hazards Earth Syst. Sci., 19, 137–151, 2019                                    www.nat-hazards-earth-syst-sci.net/19/137/2019/
Table 2. Entries of the 0 matrix (fractional production losses) including (a) industry output and (b) infrastructure costs annualised over 25 years. Note that a fraction of 0.1 means a
10 % reduction in reduced production (between 2016 and 2017) including both lost productivity plus a share of cost relating to infrastructure damage (annualised over 25 years).
Rest of NSW- VIC QLD- QLD-Wide QLD-Darling QLD-South QLD- QLD-Central QLD- QLD- QLD-Far QLD- SA WA TAS ACT NT
NSW Richmond Brisbane -Bay-Burnett Downs West Fitzroy West Mackay Northern North North West
– Tweed
1 Sheep 0 0 0 0 0 0 0 0 0 0 0 0 0 0 0 0 0 0
2 Grains 0 0 0 0 0 0 0 0 0 0 0 0 0 0 0 0 0 0
3 Beef cattle 0 0 0 0 0 0 0 0 0 0 0 0 0 0 0 0 0 0
4 Dairy cattle and pigs 0 0 0 0.110 0 0 0 0 0 0 0 0 0 0 0 0 0 0
5 Other agriculture 0 0.070 0 0 0 0 0 0 0.186 0.530 0 0 0 0 0 0 0 0
6 Sugar cane growing 0 0 0 0 0 0 0 0.035 0 0.263 0.112 0 0 0 0 0 0 0
7 Forestry and fishing 0 0 0 0 0 0 0 0 0 0 0 0 0 0 0 0 0 0
www.nat-hazards-earth-syst-sci.net/19/137/2019/
8 Coal, oil and gas 0 0 0 0 0 0 0 0.056 0 0.053 0.078 0 0 0 0 0 0 0
M. Lenzen et al.: Economic damage and spillovers
9 Non-ferrous metal ores 0 0 0 0 0 0 0 0 0 0 0 0 0 0 0 0 0 0
10 Other mining 0 0 0 0 0 0 0 0 0 0 0 0 0 0 0 0 0 0
11 Food manufacturing 0 0 0 0 0 0 0 0 0 0 0 0 0 0 0 0 0 0
12 Textiles, clothing and footwear 0 0 0 0 0 0 0 0 0 0 0 0 0 0 0 0 0 0
13 Wood and paper manufacturing 0 0 0 0 0 0 0 0 0 0 0 0 0 0 0 0 0 0
14 Chemicals, petroleum and coal products 0 0 0 0 0 0 0 0 0 0 0 0 0 0 0 0 0 0
15 Non-metallic mineral products 0 0 0 0 0 0 0 0 0 0 0 0 0 0 0 0 0 0
16 Metals, metal products 0 0 0 0 0 0 0 0 0 0 0 0 0 0 0 0 0 0
17 Machinery appliances and equipment 0 0 0 0 0 0 0 0 0 0 0 0 0 0 0 0 0 0
18 Miscellaneous manufacturing 0 0 0 0 0 0 0 0 0 0 0 0 0 0 0 0 0 0
19 Electricity supply, gas and water 0 0.004 0 0.001 0 0 0 0.003 0 0.020 0.001 0 0 0 0 0 0 0
20 Residential building construction 0 0.016 0 0 0 0 0 0.015 0 0.020 0.013 0 0 0 0 0 0 0
21 Other construction 0 0.000 0 0 0 0 0 0 0 0 0 0 0 0 0 0 0 0
22 Trade 0 0.042 0 0.002 0 0 0 0.017 0 0.013 0.010 0 0 0 0 0 0 0
23 Accommodation, cafes and restaurants 0 0.220 0 0.005 0 0 0 0.005 0 0.100 0.005 0 0 0 0 0 0 0
24 Road transport 0 0.016 0 0.002 0 0 0 0.051 0 0.082 0.009 0 0 0 0 0 0 0
25 Rail and pipeline transport 0 0 0 0 0 0 0 0.014 0 0 0 0 0 0 0 0 0 0
26 Other transport 0 0 0 0 0 0 0 0.006 0 0 0 0 0 0 0 0 0 0
27 Communication services 0 0 0 0 0 0 0 0.011 0 0.032 0.001 0 0 0 0 0 0 0
28 Finance, property and business services 0 0 0 0 0 0 0 0 0 0 0 0 0 0 0 0 0 0
29 Ownership of dwellings 0 0 0 0 0 0 0 0 0 0 0 0 0 0 0 0 0 0
30 Government administration and defence 0 0 0 0 0 0 0 0 0 0 0 0 0 0 0 0 0 0
31 Education 0 0 0 0 0 0 0 0 0 0 0 0 0 0 0 0 0 0
32 Health and community services 0 0.007 0 0 0 0 0 0 0 0 0 0 0 0 0 0 0 0
33 Cultural and recreational services 0 0.021 0 0.002 0 0 0 0.056 0 0.097 0.006 0 0 0 0 0 0 0
34 Personal and other services 0 0 0 0 0 0 0 0.055 0 0 0 0 0 0 0 0 0 0
Nat. Hazards Earth Syst. Sci., 19, 137–151, 2019
143144 M. Lenzen et al.: Economic damage and spillovers
is the linear programming approach by Oosterhaven and of 2214 statistical areas (level 2; ABS, 2016f) to delineate
Bouwmeester (2016) in which the authors minimise the in- MRIO regions with their specific research question. The re-
formation gain between pre- and post-disaster inter-regional gional and sectoral flexibility of the IELab (see Lenzen et al.,
IO tables. 2017a) was exploited by generating a regional partition of
Second, in compiling the gamma matrices, damages were Australia that is more detailed around the regions where the
only considered where we could find empirical monetary cyclone caused most of its damage (Queensland and north-
information. With respect to modelling the effect of cap- ern New South Wales) and less detailed elsewhere (Fig. 1).
ital infrastructure damages on production, we were bound As a sectoral breakdown we used the 34-sector industry clas-
by the gamma-matrix formalism of the Steenge-Bočkarjova sification from the Queensland regional IO database (OGS,
method. We note that other more detailed and sophisticated 2004); see Supplement Sect. S1).
modelling frameworks have been used, such as Tsuchiya et A number of national, state and region-specific data
al. (2007). sources were used for constructing the MRIO database used
Finally, beneficial effects can result from natural disas- in this work. These are the income, expenditure and product
ters. In Queensland for example, the replacement or repairs accounts (ABS, 2016c); the IO tables (ABS, 2016b, 2017b)
to damaged buildings and infrastructure, or any other de- for the national level; the accounts (ABS, 2016a) and the
mand for commodities required especially for post-disaster Queensland IO tables (OGS, 2002) for the state level; the
recovery, is likely to have created additional employment and household expenditure survey (ABS, 2011); Queensland re-
value added and may have spawned technology updates. In gional IO tables (OGS, 2004); the business register (ABS,
addition, above-average rainfall may have been beneficial for 2016d); the census (ABS, 2012) and the agricultural com-
pastures and water supply, and increased freshwater run-off modities survey (ABS, 2016g) for the regional level. Detailed
and turbidity could have increased catches of prawn trawling. regional employment data were taken from the labour force
As no data were available for quantifying such repercussions, survey (ABS, 2016e).
these effects are not accounted for in our study.
2.5.1 Primary economic data
2.5 Data
In order to be meaningful, any regional IO analysis needs to
We used the Australian Industrial Ecology Virtual Labora- be supported by specific regional data (see an IELab-based
tory (IELab; Lenzen et al., 2014) to construct a customised analysis of Western Australia by Lenzen et al. (2017a). We
subnational MRIO table (including the input coefficients ma- therefore sourced primary economic data to update the IO
trix A and initial total output x 0 ) for Australia with extensive data for subregions and sectors most affected by Cyclone
detail on regions directly affected by the cyclone. The IELab Debbie, with the most recent financial and economic infor-
is a cloud-computing environment that allows for the con- mation available. In particular, data were sought covering
struction of customised IO databases. IO tables document the value of production, total output, salaries paid, gross op-
flow of money between various industries in an economy – erating values, regional export, turnover and regional eco-
national IO tables present national data on intra- and inter- nomic productivity (Table 3). Key resources identified in-
industry transactions between industries in a national econ- cluded detailed government analyses of gross regional prod-
omy, whereas MRIO tables harbour detailed data on trade uct in the 10 Queensland regions (Queensland Treasury and
between two different regions (Tukker and Dietzenbacher, Trade, 2013) and northern NSW (Wilkinson, 2014).
2013); see Leontief (1953) for an account of MRIO the- Primary data collection was also targeted to those sectors
ory. MRIO tables can either be global or subnational. Global most influenced by the cyclone in order to improve the reli-
tables feature more than one country and provide detailed ability of the estimate of primary damage. For example, to
data on international trade between countries, whereas sub- improve the accuracy of coal productivity data, correspon-
national MRIO tables provide detailed trade data for regions dence and consultation were initiated with the Queensland
within one country. These tables have been extensively used Department of Natural Resources and Mines. This yielded
for undertaking environmental, social and economic foot- high-resolution information on production value data at SA4
print assessments (Alsamawi et al., 2014; Hertwich and Pe- level (statistical area level 4) across Queensland. Importantly,
ters, 2009; Lenzen et al., 2012; Oita et al., 2016; Simas et al., this also identified which of the study regions produced neg-
2014; Wiedmann et al., 2013). Coupling of economic MRIO ligible coal and this information was also included as a con-
data with so-called physical accounts, as conceived by Nobel straint in the MRIO balancing process.
Prize winner Wassily Leontief in the 1970s, allows for the Key sources of information included accounts published
enumeration of direct as well as indirect supply-chain im- by the Australian Bureau of Statistics (ABS), e.g. cover-
pacts (Leontief, 1970, 1966). ing the gross value of agriculture and manufacturing sales
The IELab is capable of generating MRIO databases, and wages. Grey literature including regional economic stud-
wherein industry sectors can be distinguished for a number ies, value of production accounts kept by state agencies, and
of Australian regions. Users are able to choose from a set treasury investigations also provided important data within
Nat. Hazards Earth Syst. Sci., 19, 137–151, 2019 www.nat-hazards-earth-syst-sci.net/19/137/2019/Table 3. Summary of primary economic data used as constraints in compilation of the MRIO. (All values in AUD 2017 unless period otherwise specified).
Data aspect Region Sector(s) Years Example data Reference
GRP All Queensland All 2010–2011 GRP Mackay 2011 = AUD 22 billion Queensland Treasury
subregions. and Trade (2013)
GRP – Richmond NSW – Richmond & All 2011–2012 GRP > AUD 8.5 billion Wilkinson (2014)
& Tweed Tweed
Coal QLD – all regions Coal, oil and gas 2015–2016 Production value by SA4∗∗ area, Keir (2017)
e.g. AUD 19.437 billion sales for 2015–2016
www.nat-hazards-earth-syst-sci.net/19/137/2019/
calendar year with AUD 12.234 billion in SA4
M. Lenzen et al.: Economic damage and spillovers
Mackay; and AUD 6.170 billion in Fitzroy
Import and export of QLD – all regions Part of other agriculture 2014–2015 AUD 112.9 million of horticulture products im- (Horticulture Innovation
horticulture products port; AUD 156.8 million of horticulture prod- Australia, 2016)
ucts export
Gross value and local SA4 region Over 60 agricultural 2007–2008 to AUD 1.119 million gross value of agricultural ABS (2016g)
value of Agricultural Com- commodities 2014–2015 commodities produced in Mackay in
modities 2014–2015
Manufacturing sales & 10 QLD regions Food product manufac- 2006–2007 Food product manufacturing in ABS (2008)
service income, wages and NSW – Rich- turing and all other is latest Mackay = AUD 1.051 million in 2007
and salaries, employment mond & Tweed manufacturing
Manufacturing sales & QLD – all regions Food product manufac- 2010–2011 to Food product manufacturing in ABS (2017a)
service income, wages turing and all other 2014–2015 QLD = AUD 20.131 million in 2015.
and salaries, employment manufacturing
∗ GRP is gross regional product. ∗∗ SA4 is statistical area 4
Nat. Hazards Earth Syst. Sci., 19, 137–151, 2019
145146 M. Lenzen et al.: Economic damage and spillovers
which to constrain the reconciliation of our MRIO base ta- These additional losses are shown in the production layers
ble. that follow.
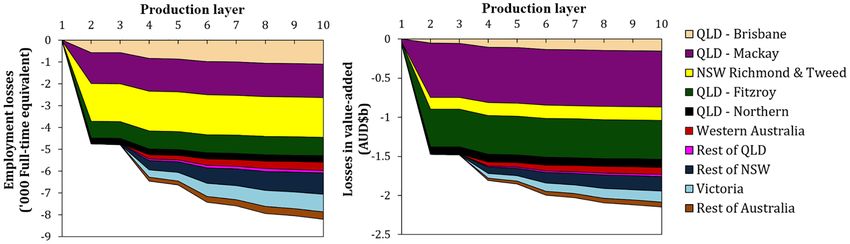
As shown in Fig. 2, about 4800 jobs were directly affected
(production layers 1 & 2) and an additional 3700 indirectly
3 Results and discussion (from production layer 2 onward). The combined sectoral
and regional spillovers are therefore significant.
In this section, we first present an analysis of the magnitude While the coastal areas of northern Queensland, Mackay,
of the direct impacts and economic spillovers of Cyclone Fitzroy, Brisbane (in South Queensland) and northern New
Debbie (in Sect. 3.1). We then further explore the nature of South Wales (Richmond–Tweed area) were affected imme-
these spillovers by production layers and by detailed prod- diately by storm and flood damage, repercussions were sub-
ucts (Sect. 3.2). Finally, the implications for disaster recovery sequently felt in the rest of the affected regions and later on
plans (Sect. 3.3) and the outlook (Sect. 3.4) are discussed. within the rest of Australia. Losses in value added and em-
ployment cascaded throughout inter-regional supply chains,
3.1 Overview of spillovers as subsequent transactions were cancelled. Shortfalls were
noticeable even by distant suppliers, removed from directly
Not surprisingly, Tropical Cyclone Debbie wreaked the most affected producers by four or more transaction nodes (Fig. 2).
intense havoc where it made landfall, in the regions of Our production layer assessment reveals the employment
Mackay (QLD-M), Fitzroy (QLD-F) and northern Queens- and value-added losses in different layers of production.
land (QLD-N), and where heavy rains caused widespread Each of these layers are comprised of a range of industries.
flooding, around Brisbane (QLD-B) and in northern New It is important to identify the industries affected in different
South Wales (NSW-Rm & T; see Fig. 1). There is not a sin- layers of production. Our assessment shows that while only
gle region in the remainder of Australia that is unaffected by a selected number of industries and regions were directly af-
the cyclone. In the multi-region IO disaster model in Eq. (2), fected by the storm and flooding (coal, tourism, sugar cane,
these spillovers come about because businesses experienc- road transport, vegetable growing; black stripes in Fig. 3),
ing production losses are unable to supply their clients and these direct losses resulted in many more indirect losses in
also cancel orders for their own inputs, thus leaving busi- the upstream supply chain. We further analysed the losses in
nesses elsewhere with reduced activity. Our results for indi- different layers of production (Fig. 2) and identified the top
rect damage are obtained from a model and as such might 20 sectors that experienced the greatest total (direct and indi-
only approximate the damage that really occurred in the re- rect) employment and value-added losses.
gions. However, an application of the same model to a case The top-ranking industries affecting employment directly
study in which indirect effects were known (see Fig. 5 in and elsewhere are those connected to tourism (such as ac-
Lenzen et al., 2017b) shows that measured outcomes were commodation, restaurants, recreational services and retail
reproduced with reasonable accuracy. trade (see Table 4 and Fig. 3). In the Richmond–Tweed area
Our results show that tropical Cyclone Debbie affected of New South Wales, 1132 jobs were affected directly in ac-
about 8487 jobs (Fig. 2) and caused a loss in value added commodation, cafes and restaurants, and about 466 indirectly
of about AUD 2.2 billion (Fig. 2). Employment losses are ex- in other industries and regions due to supply-chain effects
pressed in terms of full-time equivalent (FTE) employment (spillover). Similar effects are observed in Mackay and Bris-
temporarily affected. Full-time equivalent means that part- bane in Queensland. The temporary coal mine shutdown in
time jobs are expressed as fractional full-time jobs, so that Mackay and Fitzroy affected as many jobs indirectly as di-
they are added into a total. The time span of a job disruption rectly. Damaged and closed roads affected road transport es-
may range between a number of weeks, for example for coal tablishments and almost equally the industries that depended
mines that could be re-opened soon after the cyclone; (Ker, on them. Likewise, value-added losses are observed both di-
2017; Robins, 2017) and 1 year (for example tree crops that rectly and indirectly in the upstream supply chain (Table 5).
will not yield until 1 year later).
3.3 Implications for disaster recovery plans
3.2 Spatial analysis of spillovers by production layers
and by products Analysis of the impacts of disasters, such as that undertaken
in this paper, can have constructive uptake by informing dis-
The production layer decomposition defined in Eq. (4) indi- aster recovery plans as well as regional plans more generally.
cates how the direct and spillover impacts of the cyclone un- In August 2017, the government of the Australian state of
folded regionally. In Fig. 2, production layers 1 & 2 indicate Queensland released a management review of Cyclone Deb-
that the total value-added losses in all regions physically af- bie and recommended improved Business Continuity Plan-
fected were about AUD 1.5 million. In addition, the cyclone ning (BCP) as a way to build “. . . business and organisa-
caused another AUD 660 million of value-added lost across tional resilience [. . . ] Enhanced BCP within state agencies,
the supply-chain network of the directly affected businesses. businesses and communities will help all to be more resilient
Nat. Hazards Earth Syst. Sci., 19, 137–151, 2019 www.nat-hazards-earth-syst-sci.net/19/137/2019/M. Lenzen et al.: Economic damage and spillovers 147
Table 4. Direct, indirect and total employment affected by Cyclone Debbie, by state and sector.
Region Sector Direct employment Indirect employment Total employment
impacts (FTE) impacts (FTE) impacts (FTE)
NSW-Rm & T Accommodation, cafes and restaurants −1132 −466 −1597
QLD-M Coal, oil and gas −466 −821 −1287
QLD-F Coal, oil and gas −349 −616 −964
QLD-M Accommodation, cafes and restaurants −421 −171 −592
NSW-Rm & T Trade −367 −184 −551
QLD-M Other agriculture −208 −260 −468
QLD-Brisbane Accommodation, cafes and restaurants −272 −113 −385
QLD-Brisbane Trade −187 −99 −286
QLD-M Road transport −137 −93 −231
QLD-F Trade −146 −68 −214
NSW-Rm & T Other agriculture −87 −103 −191
QLD-N Coal, oil and gas −57 −102 −159
QLD-F Road transport −93 −63 −155
QLD-N Trade −90 −47 −137
QLD-M Trade −94 −42 −137
QLD-Brisbane Dairy cattle and pigs −56 −53 −109
QLD-F Personal and other services −72 −27 −99
QLD-M Residential building construction −22 −76 −98
QLD-F Residential building construction −22 −74 −96
QLD-N Residential building construction −22 −70 −92
Total −4802 −3685 −8487
Figure 2. Total losses in value added and employment resulting from Tropical Cyclone Debbie for various regions across a number of
upstream production layers. The figure shows the first 10 production layers, which are upstream layers of the supply chain (see Sect. S3 for
underlying data).
to the impact of events. [. . . and..] should feature perma- and the related services and products they provide. For in-
nently in disaster management doctrine.” In addition, the re- stance, as shown in Table 4 for the indirect employment im-
port noted that “BCP needs to consider supply chains, and pacts for the “Accommodation, cafes and restaurants” sector,
the numbers and skills of frontline staff required to ensure some 466 employees providing services were affected in the
functioning of critical services”. (IGEM, 2017). Richmond–Tweed area. However, this impact is currently not
Consideration of the large indirect impacts identified in mentioned in disaster recovery planning documents.
this article would help to improve future planning while
recognising that only part of the impacts of the cyclone 3.4 Outlook
have been considered, and that wider analysis of positive
and downstream impacts would be beneficial as suggested In this work, we have focused on losses of employment and
by Oosterhaven (2017). However, a step forward in con- value added, because these are currently of immediate impor-
sideration of negative upstream impacts could be achieved, tance for governments, insurers and the media. Future work
for example, by considering the large number of employ- could investigate possibilities for restructuring the geogra-
ees indirectly affected by the disaster (as shown in Table 4), phy of production and supply-chain networks with the aim
of finding more disaster-resilient configurations. In addition,
www.nat-hazards-earth-syst-sci.net/19/137/2019/ Nat. Hazards Earth Syst. Sci., 19, 137–151, 2019148 M. Lenzen et al.: Economic damage and spillovers
Table 5. Direct, indirect and total value added affected by Cyclone Debbie, by state and sector.
Region Sector Direct value added Indirect value added Total value added
impacts (AUD m) impacts (AUD m) impacts (AUD m)
QLD-M Coal, oil and gas −581 −176 −757
QLD-F Coal, oil and gas −435 −133 −567
NSW-Rm & T Accommodation, cafes and restaurants −81 −83 −164
QLD-N Coal, oil and gas −71 −22 −93
QLD-M Other agriculture −41 −47 −88
NSW-Rm & T Trade −39 −34 −73
QLD-M Accommodation, cafes and restaurants −30 −31 −61
QLD-Brisbane Accommodation, cafes and restaurants −19 −20 −40
QLD-Brisbane Trade −20 −18 −38
NSW-Rm & T Other agriculture −17 −19 −36
QLD-M Road transport −14 −16 −31
QLD-F Trade −16 −13 −29
QLD-F Road transport −10 −11 −20
QLD-N Trade −10 −9 −18
QLD-M Trade −10 −8 −18
QLD-Brisbane Dairy cattle and pigs −9 −10 −18
QLD-M Residential building construction −2 −13 −16
QLD-F Residential building construction −2 −13 −15
QLD-N Residential building construction −2 −12 −15
NSW-Rm & T Residential building construction −2 −12 −14
Total −1544 −659 −2203
there are variants of IO analytical methods that allow optimal
recovery paths to be established (Koks et al., 2016), and these
approaches could be integrated into the Australian Industrial
Ecology Virtual Laboratory.
Future work could also consider the effects of cyclones be-
yond national borders. The disruptions of coal exports due to
Tropical Cyclone Debbie, for example, caused bottlenecks in
Indian and Chinese steel mills (The Barrel, 2017), and dur-
ing the aftermath of the storm, steel producers were looking
for alternative sources of coal such as Russia, Mongolia or
Mozambique (Serapio, 2017). Such trade relationships can
be taken into account using nested, multi-scale, global multi-
region IO frameworks (Bachmann et al., 2015; Tukker and
Dietzenbacher, 2013; Wang et al., 2015).
Our approach can be applied to other regions and ulti-
mately extended to include impacts well beyond employment
and value added, such as wider environmental or social con-
sequences of disasters. The IELab already has many satel-
Figure 3. Spillover in employment and value-added losses result- lite accounts (and is being expanded) to assess broader en-
ing from a tropical cyclone, by state and sector. The magnitude of vironmental and social flow-on effects. The growing number
employment and value-added losses is expressed as log10 |1Q| and
of “virtual laboratories” for IO analysis (Geschke and Had-
visualised as lines on a grey scale. Each line represents one of the
jikakou, 2017) for countries in disaster-prone zones (Indone-
34 industries in each region, in the sequence order listed in Sect. S1.
Region acronyms as in Fig. 1; bold regions are those directly af- sia, Taiwan, China) means that the work described in this
fected. See also Sect. S4. paper can be readily applied to other geographical settings.
Nat. Hazards Earth Syst. Sci., 19, 137–151, 2019 www.nat-hazards-earth-syst-sci.net/19/137/2019/M. Lenzen et al.: Economic damage and spillovers 149
4 Conclusions Industrial Ecology Virtual Laboratory VL201. The authors thank
Sebastian Juraszek for expertly managing the Global IELab’s
Powerful tropical cyclones have the ability to cause severe advanced computation requirements, and Charlotte Jarabak for
disruptions of economic production that are felt far beyond help with collecting data.
the areas of landfall and flooding. Here, we used an IO-based
analytical tool for enumerating the post-disaster consump- Edited by: Bruno Merz
tion possibilities and ensuing direct and indirect losses of em- Reviewed by: two anonymous referees
ployment and value added as a consequence of the Tropical
Cyclone Debbie that hit the Queensland regions of Australia
in March and April 2017. Our work contributes an innova-
tive approach for (a) quantifying the impact of disasters in a
detailed and timely manner and (b) incorporating infrastruc- References
ture damages into the assessment of losses in employment
and value added. ABC: http://www.abc.net.au/news/2017-03-28/cyclone-debbie-
Our results from this Australian case study suggest that edges-closer-to-the-mainland/8392702, last access: 20 June
Cyclone Debbie caused substantial damage to spill over into 2017.
regions and sectors not directly affected: industries directly ABS: Australian Bureau of Statistics, 2008, 8221.0 – Manufactur-
ing Industry, Australia, 2006-07, Australian Bureau of Statistics,
hit by the cyclone suffered approximately 4802 job losses,
Canberra, Australia, ABS Catalogue No. 5215.0.55.001, 2008.
but some 3685 jobs were affected in these industries’ up-
ABS: Census of Population and Housing 2011, Australian Bureau
stream supply chains. A total of AUD 2203 million losses in of Statistics, Canberra, Australia, Internet site http://www.abs.
value added was observed, AUD 1544 million of which were gov.au/census, 2012.
direct with particular impact around Mackay and Fitzroy, as ABS: Australian National Accounts – State Accounts, 2015-16,
well as the coastal areas of northern Queensland, Brisbane Australian Bureau of Statistics, Canberra, Australia, ABS Cat-
and northern New South Wales (Richmond–Tweed area). alogue No. 5220.0, 2016a.
These findings demonstrate that the full supply-chain effects ABS: Australian National Accounts, Input-Output Tables (Prod-
of major disruptions on national economies are significant, uct Details), 2013-14, Australian Bureau of Statistics, Canberra,
and that this type of study will become increasingly impor- Australia, ABS Catalogue No. 5215.0.55.001, 2016b.
tant in a future likely to be fraught with extreme weather ABS: Australian National Accounts: National Income, Expenditure
and Product, Sep 2016, Australian Bureau of Statistics, Canberra,
events, as the frequency and intensity of tropical cyclones
Australia, ABS Catalogue No. 5206, 2016c.
increase as a result of climate change (Mendelsohn et al.,
ABS: Counts of Australian Businesses, including Entries and Exits,
2012). Jun 2011 to Jun 2015, Australian Bureau of Statistics, Canberra,
This work demonstrates rapid analysis of the wide indirect Australia, ABS Catalogue No. 8165.0, 2016d.
impacts of Cyclone Debbie. It shows how significant conse- ABS: Labour Force, Australia, Detailed - Electronic Delivery, Nov
quences can be felt as spillovers in regions well outside the 2016, Australian Bureau of Statistics, Canberra, Australia, ABS
landfall and flood zones caused by the cyclone. Our work Catalogue No. 6291.0.55.001, 2016e.
suggests that improved planning could help account for these ABS: National Regional Profile, 2010-14 (data cube Popula-
impacts, minimise them in future and thereby help transition tion and People, Statistical Area Levels 2-4, 2014), Aus-
the affected economies towards greater resilience. tralian Bureau of Statistics, Canberra, Australia, ABS Catalogue
No. 1379.0.55.001, 2016f.
ABS: Value of Agricultural Commodities Produced, Australia,
2014-15, Australian Bureau of Statistics, Canberra, Australia,
Data availability. Data are available on request. Please email the
ABS Catalogue No. 7503.0, 2016g.
corresponding author.
ABS: Australian Industry, 2015-16, Australian Bureau of Statistics,
Canberra, Australia, ABS Catalogue No. 8155.0, 2017a.
ABS: Australian National Accounts: Input-Output Tables, 2013-14,
Supplement. The supplement related to this article is available Australian Bureau of Statistics, Canberra, Australia, ABS Cata-
online at: https://doi.org/10.5194/nhess-19-137-2019-supplement. logue No. 5209.0, 2017b.
ABS: Household Expenditure Survey, Australia: Summary of Re-
sults, 2009-10, Australian Bureau of Statistics, Canberra, Aus-
Competing interests. The authors declare that they have no conflict tralia, ABS Catalogue No. 6530.0, 2011.
of interest. Alsamawi, A., Murray, J., and Lenzen, M.: The Employment Foot-
prints of Nations: Uncovering Master-Servant Relationships, J.
Ind. Ecol., 18, 59–70, 2014.
Acknowledgements. This work was financially supported by Anderson, C. W., Santos, J. R., and Haimes, Y. Y.: A risk-based
the Australian Research Council through its Discovery Projects input-output methodology for measuring the effects of the Au-
DP0985522 and DP130101293, and the National eResearch gust 2003 northeast blackout, Econ. Syst. Res., 19, 183–204,
Collaboration Tools and Resources project (NeCTAR) through its 2007.
www.nat-hazards-earth-syst-sci.net/19/137/2019/ Nat. Hazards Earth Syst. Sci., 19, 137–151, 2019150 M. Lenzen et al.: Economic damage and spillovers Bachmann, C., Roorda, M. J., and Kennedy, C.: Developing a multi- Lenzen, M., Geschke, A., Malik, A., Fry, J., Lane, J., Wiedmann, T., scale multi-region input-output model, Econ. Syst. Res., 27, 172– Kenway, S., Hoang, K., and Cadogan-Cowper, A.: New multi- 193, 2015. regional input-output databases for Australia – enabling timely Brown, V.: http://www.news.com.au/lifestyle/food/eat/how- and flexible regional analysis, Econ. Syst. Res., 29, 275–295, cyclone-debbies-destruction-will-impact- 2017a. the-cost-of-australias-fresh-produce/news- Lenzen, M., Geschke, A., Malik, A., Fry, J., Lane, J., Wiedmann, T., story/72c2e056322930c3c0dc039ac51ed09c, last access: 7 Kenway, S., Hoang, K., and Cadogan-Cowper, A.: New multi- June 2017. regional input-output databases for Australia – enabling timely Cannon, T.: A hazard need not a disaster make: vulnerability and the and flexible regional analysis, Eco. Syst. Res., 29, 275–295, causes of “natural” disasters, Natural disasters: protecting vul- 2017b. nerable communities, Thomas Telford, London, 92–105, 1993. Lenzen, M., Geschke, A., Wiedmann, T., Lane, J., Anderson, N., Cole, S.: Lifelines and livelihood: a social accounting matrix ap- Baynes, T., Boland, J., Daniels, P., Dey, C., Fry, J., Hadjikakou, proach to calamity preparedness, J. Conting. Crisis Man., 3, 228– M., Kenway, S., Malik, A., Moran, D., Murray, J., Nettleton, 246, 1995. S., Poruschi, L., Reynolds, C., Rowley, H., Ugon, J., Webb, Donaghy, K. P., Balta-Ozkan, N., and Hewings, G. J.: Modeling un- D., and West, J.: Compiling and using input-output frameworks expected events in temporally disaggregated econometric input- through collaborative virtual laboratories, Science Tot. Environ., output models of regional economies, Econ. Syst. Res., 19, 125– 485, 241–251, 2014. 145, 2007. Leontief, W.: Input-output economics, Oxford University Press, Geschke, A. and Hadjikakou, M.: Virtual laboratories and MRIO USA, 1966. analysis – an introduction, Econ. Syst. Res., 29, 143–157, 2017. Leontief, W.: Environmental repercussions and the economic struc- Guimaraes, P., Hefner, F. L., and Woodward, D. P.: Wealth and in- ture: an input-output approach, The Review of Economics and come effects of natural disasters: An econometric analysis of Statistics, 1970. 262–271, 1970. Hurricane Hugo, The Review of Regional Studies, 23, 97–114, Leontief, W.: Interregional theory, in: Studies in the Structure of 1993. the American Economy, edited by: Leontief, W., Chenery, H. B., Haimes, Y. Y., Horowitz, B. M., Lambert, J. H., Santos, J. R., Lian, Clark, P. G., Duesenberry, J. S., Ferguson, A. R., Grosse, A. P., C., and Crowther, K. G.: Inoperability input-output model for in- Grosse, R. N., Holzman, M., Isard, W., and Kistin, H., Oxford terdependent infrastructure sectors, I: Theory and methodology, University Press, New York, NY, USA, 1953. J. Infr. Syst., 11, 670–679, 2005. Lesk, C., Rowhani, P., and Ramankutty, N.: Influence of extreme Hallegatte, S.: An adaptive regional input output model and its ap- weather disasters on global crop production, Nature, 529, 84–87, plication to the assessment of the economic cost of Katrina, Risk 2016. Analys., 28, 779–799, 2008. Li, J., Crawford Brown, D., Syddall, M., and Guan, D.: Modeling Hatch, P.: http://www.smh.com.au/business/retail/fears-for- imbalanced economic recovery following a natural disaster using tomato-and-capsicum-supply-after-cyclone-debbie-destruction- input-output analysis, Risk Analysis, 33, 1908–1923, 2013. 20170328-gv8nit.html, last access: 7 June 2017. Lian, C. and Haimes, Y. Y.: Managing the risk of terrorism to in- Hertwich, E. G. and Peters, G. P.: Carbon footprint of nations: A terdependent infrastructure systems through the dynamic inoper- global, trade-linked analysis, Environ. Sci. Technol., 43, 6414– ability input–output model, Syst. Eng., 9, 241–258, 2006. 6420, 2009. Mendelsohn, R., Emanuel, K., Chinabayashi, S., and Bakkensen, L.: Horticulture Innovation Australia: Australian Horticulture Statistics The impact of climate change on global tropical cyclone damage, Handbook 2014–2015, Horticulture Innovation Australia, Syd- Nat. Clim. Change, 2, 205–209, 2012. ney, 2016. OGS: Queensland Input-Output Tables, 1996-97, 107 Industries, IGEM: http://www.parliament.qld.gov.au/documents/tableOffice/ Office of the Government Statistician, Queensland Government, TabledPapers/2017/5517T2058.pdf, last access: 10 August Brisbane, Australia, 2002. 2017. OGS: Queensland Regional Input-Output Tables, 1996-97, 34 In- Keir, K.: Personal Communication with Kathryn Keir, Department dustries, Office of the Government Statistician, Queensland Gov- of Natural Resources and Mines, 2017. ernment, Brisbane, Australia, 2004. Ker, P.: http://www.afr.com/business/mining/queensland-coal- Oita, A., Malik, A., Kanemoto, K., Geschke, A., Nishijima, S., and miners-facing-disruption-after-debbie-aurizon-sees-earnings- Lenzen, M.: Substantial nitrogen pollution embedded in interna- hit-20170403-gvc5qw, last access: 10 June 2017. tional trade Nature, Geoscience, 9, 111–115, 2016. Koks, E. E., Carrera, L., Jonkeren, O., Aerts, J. C. J. H., Husby, Okuyama, Y.: Modeling spatial economic impacts of an earthquake: T. G., Thissen, M., Standardi, G., and Mysiak, J.: Regional dis- Input-output approaches, Disaster Prevention and Management, aster impact analysis: comparing input-output and computable An International Journal, 13, 297–306, 2004. general equilibrium models, Nat. Hazards Earth Syst. Sci., 16, Okuyama, Y.: Economic Modeling for Disaster Impact Analysis: 1911–1924, https://doi.org/10.5194/nhess-16-1911-2016, 2016. Past, Present, and Future, Econ. Syst. Res., 19, 115–124, 2007. Koks, E. E. and Thissen, M.: A Multiregional Impact Assessment Okuyama, Y.: Disaster and economic structural change: Case study Model for disaster analysis, Econ. Syst. Res., 28, 429–449, 2016. on the 1995 Kobe earthquake, Econ. Syst. Res., 26, 98–117, Lenzen, M., Moran, D., Kanemoto, K., Foran, B., Lobefaro, L., and 2014. Geschke, A.: International trade drives biodiversity threats in de- Okuyama, Y. and Santos, J. R.: Disaster impact and input-output veloping nations, Nature, 486, 109–112, 2012. analysis, Econ. Syst. Res., 26, 1–12, 2014. Nat. Hazards Earth Syst. Sci., 19, 137–151, 2019 www.nat-hazards-earth-syst-sci.net/19/137/2019/
You can also read