Polyphenol Supplementation Reverses Age-Related Changes in Microglial Signaling Cascades
←
→
Page content transcription
If your browser does not render page correctly, please read the page content below
International Journal of
               Molecular Sciences

Article
Polyphenol Supplementation Reverses Age-Related Changes in
Microglial Signaling Cascades
Ahmad Jalloh 1 , Antwoine Flowers 1 , Charles Hudson 2 , Dale Chaput 3 , Jennifer Guergues 3 , Stanley M. Stevens, Jr. 3
and Paula C. Bickford 1,2, *

                                          1   Center of Excellence for Aging and Brain Repair, Departments of Neurosurgery and Brain Repair, and
                                              Molecular Pharmacology and Physiology, USF Morsani College of Medicine, 12901 Bruce B. Downs Blvd,
                                              MDC 78, Tampa, FL 33612, USA; ahmadjalloh@usf.edu (A.J.); aflow86@gmail.com (A.F.)
                                          2   Research Service, James A Haley VA Hospital, Tampa, FL 33620, USA; chudson1@usf.edu
                                          3   Department of Cell Biology, Microbiology and Molecular Biology, University of South Florida,
                                              Tampa, FL 33620, USA; chaput@usf.edu (D.C.); j.guergues@vanderbilt.edu (J.G.);
                                              smstevens@usf.edu (S.M.S.J.)
                                          *   Correspondence: pbickfor@usf.edu

                                          Abstract: Microglial activity in the aging neuroimmune system is a central player in aging-related
                                          dysfunction. Aging alters microglial function via shifts in protein signaling cascades. These shifts can
                                          propagate neurodegenerative pathology. Therapeutics require a multifaceted approach to understand
                                          and address the stochastic nature of this process. Polyphenols offer one such means of rectifying
                                          age-related decline. Our group used mass spectrometry (MS) analysis to explicate the complex
                                          nature of these aging microglial pathways. In our first experiment, we compared primary microglia
                                isolated from young and aged rats and identified 197 significantly differentially expressed proteins

                                          between these groups. Then, we performed bioinformatic analysis to explore differences in canonical
Citation: Jalloh, A.; Flowers, A.;
                                          signaling cascades related to microglial homeostasis and function with age. In a second experiment,
Hudson, C.; Chaput, D.; Guergues, J.;
                                          we investigated changes to these pathways in aged animals after 30-day dietary supplementation
Stevens, S.M., Jr.; Bickford, P.C.
                                          with NT-020, which is a blend of polyphenols. We identified 144 differentially expressed proteins
Polyphenol Supplementation
                                          between the NT-020 group and the control diet group via MS analysis. Bioinformatic analysis
Reverses Age-Related Changes in
Microglial Signaling Cascades. Int. J.
                                          predicted an NT-020 driven reversal in the upregulation of age-related canonical pathways that
Mol. Sci. 2021, 22, 6373. https://        control inflammation, cellular metabolism, and proteostasis. Our results highlight salient aspects of
doi.org/10.3390/ijms22126373              microglial aging at the level of protein interactions and demonstrate a potential role of polyphenols
                                          as therapeutics for age-associated dysfunction.
Academic Editor: Jana Tchekalarova
                                          Keywords: microglia; aging; polyphenols; mass spectrometry; bioinformatics
Received: 27 April 2021
Accepted: 11 June 2021
Published: 14 June 2021

                                          1. Introduction
Publisher’s Note: MDPI stays neutral
                                               Aging progressively compromises an organism’s ability to maintain homeostasis, in-
with regard to jurisdictional claims in
                                          creases its susceptibility to disease and death, and is the major risk factor for most neurode-
published maps and institutional affil-
                                          generative diseases [1]. Alzheimer’s, Parkinson’s, and similar disorders have a complex
iations.
                                          molecular origin with multiple etiologies that underscore their debilitative symptoms;
                                          however, the immune system is a common factor among progression of these diseases [2].
                                          The central nervous system (CNS) mediates immunity through the neuroimmune sys-
                                          tem, which is a set of cells that maintain homeostasis by regulating neuroinflammation.
Copyright: © 2021 by the authors.
                                          Microglia are among the core effector cells of this system. These myeloid-derived cells
Licensee MDPI, Basel, Switzerland.
                                          are the brain’s resident macrophage that acquire different functions by dynamically alter-
This article is an open access article
                                          ing their morphology [3]. Microglia form contacts with neurons and monitor the brain
distributed under the terms and
                                          parenchyma for pathogenic invasion or cellular damage [4]. Quiescent microglia possess a
conditions of the Creative Commons
                                          highly ramified structure that interacts with neurons [5], and samples their surroundings.
Attribution (CC BY) license (https://
creativecommons.org/licenses/by/
                                          Microglia enact CNS immunity through the initiation and resolution of the neuroimmune
4.0/).
                                          response upon binding cellular debris via puringergic receptors or pathogens via Toll-like

Int. J. Mol. Sci. 2021, 22, 6373. https://doi.org/10.3390/ijms22126373                                       https://www.mdpi.com/journal/ijms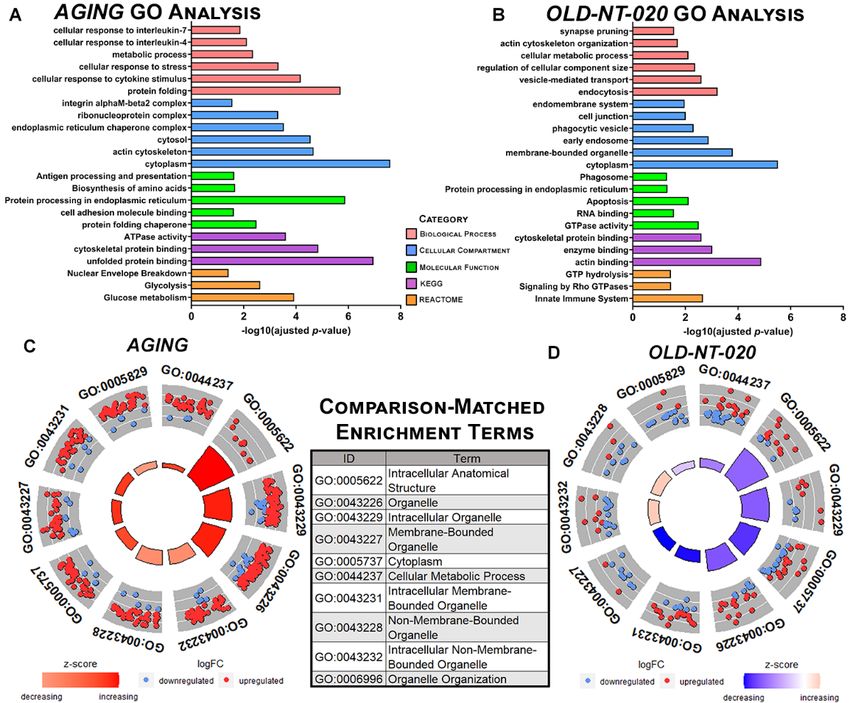
Int. J. Mol. Sci. 2021, 22, 6373                                                                                            2 of 15

                                   receptors (TLRs) [6]. Microglia will polarize toward a phenotype that promotes antigen
                                   presentation during this process [7]. Pro-inflammatory microglia secrete molecules such as
                                   tumor necrosis factor α (TNFα), interleukin-1β (IL-1β), and interleukin-6 (IL-6), and they
                                   generate reactive oxygen species (ROS) and reactive nitrogen species (RNS) to limit damage
                                   to CNS tissues [8]. Then, microglia are polarized by anti-inflammatory molecules such as
                                   interleukin-4 (IL-4) and interleukin-10 (IL-10) toward a phenotype that supports wound
                                   healing and debris clearance via phagocytosis in a secondary process that resolves the im-
                                   mune response [9]. These processes are highly regulated and essential for CNS homeostasis;
                                   however, aging can make microglia and their activation states become dysfunctional and
                                   dysregulated [10].
                                         Previous studies have described a “priming” effect in aged microglia. Primed mi-
                                   croglia are hyper-responsive to pro-inflammatory stimuli and show a blunted response to
                                   anti-inflammatory signals [11]. This phenomenon increases neuronal vulnerability and fa-
                                   cilitates microglia-induced neurotoxicity that plays a demonstrated role in Alzheimer’s [12],
                                   ALS [13], and Parkinson’s [14]. Aging, as such, modulates inflammatory signaling cascades
                                   toward pathology. Microglia from aged mice possess higher baseline cytokine expres-
                                   sion compared to microglia from young mice; furthermore, aged microglia show higher
                                   pro-inflammatory gene expression after TNFα stimulation and lower anti-inflammatory
                                   gene expression after IL-4 stimulation [15]. Other research confirms that aged microglia
                                   overexpress inflammatory genes such as major histocompatibility complex II (MHCII) and
                                   CD68 that regulate antigen presentation [16], integrins such as CD11b [17] and cytokines
                                   such as TNF, IL-1β, and IL-6 [18]. Microglial activation and tau deposition increases in
                                   WT and 3xTg AD transgenic mice after acute intracranial or systemic LPS stimulus [19,20].
                                   When considered together, these studies emphasize the molecular consequences on the
                                   CNS brought on by microglial aging.
                                         Longevity and well-being depend on limiting CNS damage from neuroinflammation.
                                   Polyphenol-rich diets are one approach to mitigating the deleterious effects of prolonged
                                   neuroinflammation and reducing the risk of neurodegenerative disease. Research over the
                                   last decade has established a solid body of evidence for the clinical effectiveness of polyphe-
                                   nols on age-related decline [21]. One study demonstrated that dietary (−)-epigallocatechin-
                                   3-gallate (EGCG), which is a catechin found in green tea, ameliorated skeletal muscle
                                   insulin resistance and reduced liver fat accumulation in senescence-accelerated mice [22].
                                   This process occurred inhibition of the PI3K/Akt pathway, decreased glucose transporter
                                   type 4 (GLUT4) expression, and a downregulated mechanistic target of rapamycin (mTOR)
                                   activity via decreased sterol regulatory element-binding proteins-1c (SREBP-1c) and nuclear
                                   factor kappa-light-chain-enhancer of activated B cells (NF-κB) expression. Another study
                                   showed that quercetin, a flavonoid found in blueberries, improved motor coordination and
                                   spatial learning in aged rats concomitant with reduced hippocampal NF-κB and elevated
                                   sirtuin 1 expression [23]. Molecules such as vitamin D and L-carnosine have proven effec-
                                   tiveness in treating symptoms of aging. Vitamin D reduced microglial pro-inflammatory
                                   cytokine and ROS production while inducing anti-inflammatory cytokine expression in
                                   a Parkinson’s disease animal model [24]. Likewise, L-carnosine significantly reduced
                                   amyloid-Beta (Aβ) deposition in the prefrontal cortex, hippocampus, and hypothalamus of
                                   aged rats, decreased serum corticosterone, and restored locomotor activity [25]. Polyphe-
                                   nols are well-characterized in aging studies and beneficial, tempering age-related decline.
                                         In our present study, we used a mass spectrometry (MS)-based proteomics approach
                                   to compare microglia extracted from young (≈3–6 months) and aged rats (≈20 months).
                                   Our first experiment highlighted age-related changes in canonical microglial signaling path-
                                   ways, annotated potential upstream transcriptional regulatory molecules involved in the
                                   aging phenotype, and predicted several changes in cell function related to microglial aging.
                                   Our second experiment elucidated the modulatory effect of the polyphenol supplement
                                   NT-020 (a proprietary blend of blueberry, green tea, vitamin D3, and l-carnosine). This for-
                                   mulation was chosen specifically based upon a study of hundreds of potential ingredients
                                   where top candidates were tested for the ability to promote stem cell proliferation in vitro,
Int. J. Mol. Sci. 2021, 22, 6373 3 of 15
and this combination was found to be more than additive [26]. Follow-up studies demon-
strated that the administration of this supplement to mice protects cells from oxidative
insults during ischemic stroke [27]. Of relevance to this investigation, we have previously
demonstrated that NT-020 improves neuronal progenitor cell proliferation while improving
cognitive function and reducing brain inflammation in aged rats [28,29]. In this study, we
found that 30-day dietary supplementation in aged rats reversed the predicted age-related
trends we observed in canonical microglial protein networks, transcriptional regulatory
patterns, and cell function pathways. These results explicate a systems-level understanding
of molecular aging in rat microglia extrapolated at the protein level and provide further
evidence for NT-020 as a potential therapeutic for age-related microglial dysfunction.
2. Results/Discussion
2.1. NT-020 Supplementation Alters Microglial Protein Expression in Aging Rats
Proteomic analysis identified 2563 proteins across all experimental groups (YNG,
YNG-NT-020, OLD, OLD-NT-020). After filtering for quantifiable proteins, we detected
1154 proteins in the YNG and OLD comparison with 197 significantly differentially ex-
pressed (p < 0.05, Welch’s t-test) proteins identified as part of our AGING comparison
(OLD/YNG). We identified 967 and 1358 quantifiable proteins in the YNG-NT-020 (YNG-
Tx/YNG) and OLD-NT-020 comparisons (OLD-Tx/OLD), respectively. We found 36 pro-
teins significantly differentially expressed in the YNG-NT-020 comparison and 144 in the
OLD-NT-020 comparison. Further statistical filtering was also implemented using a z-score
cutoff (|z-score| > 1) to provide a more stringently filtered list in terms of lower false dis-
covery rate (FDR) (see Table S1 for full and filtered protein lists by comparison). However,
we used only differentially expressed proteins filtered by Welch’s t-test for subsequent
bioinformatics analyses. This filtering allowed a wider search space to facilitate the identi-
fication of significant as well as trending global-scale activity changes in pathways related
to age and antioxidant (NT-020) treatment.
In the AGING and OLD-NT-020 comparisons, we plotted the Welch’s T-test difference
vs. −log10 (p-value) for each protein to obtain the volcano plots shown in Figure 1A,B.
Highlighted in red (upregulated) and green (downregulated) are those differentially ex-
pressed proteins that passed the z-score cutoff. Our analyses excluded the YNG-NT-020
comparison because the low number of differentially expressed proteins did not generate
any significant changes to canonical pathways nor cell functions (data not shown).
Here, we observed a shift in the expression of several immune regulators including
integrin alpha M (ITGAM), also known as CD11b, Complement component 3 (C3), heat-
shock protein 90 beta family member 1 (HSP90B1), and progesterone receptor membrane
component 1 (PGRMC1) that were upregulated in aged microglia but downregulated in
aged microglia from NT-020 supplement rats. We also detected upregulation greater than
1.5-fold with age and downregulation less than 1.5-fold with NT-020 treatment in other
molecules with a demonstrated capacity to induce the microglial inflammatory. Among
those molecules were hexokinase 2 (HK2) [30], interferon regulatory factor 5 (IRF5) [31], and
Rac family small GTPase 1 (RAC1) [32]. We used the Wes instrument to validate proteins in
our MS data by quantifying C3, HSP90B1, ITGAM, and PGRMC1. We confirmed the trends
we observed with mass spectrometry in the chemiluminescent intensities for each protein
normalized to their respective values for GAPDH (Figure 1C–F) even for proteins such as
HSP90B1 and ITGAM that had p-values < 0.05 but z-scores < 1. Both HSP90B1 and ITGAM
showed higher LFQ intensity values measured by mass spectrometry (compared to C3 and
PGRMC1), which typically can be measured with lower variance, highlighting that subtle
changes in differential protein expression can be accurately detected as confirmed by an
orthogonal validation approach. We used a more relaxed significance cutoff (p < 0.10) in
the canonical and functional pathway analyses we discuss below to incorporate a greater
number of proteins and enable wider coverage of relevant pathways.Int. J. Mol. Sci. 2021, 22, x FOR PEER REVIEW 4 of 15
Int. J. Mol. Sci. 2021, 22, 6373 significance cutoff (p < 0.10) in the canonical and functional pathway analyses we discuss
4 of 15
below to incorporate a greater number of proteins and enable wider coverage of relevant
pathways.
Figure1.1.Differential
Figure Differential microglial
microglial protein
protein expression
expression in AGING
in AGING and and
NT-020NT-020 comparisons.
comparisons. Protein
Protein fold
fold change was calculated using average LFQ intensities among samples (n
change was calculated using average LFQ intensities among samples (n = 4 rats per group) across = 4 rats per group)
acrosscomparisons:
three comparisons:
AGINGAGING OLD ( ), YNG-NT-020
), YNG-NT-020 ( YNG (−Tx ), and OLD-NT-020OLD ( −Tx ). Welch’s
three ( YNG YNG ), and OLD-NT-020 ( OLD ). Welch’s
T-testdifference
T-test differencevalues
valueswere
wereplotted
plottedagainst
againstthethecorresponding
corresponding−-log log1010(p-value)
(p-value)for
foreach
eachprotein
proteintoto
generate volcano plots; the horizontal dotted line indicates the cutoff for statistical significance
generate volcano plots; the horizontal dotted line indicates the cutoff for statistical significance via via
Welch’s t-test (p < 0.05); green (downregulated) and red (upregulated) color indicate proteins with
Welch’s t-test (p < 0.05); green (downregulated) and red (upregulated) color indicate proteins with
z-score > 1 (A,B). Protein expression for inflammatory mediators such as ITGAM, C3, HSP90B1,
z-score > 1 (A,B). Protein expression for inflammatory mediators such as ITGAM, C3, HSP90B1, and
and PGRMC1 followed the trend of being upregulated with age and downregulated with age and
PGRMC1
the NT-020followed theresults
diet. MS trend of being
were upregulated
validated usingwith age and
the Wes downregulated
instrument with
(C–F). The age andchemilu-
average the NT-
020 diet. MS results were validated using the Wes instrument (C–F). The
minescence ± SEM was obtained for 1° antibodies against ITGAM, C3, HSP90B1, and PGRMC1 average chemiluminescence
±(normalized
SEM was obtained
to GAPDH) 1◦ antibodies
for across treatmentagainst
groupsITGAM, C3, per
(n = 5 rats HSP90B1,
group) and and PGRMC1 (normalized
two-way ANOVA
to GAPDH)
analysis wasacross treatment
performed with groups
Tukey’s(n = 5 ratstest
post-hoc per(*,group) and two-way ANOVA analysis was
p < 0.05).
performed with Tukey’s post-hoc test (*, p < 0.05).
Our results corroborate other literature findings regarding immune cell response to
Our results
polyphenol corroborate other
supplementation. Theseliterature
studies findings
relate theregarding immune cellcomprising
specific compounds response
to
NT-020 such as green tea-derived EGCG and quercetin found in berry extracts to compris-
polyphenol supplementation. These studies relate the specific compounds immuno-
ing NT-020 such
modulatory as green
function. EGCG tea-derived
was shown EGCG and quercetin
to downregulate andfound in berry
bind CD11b extractsontoB
(ITGAM)
immunomodulatory
and CD8+ T cells andfunction. EGCG was
reduce adhesion shown to migration
and decreases downregulate and bindsites
at infiltration CD11b[33],
(ITGAM) on B and CD8 + T cells and reduce adhesion and decreases migration at infiltration
[34]. Likewise, quercetin supplementation was shown to inhibit dendritic cell maturation
sites
and [33,34].
impede Likewise, quercetin supplementation
disease progression in mouse modelswas shown to inhibit
of atherosclerosis viadendritic
decreasedcell mat-
nuclear
uration and impede disease progression in mouse models of atherosclerosis
NF-κB translocation [35]. Those effects were also concomitant with decreased inflamma- via decreased
nuclear NF-κB
tory marker translocation
expression and [35]. Those
reduced effects
ability were alsoTconcomitant
to stimulate cells in vitro.with decreased
Another study
inflammatory marker expression and reduced ability to stimulate
determined vitamin D3 secreted from neurons attenuated LPS-induced microglialT cells in vitro. Another
inflam-
study determined vitamin D3 secreted from neurons attenuated LPS-induced microglial in-
mation and deleting the vitamin D3 receptor in mice increased CNS autoimmunity [36].
flammation and deleting the vitamin D3 receptor in mice increased CNS autoimmunity [36].
Finally, l-carnosine was shown to reduce Aβ-induced pro-inflammatory microglial acti-
Finally, l-carnosine was shown to reduce Aβ-induced pro-inflammatory microglial activa-
vation in a transforming growth factor beta 1 (TGF-β1)-mediated process [37]. Our results
tion in a transforming growth factor beta 1 (TGF-β1)-mediated process [37]. Our results
expand upon these studies on polyphenols and immune cell function by demonstrating
expand upon these studies on polyphenols and immune cell function by demonstrating
anti-inflammatory effects in aging microglia.
anti-inflammatory effects in aging microglia.
2.2. Gene Ontology Analysis Highlights Global Functional Changes in Aging Tat Microglial
Proteome with NT-020 Diet
We performed gene ontology on our MS results to visualize global changes in the
microglial proteome with age and contrast those changes in aging rats supplemented withInt. J. Mol. Sci. 2021, 22, x FOR PEER REVIEW 5 of 15
2.2. Gene Ontology Analysis Highlights Global Functional Changes in Aging Tat Microglial
Int. J. Mol. Sci. 2021, 22, 6373 Proteome with NT-020 Diet 5 of 15
We performed gene ontology on our MS results to visualize global changes in the
microglial proteome with age and contrast those changes in aging rats supplemented with
NT-020. We
NT-020. We assessed
assessed enrichment
enrichment in in GO
GO terms
terms queried
queried via
via g:Profiler
g:Profiler [38]
[38] in
in the
the AGING
AGING
(Figure 2A) and OLD-NT-020 (Figure 2B) comparisons. The YNG-NT-020 comparisonis
(Figure 2A) and OLD-NT-020 (Figure 2B) comparisons. The YNG-NT-020 comparison
not
is shown
not shown in this, andand
in this, anyany
subsequent
subsequentbioinformatics results
bioinformatics as theaslow
results thenumber
low numberof differ-
of
entially expressed
differentially proteins
expressed produced
proteins no GO
produced no annotations during
GO annotations computation,
during computation, nor nor
is this
is
sufficient
this for meaningful
sufficient analysis
for meaningful in IPA.
analysis The The
in IPA. datadata
are reported in the
are reported in supplemental
the supplemental data
tables.
data tables.
Figure 2.
Figure 2. Gene
Gene ontology
ontology analysis
analysis inindifferentially
differentially expressed
expressed microglial
microglial proteins
proteins in in AGING
AGING andand
OLD-NT-020 comparisons. Representative GO results queried in
OLD-NT-020 comparisons. Representative GO results queried in g: Profiler for AGING g: Profiler for AGING (A)(A)
andand
OLD-NT-020 (B) comparisons. Terms on vertical axis faceted among biological process, molecular
OLD-NT-020 (B) comparisons. Terms on vertical axis faceted among biological process, molecular
function, cellular compartment and annotations in KEGG and REACTOME pathways. Significance
function, cellular compartment and annotations in KEGG and REACTOME pathways. Significance
of terms is plotted on the horizontal axis using −log10(adjusted p-value). Circle plots generated
of terms
with theisGOCircle
plotted on the horizontal
function for top 10 using −logterms
axisenrichment 10 (adjusted p-value).
by z-score shared Circle plots generated
by AGING (C) and with
OLD-NT-020 (D) comparisons. Outer circle scatterplot represents log2(fold-change) of OLD-NT-020
the GOCircle function for top 10 enrichment terms by z-score shared by AGING (C) and proteins
(D) comparisons.
annotated to terms;Outer
redcircle scatterplot
circles represents
= upregulation, bluelog 2 (fold-change)
circles of proteins
= downregulation. annotated
Inner to terms;
bars depict z-
red circles = (#
upregulation, blue circles = #
downregulation. Inner ) depict z-score (calculated as
bars
score (calculated as ) where red = increasing z-
# proteins)
(# o f upregualted proteins−# o f downregulated
√ ) where red = increasing z-score and blue = decreasing
score and blue # o=f decreasing z-score.
proteins per GO term AGING showed marked enrichment for upregulated proteins
z-score. AGING
within terms showed
while marked enrichment
OLD-NT-020 for upregulated proteins within terms while OLD-NT-
trended oppositely.
020 trended oppositely.
We observed enrichment for several microglia-relevant terms in our both compari-
sons,We observed enrichment
particularly for several
cellular response microglia-relevant
to cytokine terms in
stimulus, integrin our both
alpha-M comparisons,
beta 2 complex,
particularly cellular response to cytokine stimulus, integrin alpha-M
antigen presentation and processing in AGING and synapse pruning, phagocytic beta 2 complex,
vesicle,
antigen presentation
and innate and processing
immune system in AGING
in OLD-NT-020. We and synapsea pruning,
observed phagocytic
reversal in vesicle,
trends from AG-
and innate immune system in OLD-NT-020. We observed a reversal in trends
ING to OLD-NT-020 when we ranked the top 10 terms annotated in both comparisons by from AGING
to OLD-NT-020
z-score when we
as visualized by ranked the (Figure
circle plot top 10 terms annotated
2C,D). Our genein ontology
both comparisons
analysesby z-scorea
provide
as visualized by circle plot (Figure 2C,D). Our gene ontology analyses provide a cursory
overview as to how microglia in an aging animal differ with polyphenol supplementation;
namely, our data indicate a shift in metabolic processes in aging microglia that shifts in the
opposite direction with polyphenol supplementation. We found that upregulated proteinInt. J. Mol. Sci. 2021, 22, x FOR PEER REVIEW 6 of 15
Int. J. Mol. Sci. 2021, 22, 6373 6 of 15
cursory overview as to how microglia in an aging animal differ with polyphenol supple-
mentation; namely, our data indicate a shift in metabolic processes in aging microglia that
shifts in the opposite direction with polyphenol supplementation. We found that upreg-
ulated protein expression enriched GO terms in AGING, whereas downregulated protein
expression enriched GO terms in AGING, whereas downregulated protein expression
expression
enriched GOenriched
terms inGO terms in OLD-NT-020.
OLD-NT-020.
2.3.Pathway
2.3. PathwayAnalysis
AnalysisIdentifies
IdentifiesCanonical
CanonicalPathways
PathwaysDriving
DrivingAge-Related
Age-RelatedChanges
ChangesininMicroglial
Microglial
Proteome Proteome
Reversed Reversed
with NT-020withDietNT-020 Diet
WeWeused
usedbioinformatic
bioinformaticanalysis
analysistotoexplore
explorechanges
changesin insignaling
signalingnetworks
networksin inthe
themi-
mi-
croglial
croglialproteome
proteomeinineach
eachofofour
ourcomparisons.
comparisons.We Wecalculated
calculatedmicroglia-related
microglia-relatedcanonical
canonical
pathways
pathwaysthrough
throughthe core
the coreanalysis function
analysis in IPA
function in IPA for AGING
for the comparison
the AGING (Figure
comparison 3A)
(Figure
and
3A)contrasted their states
and contrasted their in the OLD-NT-020
states comparison
in the OLD-NT-020 (Figure 3B).
comparison We do
(Figure notWe
3B). showdothe
not
YNG-NT-020 comparisoncomparison
show the YNG-NT-020 from canonicalfrompathway analysis
canonical pathwaybecause low because
analysis protein enrichment
low protein
failed to manifest
enrichment failedannotated
to manifest pathways.
annotated pathways.
Figure3.3.Canonical
Figure Canonical pathways
pathways in in
ratrat microglial
microglial proteome
proteome altered
altered byand
by age agediet.
andCanonical
diet. Canonical mi-
microglial
croglial signaling pathways annotated by IPA’s core analysis module for AGING (A)
signaling pathways annotated by IPA’s core analysis module for AGING (A) and OLD-NT-020 and OLD-NT-
(B) comparisons. X-axis indicates pathways (UPR = unfolded protein response, EIF2 = eukaryoticInt. J. Mol. Sci. 2021, 22, 6373 7 of 15
initiation factor 2 signaling, IL-8 = interleukin-8 signaling, Integrin = integrin signaling, mTOR
= mechanistic target of rapamycin signaling, CAR = xenobiotic metabolism CAR signaling pathway,
ROS production = production of nitric oxide and reactive oxygen species in macrophages), left Y-axis
denotes −log(p-value) derived from Fischer’s exact test right-tailed, right Y-axis (points on black
line) represents the ratio of dataset proteins to total known proteins for that pathway. Orange bars
indicate predicted activation (positive z-score), while blue bars indicate predicted inhibition (negative
z-score). A general trend is observed where pathways in AGING have reverse predicted regulation
in OLD-NT-020. UPR, IL-8, Integrin, and mTOR pathways exhibited the greatest absolute change in
activation z-scores across comparisons.
Table S3 lists the full set of canonical pathways and abbreviated terms belonging to
each pathway. The −log10 (p-value) was derived from Fisher’s exact test (right-tailed),
and the z-score in this context describes a predicted activation state inferred from dataset
protein expression. Below, we focus our discussion of these canonical pathways and the
changes accompanying NT-020 supplementation in the three pathways with the largest
change in activation z-score across the two comparisons.
Again, we observed a similar pattern in canonical pathways as in our differential
expression and GO analyses: each pathway activated in AGING had the opposite regu-
lation in OLD-NT-020. Unfolded Protein Response Signaling (UPR) was the most activated
pathway predicted in AGING (z = 2.828) and is a highly conserved cellular mechanism
that is integral for maintaining homeostasis [39]. Neurodegenerative disorders such as
Alzheimer’s [40] and Parkinson’s [41] have pathology that features aberrant UPR-related
and by proxy, Endoplasmic Reticulum Stress (ER Stress)-related signaling. Our finding in
AGING underscores emerging literature describing the role of proteostasis and its dysregu-
lation in a neurodegenerative context [42,43] but expands this context by also implicating
aging microglia. Abnormal or overactive UPR signaling is a likely culprit or by-product of
the aging microglial phenotype but requires further study to elucidate properly. Further-
more, our data showed that NT-020 supplementation garnered an inhibitory effect in aging
microglia. UPR signaling was predicted to be inhibited (z = −2.236) in the OLD-NT-020
comparison. This prediction is significant because the exploration of polyphenolic com-
pounds and their influence on age-related UPR and ER stress signaling is an increasing
area of interest [44]. A recent study showed in an Alzheimer’s mouse model of obesity
that a single oral dose of EGCG significantly decreased hippocampal UPR activation via
decreased phosphorylated-EIF2α (S51), activation factor 4 (ATF4), and CATT-enhancer-
binding protein homologous protein (CHOP) [45]. Reversing UPR dysfunction in aging
microglia is crucial to re-establishing cellular homeostasis, and our data suggest a role for
dietary polyphenols in this process.
Interleukin-8 (IL-8) signaling was another pathway that demonstrated reversal from
AGING to OLD-NT-020. IL-8 is a pro-inflammatory macrophage chemokine that transduces
signals from lipopolysaccharide and other cytokines [46]; moreover, its inhibition attenuates
microglial activation in murine Alzheimer’s models [47]. We observed predicted activation
in this pathway in our AGING comparison (z = 2.000) that reversed to inhibition in our
OLD-NT-020 comparison (z = −0.816). This result suggests a possible interaction between
dietary polyphenols and the age-related microglial phenotype via IL-8. Other evidence
also corroborates the effect polyphenols have on reducing IL-8 activity in immune cells.
Vitamin D3 decreased LPS-induced IL-8 production in human monocytes and macrophages
in vitro [48], and EGCG significantly reduced IL-8 expression in macrophages after TNF-
α stimulation [49]. Our findings merit further research on age-related IL-8 signaling in
microglia and its attenuation by polyphenols given the magnitude of change between our
AGING and OLD-NT-020 comparisons.
Finally, we saw a reversal in predicted activity in the Mechanistic Target of Rapamycin
(mTOR) Signaling pathway between AGING and OLD-NT-020. The mTOR pathway is a
critical signaling junction that integrates multiple intra- and extracellular inputs to regulate
microglial metabolism [50], growth and proliferation [51], and microglial activation [52],Int.J.J.Mol.
Int. Mol.Sci.
Sci.2021,
2021,22,
22,6373
x FOR PEER REVIEW 8 8ofof1515
[52], among other functions. We have also characterized mTOR as a prominent modulator
among other functions. We have also characterized mTOR as a prominent modulator of
of microglial dysfunction in aging mice [15] previously. In the present study, we show
microglial dysfunction in aging mice [15] previously. In the present study, we show that
that mTOR signaling is predicted as activated in aging microglia (z = 1.342) but predicted
mTOR signaling is predicted as activated in aging microglia (z = 1.342) but predicted as
as inhibited
inhibited during
during aging
aging withwith NT-020
NT-020 supplementation
supplementation (z = −(z2.449),
= −2.449), implicating
implicating polyphe-
polyphenols
nols as a possible mediator of the mTOR-driven aging microglial phenotype.
as a possible mediator of the mTOR-driven aging microglial phenotype. Previous literature Previous
literature has identified how polyphenols affect cellular processes such as
has identified how polyphenols affect cellular processes such as autophagy [53]. EGCG can autophagy [53].
EGCGautophagy
rescue can rescue autophagy in hippocampal
in hippocampal neurons inneurons in rats following
rats following chronic unpredict-
chronic unpredictable mild
stress [54]. This process was concomitant with improved cognitive function,function,
able mild stress [54]. This process was concomitant with improved cognitive decreasedde-
creased neuronal apoptosis, and reduced Aβ 1–42 levels in the hippocampal CA1 region.
neuronal apoptosis, and reduced Aβ1–42 levels in the hippocampal CA1 region. Another
Another
study study demonstrated
demonstrated that quercetinthat quercetin
treatment treatment
restored restored
locomotion locomotion
in an Alzheimer’sin disease
an Alz-
model of Caenorhabditis elegans by activating proteasomal degradation of Aβ and inducingof
heimer’s disease model of Caenorhabditis elegans by activating proteasomal degradation
Aβ and inducing[55].
macroautophagy macroautophagy
Regulation via [55]. Regulation
mTOR via mTOR
is unique, since itsis activity
unique, issince its activity
pleotropic in
is pleotropic in nature; therefore, a therapeutic such as NT-020 with effects
nature; therefore, a therapeutic such as NT-020 with effects as our data show represents a as our data
showmeans
novel represents a novel means
of mitigating of mitigating
age-related age-related
microglial microglial dysfunction.
dysfunction.
2.4.
2.4.NT-020
NT-020Diet
DietReverses
ReversesAge-Related
Age-RelatedChanges
ChangesininPredicted
PredictedRat
RatMicroglia
MicrogliaFunction
Function
We
Weused
usedIPA IPAtotoquery
query functional
functional pathways
pathways altered
alteredin in
aging ratrat
aging microglia andand
microglia examine
exam-
how thesethese
ine how changes manifested
changes in oldinrats
manifested oldfed
ratsan
fedNT-020-supplemented
an NT-020-supplemented diet. We
diet.found that
We found
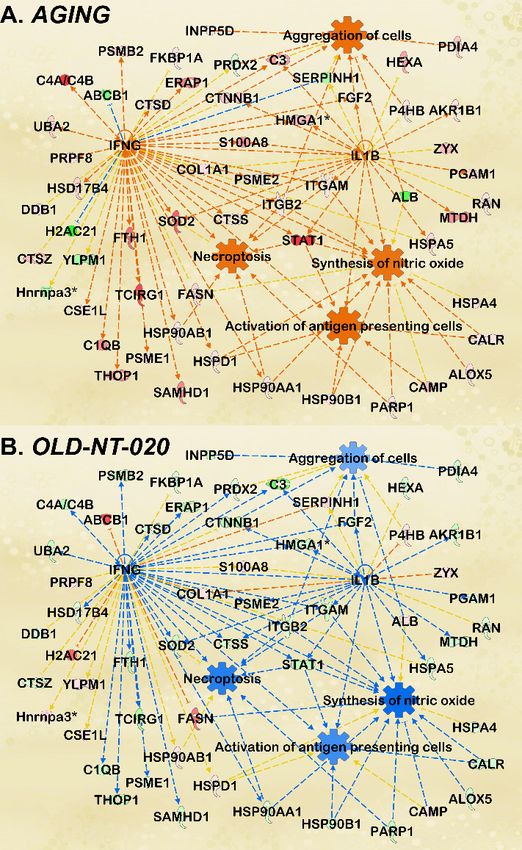
the following cell functions were predicted as activated based on the protein
that the following cell functions were predicted as activated based on the protein fold fold changes
we observed
changes in our AGING
we observed in ourcomparison: activationactivation
AGING comparison: of antigenofpresenting cells, synthesis
antigen presenting of
cells, syn-
nitric
thesisoxide, aggregation
of nitric of cells, and
oxide, aggregation necroptosis
of cells, (Figure 4A).
and necroptosis (Figure 4A).
Figure4.4.Microglial
Figure Microglialfunctions
functions modified
modified during
during aging
aging andand with
with polyphenol
polyphenol supplementation.
supplementation. IPA
IPA network analysis featuring annotated microglial functions enriched by MS-detected proteinsInt. J. Mol. Sci. 2021, 22, 6373 9 of 15
network analysis featuring annotated microglial functions enriched by MS-detected proteins for AG-
ING comparison (A). Orange and blue nodes represent predicted activated and inhibited regulators,
respectively. Darker colors indicate greater predicted activation or inhibition. Orange and blue lines
depict regulation from upstream molecules to downstream function. Dataset proteins shown in green
(downregulated) or red (upregulated) with MS-determined LFQ fold change and p-values; darker
colors represent greater fold change; significance cutoff at p < 0.1 to incorporate a greater number of
dataset proteins in predictive analysis. Annotated functions included antigen presentation, nitric
oxide synthesis, cell aggregation, and necroptosis. Then, the pathway was fitted with OLD-NT-020
dataset proteins (B) to observe changes in aging microglial cell functions with NT-020 diet. Consis-
tent with trends observed in differential protein expression, gene ontology, and canonical pathway
analysis, activated predictions in AGING were reversed to inhibition in OLD-NT-020.
Note that this network was generated using a significance cutoff at p < 0.10 to
maximize protein count during pathway scoring, thereby improving the subsequent
predictive analysis.
The age-related changes we found here support previous literature describing aging
microglia. Increased antigen presentation was demonstrated in hippocampal microglia
from 24-month-old mice relative to their 3-month-old counterparts [56]. These antigens
included CD11b, and the microglial from the older mice were hyper-responsive to pro-
inflammatory stimuli. Another study showed that greater numbers of inducible nitric
oxide synthase (iNOS)-producing microglia have been found in aging mice in a Parkinson’s
model where aggravation with MPTP amplified this effect [57]. Older microglia also
exhibit increased aggregation in laser-induced brain injury models by way of lower process
motility and migratory capacity [58]. Finally, necroptosis in microglia has been studied
in retinal degenerative models where necroptotic microglia trigger neuroinflammation
and neuronal cell death [59]. However, when we subsequently scored this functional
pathway analysis with the OLD-NT-020 dataset, we observed a reversal in the predictions
reflected in the AGING comparison (Figure 4B). This inhibition is consistent with our
observations in our differential expression and canonical pathway analyses, suggesting
that NT-020 supplementation may reverse age-related changes in microglial function.
Our findings are also consistent with other research regarding the polyphenols found
in NT-020. EGCG reduced TLR4 signaling in dendritic cells after LPS stimulation via
downregulated CD80, CD86, major histocompatibility complex I (MHCI), and MHCII [60].
EGCG treatment also decreased macrophage infiltration in the ankle joints of rats with
college-induced arthritis [61]. Likewise, quercetin supplementation attenuated microglia-
induced oligodendrocyte necroptosis via inhibition of Signal transducer and activator of
transcription 1 (STAT1) and NF-κB pathways [62]. Finally, vitamin D3 decreased iNOS
expression in macrophages cultured from human and rat kidneys via a STAT1–TREM-1
(Triggering receptor expressed on myeloid cells)-mediated process [63]. Our pathway
analysis demonstrates the age-related molecular changes in microglia protein signaling
and the reversal of those changes with polyphenol supplementation.
3. Conclusions
Aging is a complex and stochastic process at the cellular level. With age, cells lose
their ability to maintain homeostatic mechanisms, and pathology can arise where certain
cells become unable to perform basic functions that prevent organismal decline. Microglia
bare a unique burden in the neuroimmune system in preserving an organism’s cognitive
and motor function. Well-regulated microglia are critical for preventing age-related decline.
Polyphenols represent a promising therapy in preserving microglial homeostasis in their
potential to reverse the dysfunction microglia acquire during aging. We have identified
a multitude of effects the polyphenol NT-020 exerts on the microglial proteome based on
our results from MS-based proteomics and bioinformatics analyses. These effects result in
a potential shift toward a more beneficial microglial phenotype during aging. However,
we were unable to determine whether NT-020 supplementation affected microglia fromInt. J. Mol. Sci. 2021, 22, 6373 10 of 15
younger animals. This result was likely due to the low number of differentially expressed
proteins we detected in the YNG-NT-020 comparison. Some studies have demonstrated a
protective effect of polyphenols in younger animals [64,65] but the general trend in these
studies points to a greater effect in older animals. A recent meta-analysis showed greater in-
cidence of increased benefits from polyphenol supplementation in younger individuals [66].
However, this effect might be independent of an effect on neuroinflammation specifically.
Improving MS techniques could increase the sensitivity and accuracy of protein detection
in the future. This improvement would allow deeper insights regarding the interaction
between polyphenols and aging microglial protein expression and resolve differences in
younger and older animals. Under development are more optimized methods for quan-
titative profiling that enable the identification of over 6000 proteins via two-dimensional
fractionation [67]. Such a technique reduces sample complexity and allows for a greater de-
tection of low abundance proteins compared to the detection method used in our study. We
were unable to quantify specific cytokines such as interleukin-1 (IL-1), interleukin-6 (IL-6),
or tumor necrosis factor alpha (TNF-α) typically used to measure inflammatory states in
microglia. Optimizing our detection protocols would provide enhanced proteome datasets
to use in our downstream pathway analyses. Complex pathologies require comprehensive
therapies for generating positive health outcomes and promoting well-being. Polyphenols
offer such a means of combating aging pathology through the ease with which polyphenols
are consumed through diet, their widespread availability, and their rising prevalence in the
global market.
4. Materials and Methods
4.1. Animal Protocol and NT-020 Supplementation
All procedures were approved by the local institutional animal welfare committee.
Male Fischer 344 rats either 3–5 months (YNG) or 20–22 months (OLD) of age were ran-
domly segregated into two treatment groups: one group was fed an NIH31 control diet
and the experimental group was fed a modified diet that included the NT-020 formulation
at 135 mg/kg for 30 days (YNG-Tx & OLD-Tx).
NT-20 is a proprietary formulation that contains green tea extract which is a minimum
of 95% polyphenols and 45% EGCG, blueberry powder from fruit, carnosine, 2000 IU
Vitamin D3, and 40 mg grape seed extract. Initial studies describing the formulation
described the process for choosing the formulation based upon screening many individual
ingredients followed by targeted combinations; the choice of the final formulation showed
more than additive effects of the four ingredients on stimulating the proliferation of stem
cells in culture [26]. The dose of NT-020 used is based upon the recommended daily dose
of NT-020 for humans. Dosing in animal models is adjusted for the metabolic rate, which is
roughly 10× that of humans.
4.2. Microglial Extraction and Cell Culture
Rats were euthanized with CO2 according to IACUC standards. Brains were sur-
gically removed following decapitation. Primary microglia were harvested as a single
cell suspension with the MACS Neural Tissue Dissociation Kit (Miltenyi Biotec, San Jose,
CA, USA, 130-092-628). The procedure is described briefly as follows: brains were placed
in cold HBSS (w/o Ca+2, Mg+2) on ice. Brains were mechanically dissociated in a petri
dish using a sterile scalpel and enzymatically digested with manufactured buffers; then,
they were filtered through 70 µM cell strainers. An isotonic percoll solution was used to
remove myelin from the cell suspension. After red blood cell lysis, microglia from cell
suspensions were isolated via magnetic bead separation with microbeads specific to rat
CD11b/c (Miltenyi Biotec, San Jose, CA, USA, 130-105-634). Total yield per brain was an
estimated 1.5 million cells with 95% purity confirmed via immunostaining.Int. J. Mol. Sci. 2021, 22, 6373 11 of 15
4.3. Sample Lysis, In-Gel Digest, and Label-Free Quantification
Primary microglia were lysed in a solution prepared from 4% SDS (w/v), 100 mM
Tris-HCl (pH 7.6), 100 nM DTT, with protease and phosphatase inhibitors were added.
The resulting lysate was sonicated at 20% amplitude in six-second pulses three times;
then, it was centrifuged, and the supernatant was collected. Microglial protein extracts
were separated by 1D SDS-PAGE followed by application of Coomasie stain for 30 min.
Gels were de-stained with de-stain solution (50% methanol, 40% H2 O, 10% acetic acid)
twice in 15-min intervals; then, they were washed three times for 10 min using diH2O.
Individual lanes were fractionated by excision of the lane into three separate gel regions;
then, they were further cubed and placed in labeled 1.5 mL Eppendorf tubes. Samples
were washed twice with acetonitrile (ACN) (50% in diH2 O) and vortexed for 15 min. ACN
was removed, and samples were rehydrated with 100 mM ammonium bicarbonate (ABC)
solution for 5 min. An equivalent volume of ACN was added to samples followed by a
15-min vortex cycle, which was followed by a final aspiration and dry cycle in a speedvac
for 5 min. Samples were rehydrated in 50 mM dithiothreitol (DTT) in 25 mM ABC solution
and incubated for 30 min at 55 ◦ C. When samples were returned to room temperature,
DTT was removed, 100 mM iodoacetamide (IAA) in 25 mM ABC solution was added, and
samples were incubated for 30 min. IAA was removed, and samples were washed three
times for 15 min in 50:50 ACN/100 mM ABC. Buffer was removed, and samples were
completely dried in a SpeedVac concentrator and then placed on ice for 5 min before being
trypsinized overnight at 37 ◦ C. Samples were desalted on C18 SPE columns, concentrated
with a vacuum concentrator, and resuspended in 0.1% formic acid before MS analysis.
Relative protein quantification was performed by label-free MS-based quantitation.
Digested peptides were separated on an Acclaim PepMap C18 (75 µm × 50 cm) UPLC
column using an EASY-nLC 1000 with a gradient of 4–40% acetonitrile with 0.1% formic
acid over 120 min. A top 10 data dependent acquisition (DDA) method with a scan range
of 375–1500 m/z was utilized. The resolution of MS1 and MS2 were 70,000 (AGC of 1e6)
and 17,500 (AGC of 2e5), respectively. Charge state exclusions included unassigned, 1, and
greater than or equal to 8. Dynamic exclusion was set at 8 s. MS data were searched against
the UniprotKB database for Rattus norvegicus (downloaded 02/26/2021 with 29,936 entries)
using MaxQuant (ver. 1.6.17.0). Initial database search parameters included a precursor
ion mass tolerance of 20 ppm with a recalibrated main search tolerance of 4.5 ppm, a
minimum peptide length of 7 amino acids, and a maximum of 2 missed cleavages. Variable
modifications included methionine oxidation and N-terminal protein acetylation. Cysteine
carbamidomethylation was set as a fixed modification. LFQ intensities for each protein
were first filtered for potential contaminants, only identified by site, and reverse sequences
in excel before being analyzed in Perseus (ver. 1.6.1.1). Sample groups were then annotated,
LFQ values were log2 transformed, and then, the groups were filtered for 75% valid values
in total (among both replicates and comparisons). Missing LFQ values were imputed via
Perseus with width and downshift parameters set to 0.4–0.7 and 1.4–1.6 in order to achieve
appropriate lower end distribution of imputed values relative to the overall normally
distributed log2 LFQ values for each group comparison [25] (see also Table S1 for full list
of LFQ intensities across sample groups). Protein fold change ratios and Welch’s t-test
differences were calculated from average LFQ intensities across the following comparisons:
AGING (OLD/YNG), YNG-NT-020 ((YNG-Tx)/YNG), and OLD-NT-020 ((OLD-Tx)/OLD).
Statistical significance was determined via Welch’s t-test in addition to a secondary filter of
|z-score| > 1 to obtain appropriate FDR while maintaining sensitivity [25]. Fold change
ratios and p-values for each comparison were uploaded into Ingenuity Pathway Analysis
(IPA) for further predictive analyses.
4.4. Simple Western
Protein expression levels were measured via the WES instrument (ProteinSimple, San
Jose, CA, USA, #004-600). Samples were prepared at 0.3 mg/mL in 0.1× sample buffer
(ProteinSimple, 042-195) and combined with 5× Fluorescent Master Mix (ProteinSimple,Int. J. Mol. Sci. 2021, 22, 6373 12 of 15
PS-FL01-8) (1-part master mix to 4 parts lysate). Biotinylated ladder (MW 12-230 kDa)
(ProteinSimple, PS-ST03EZ-8) was mixed with 16 µL deionized water, 2 µL 10× sample
buffer, and 2 µL 400 mM DTT solution. Samples and ladder were denatured at 95 ◦ C for
5 min, vortexed, and then placed on ice. CD11b (Novus, NB110-89474), Complement C3
(Novus, NBP1-32080), PGRMC1 (Novus, Centennial, CO, USA, NBP1-83220), Thioredoxin
1 (Cell Signaling, Danvers, MA, USA, 2429S), or GAPDH (Sigma-Aldrich, St. Louis, MO,
USA, G9545) 1◦ antibodies were diluted separately in antibody diluent (ProteinSimple,
042-203). Chemiluminescent substrate (ProteinSimple, PS-CS01) was prepared by com-
bining equal parts luminol-s and peroxide. Finally, ladder, samples, antibody diluent,
primary antibodies, streptavidin-HRP (ProteinSimple, 042-414), anti-rabbit secondary (Pro-
teinSimple, 042-206), and chemiluminescent substrate were pipetted on a WES microplate
(ProteinSimple, SM-W003) with wash buffer (ProteinSimple, 042-202). Microplates were
assayed under default protocol settings. Chemiluminescence in triplicate was obtained for
each sample with each antibody, averaged, then normalized to average chemiluminescence
for GAPDH.
4.5. Gene Ontology Analysis with GOplot in R
We performed gene ontology on differentially expressed proteins (p < 0.05) in the
AGING and OLD-NT-020 comparisons using the GOplot package in R [26]. Circle plots
generated with the GOCircle script integrated functional enrichment analysis on dataset
proteins based on z-score using g: Profiler output [27].
4.6. Proteomic Comparisons in IPA
We used the IPA core analysis function to explore changes in canonical pathways and
relevant cell function activity with age and NT-020 treatment. Molecules were analyzed
for causal relationships against the Ingenuity Knowledge Base (reference set), and both
direct and indirect relationships were considered. Reference data in IPA were sourced
from Ingenuity Expert Findings and Ingenuity Supported Third Party Information. We
adjusted the p-value cutoff for analysis to p < 0.1 to increase the number of functional
associations between dataset proteins. Canonical pathways were scored for p-value of
overlap (p(r), which the measures enrichment of experimental proteins relative to the
Ingenuity Knowledge Base and activation z-score, which infers predicted regulation relative
to downstream protein expression. Predicted activity in annotated cell functions was
determined via z-score.
Supplementary Materials: The following are available online at https://www.mdpi.com/article/
10.3390/ijms22126373/s1, Table S1: Dataset Proteins, Table S2: g-Profiler GO Analysis, Table S3:
Canonical Pathways.
Author Contributions: Conceptualization, P.C.B., A.J., S.M.S.J.; methodology, S.M.S.J., D.C., J.G., A.F.,
C.H., A.J.; formal analysis, A.J., J.G., S.M.S.J.; writing—original draft preparation, A.J.; writing—review
and editing, P.C.B., S.M.S.J. and A.J. All authors have read and agreed to the published version of
the manuscript.
Funding: This work was supported by I01BX003421, IK6BX004214 (P.C.B.) and AG062961-01 (A.J.).
Institutional Review Board Statement: All work involving animals was reviewed and approved by
the USF IACUC.
Informed Consent Statement: Not applicable.
Data Availability Statement: The data presented in this study are available in Table S1: Dataset Proteins.
Conflicts of Interest: P.C.B. is co-Founder of NaturaTherapeutics, Inc. that owns and licenses IP
related to NT-020. P.C.B. is an inventor on the IP related to NT-020.
References
1. Hou, Y.; Dan, X.; Babbar, M.; Wei, Y.; Hasselbalch, S.G.; Croteau, D.L.; Bohr, V.A. Ageing as a risk factor for neurodegenerative
disease. Nat. Rev. Neurol. 2019, 15, 565–581. [CrossRef] [PubMed]Int. J. Mol. Sci. 2021, 22, 6373 13 of 15
2. Norden, D.M.; Godbout, J.P. Review: Microglia of the aged brain: Primed to be activated and resistant to regulation. Neuropathol.
Appl. Neurobiol. 2012, 39, 19–34. [CrossRef]
3. Colton, C.A. Heterogeneity of Microglial Activation in the Innate Immune Response in the Brain. J. Neuroimmune Pharmacol. 2009,
4, 399–418. [CrossRef] [PubMed]
4. Li, Q.; Barres, B.A. Microglia and macrophages in brain homeostasis and disease. Nat. Rev. Immunol. 2018, 18, 225–242. [CrossRef]
5. Wake, H.; Moorhouse, A.J.; Jinno, S.; Kohsaka, S.; Nabekura, J. Resting Microglia Directly Monitor the Functional State of
Synapses In Vivo and Determine the Fate of Ischemic Terminals. J. Neurosci. 2009, 29, 3974–3980. [CrossRef] [PubMed]
6. Parkhurst, C.N.; Gan, W.-B. Microglia dynamics and function in the CNS. Curr. Opin. Neurobiol. 2010, 20, 595–600. [CrossRef]
[PubMed]
7. Durafourt, B.A.; Moore, C.S.; Zammit, D.A.; Johnson, T.A.; Zaguia, F.; Guiot, M.-C.; Bar-Or, A.; Antel, J.P. Comparison of
polarization properties of human adult microglia and blood-derived macrophages. Glia 2012, 60, 717–727. [CrossRef] [PubMed]
8. Smith, J.A.; Das, A.; Ray, S.K.; Banik, N.L. Role of pro-inflammatory cytokines released from microglia in neurodegenerative
diseases. Brain Res. Bull. 2012, 87, 10–20. [CrossRef]
9. Fu, R.; Shen, Q.; Xu, P.; Luo, J.J.; Tang, Y. Phagocytosis of Microglia in the Central Nervous System Diseases. Mol. Neurobiol. 2014,
49, 1422–1434. [CrossRef] [PubMed]
10. Von Bernhardi, R.; Eugenín-von Bernhardi, L.; Eugenín, J. Microglial cell dysregulation in brain aging and neurodegeneration.
Front. Aging Neurosci. 2015, 7, 124. [CrossRef]
11. Luo, X.-G.; Ding, J.-Q.; Chen, S.-D. Microglia in the aging brain: Relevance to neurodegeneration. Mol. Neurodegener. 2010, 5, 12.
[CrossRef]
12. Mandrekar-Colucci, S. Microglia and Inflammation in Alzheimers Disease. CNS Neurol. Disord. Drug Targets 2010, 9, 156–167.
[CrossRef]
13. Boillée, S.; Yamanaka, K.; Lobsiger, C.S.; Copeland, N.G.; Jenkins, N.A.; Kassiotis, G.; Kollias, G.; Cleveland, D.W. Onset and
Progression in Inherited ALS Determined by Motor Neurons and Microglia. Science 2006, 312, 1389–1392. [CrossRef] [PubMed]
14. Zhang, W.; Wang, T.; Pei, Z.; Miller, D.S.; Wu, X.; Block, M.L.; Wilson, B.; Zhang, W.; Zhou, Y.; Hong, J.-S.; et al. Aggregated
α-synuclein activates microglia: A process leading to disease progression in Parkinson’s disease. FASEB J. 2005, 19, 533–542.
[CrossRef] [PubMed]
15. Flowers, A.; Bell-Temin, H.; Jalloh, A.; Stevens, S.M.; Bickford, P.C. Proteomic analysis of aged microglia: Shifts in transcription,
bioenergetics, and nutrient response. J. Neuroinflamm. 2017, 14, 96. [CrossRef] [PubMed]
16. Frank, M.G.; Barrientos, R.M.; Biedenkapp, J.C.; Rudy, J.W.; Watkins, L.R.; Maier, S.F. mRNA up-regulation of MHC II and pivotal
pro-inflammatory genes in normal brain aging. Neurobiol. Aging 2006, 27, 717–722. [CrossRef] [PubMed]
17. Stichel, C.; Luebbert, H. Inflammatory processes in the aging mouse brain: Participation of dendritic cells and T-cells. Neurobiol.
Aging 2007, 28, 1507–1521. [CrossRef] [PubMed]
18. Sierra, A.; Gottfried-Blackmore, A.C.; McEwen, B.S.; Bulloch, K. Microglia derived from aging mice exhibit an altered inflamma-
tory profile. Glia 2007, 55, 412–424. [CrossRef] [PubMed]
19. Kitazawa, M.; Oddo, S.; Yamasaki, T.R.; Green, K.N.; LaFerla, F.M. Lipopolysaccharide-Induced Inflammation Exacerbates Tau
Pathology by a Cyclin-Dependent Kinase 5-Mediated Pathway in a Transgenic Model of Alzheimer’s Disease. J. Neurosci. 2005,
25, 8843–8853. [CrossRef]
20. Lee, D.C.; Rizer, J.; Selenica, M.-L.B.; Reid, P.; Kraft, C.; Johnson, A.; Blair, L.; Gordon, M.N.; Dickey, C.A.; Morgan, D. LPS-
induced inflammation exacerbates phospho-tau pathology in rTg4510 mice. J. Neuroinflamm. 2010, 7, 56. [CrossRef] [PubMed]
21. Chiu, H.-F.; Venkatakrishnan, K.; Wang, C.-K. The role of nutraceuticals as a complementary therapy against various neurodegen-
erative diseases: A mini-review. J. Tradit. Complement. Med. 2020, 10, 434–439. [CrossRef]
22. Liu, H.-W.; Chan, Y.-C.; Wang, M.-F.; Wei, C.-C.; Chang, S.-J. Dietary (−)-Epigallocatechin-3-gallate Supplementation Counteracts
Aging-Associated Skeletal Muscle Insulin Resistance and Fatty Liver in Senescence-Accelerated Mouse. J. Agric. Food Chem. 2015,
63, 8407–8417. [CrossRef] [PubMed]
23. Sarubbo, F.; Ramis, M.R.; Kienzer, C.; Aparicio, S.; Esteban, S.; Miralles, A.; Moranta, D. Chronic Silymarin, Quercetin and
Naringenin Treatments Increase Monoamines Synthesis and Hippocampal Sirt1 Levels Improving Cognition in Aged Rats.
J. Neuroimmune Pharmacol. 2018, 13, 24–38. [CrossRef] [PubMed]
24. Calvello, R.; Cianciulli, A.; Nicolardi, G.; De Nuccio, F.; Giannotti, L.; Salvatore, R.; Porro, C.; Trotta, T.; Panaro, M.A.; Lofrumento,
D.D. Vitamin D Treatment Attenuates Neuroinflammation and Dopaminergic Neurodegeneration in an Animal Model of
Parkinson’s Disease, Shifting M1 to M2 Microglia Responses. J. Neuroimmune Pharmacol. 2016, 12, 327–339. [CrossRef]
25. Mukherjee, B.S.; Mk, P.; Poddar, M.K. Carnosine restores aging-induced elevation of corticosterone status and brain regional
amyloid-beta in relation to down regulation of locomotor activity. J. Syst. Integr. Neurosci. 2019, 5, 1–11. [CrossRef]
26. Bickford, P.C.; Tan, J.; Shytle, R.D.; Sanberg, C.D.; El-Badri, N.; Sanberg, P.R. Nutraceuticals Synergistically Promote Proliferation
of Human Stem Cells. Stem Cells Dev. 2006, 15, 118–123. [CrossRef]
27. Yasuhara, T.; Hara, K.; Maki, M.; Masuda, T.; Sanberg, C.D.; Sanberg, P.R.; Bickford, P.C.; Borlongan, C.V. Dietary Supplementation
Exerts Neuroprotective Effects in Ischemic Stroke Model. Rejuvenation Res. 2008, 11, 201–214. [CrossRef] [PubMed]
28. Acosta, S.; Jernberg, J.; Sanberg, C.D.; Sanberg, P.R.; Small, B.J.; Gemma, C.; Bickford, P.C. NT-020, a Natural Therapeutic Approach
to Optimize Spatial Memory Performance and Increase Neural Progenitor Cell Proliferation and Decrease Inflammation in the
Aged Rat. Rejuvenation Res. 2010, 13, 581–588. [CrossRef] [PubMed]You can also read