Exploring sunflower responses to Sclerotinia head rot at early stages of infection using RNA seq analysis - Nature
←
→
Page content transcription
If your browser does not render page correctly, please read the page content below
www.nature.com/scientificreports
OPEN Exploring sunflower responses
to Sclerotinia head rot at early
stages of infection using RNA‑seq
analysis
Mónica I. Fass1,7*, Máximo Rivarola1,7, Guillermo F. Ehrenbolger1, Carla A. Maringolo2,
Juan F. Montecchia1, Facundo Quiroz2, Francisco García‑García3, Joaquín Dopazo Blázquez4,5,
H. Esteban Hopp1,6, Ruth A. Heinz1, Norma B. Paniego1,7 & Verónica V. Lia1,7
Sclerotinia head rot (SHR), caused by the necrotrophic fungus Sclerotinia sclerotiorum, is one
of the most devastating sunflower crop diseases. Despite its worldwide occurrence, the genetic
determinants of plant resistance are still largely unknown. Here, we investigated the Sclerotinia-
sunflower pathosystem by analysing temporal changes in gene expression in one susceptible and two
tolerant inbred lines (IL) inoculated with the pathogen under field conditions. Differential expression
analysis showed little overlapping among ILs, suggesting genotype-specific control of cell defense
responses possibly related to differences in disease resistance strategies. Functional enrichment
assessments yielded a similar pattern. However, all three ILs altered the expression of genes involved
in the cellular redox state and cell wall remodeling, in agreement with current knowledge about
the initiation of plant immune responses. Remarkably, the over-representation of long non-coding
RNAs (lncRNA) was another common feature among ILs. Our findings highlight the diversity of
transcriptional responses to SHR within sunflower breeding lines and provide evidence of lncRNAs
playing a significant role at early stages of defense.
Sunflower is one of the most important crops for the production of high-quality oil and seeds consumed by
both humans and livestock. In recent years, sunflower production showed a steady increase driven by a boost in
sunflower oil consumption (FAO, 2017). However, the projected expansion of the sunflower oil market requires
appropriate agronomic management and improved genetic resources to cope with abiotic and biotic stresses.
Among the latter, special attention should be paid to fungal diseases, as they have the greatest impact on yield
and seed quality1.
The necrotrophic fungus Sclerotinia sclerotiorum is the causal agent of Sclerotinia head (SHR) and stalk (SSR)
rots in sunflower. In particular, SHR is a recurrent disease in sunflower-growing areas worldwide. It affects oil
quality and, under favourable conditions, may lead to total production loss1,2. Chemical fungicides proved to be
ineffective and breeding of resistant genotypes has emerged as the most promising control strategy3. So far, there
is no evidence of any major gene controlling the resistance to SHR in sunflower. Instead, inbred lines (ILs) show
a broad range of responses in accordance with quantitative disease resistance (QDR) patterns depending on the
genotype4–8. During the last 20 years, QTL mapping techniques have been used to unravel the complexity of
the defense response to both SHR and SSR in sunflower. Biparental mapping has led to the discovery of several
main effect loci and epistatic i nteractions9–11, whereas association mapping has served to identify candidate genes
1
Instituto de Agrobiotecnología y Biología Molecular (IABIMO), Instituto Nacional de Tecnología Agropecuaria
(INTA), Consejo Nacional de Investigaciones Científicas y Técnicas (CONICET), Hurlingham B1686IGC, Buenos
Aires, Argentina. 2Instituto Nacional de Tecnología Agropecuaria (INTA). Estación Experimental Agropecuaria
Balcarce, Balcarce, Argentina. 3Bioinfomatics and Biostatistics Unit, Principe Felipe Research Center, Valencia,
Spain. 4Clinical Bioinformatics Area, Fundación Progreso y Salud (FPS), CDCA, Hospital Virgen del Rocio,
41013 Sevilla, Spain. 5INB-ELIXIR-Es, FPS, Hospital Virgen del Rocío, 42013 Sevilla, Spain. 6Departamento de
Fisiología, Biología Molecular y Celular (FBMC), Facultad de Ciencias Exactas y Naturales (FCEyN), Universidad
de Buenos Aires (UBA), 1428, Ciudad Universitaria, Buenos Aires, Argentina. 7These authors contributed equally:
Mónica I. Fass, Máximo Rivarola, Norma B. Paniego and Verónica V. Lia. *email: fass.monica@inta.gob.ar
Scientific Reports | (2020) 10:13347 | https://doi.org/10.1038/s41598-020-70315-4 1
Vol.:(0123456789)
www.nature.com/scientificreports/
responsible for S. sclerotiorum resistance12–14. Notwithstanding this, little is known about the genetic architecture
of quantitative resistance and the functional components of the defense response.
The fungus penetrates the host cuticle through mechanical means and by secreting an arsenal of cell wall-
degrading enzymes, small proteins and secondary metabolite toxins, with oxalic acid being the major virulence
factor. Diseased plants develop water-soaked lesions, tissue necrosis and finally bear s clerotia15,16, and in response
to damage they can activate an array of perception mechanisms and signal transduction pathways that trigger
QDR17. The polyphagous nature of S. sclerotiorum, which has been reported to infect over 400 plant species18, has
allowed the identification of pathogen-responsive genes in a variety of model and economically important species.
In line with current knowledge of the molecular mechanisms underlying plant immune response, transcriptomic
studies in Brassica napus, Arabidopsis thaliana and Glycine max have shown that defense against S. sclerotiorum
involves members of the WRKY transcription factor family, pathogenesis related (PR) proteins, as well as genes
related to signal transduction, cellular redox state, cell wall composition and hormone signaling p athways19–24.
However, there are no reports on the transcriptional response of sunflower to SHR.
Although SHR consistently causes water-soaked lesions and necrosis, the histopathology and time from
infection to symptom onset differ among s pecies16. In particular, sunflowers show no visible SHR symptoms for
at least ten days after inoculation6, but microscopic lesions have been detected after a 24-h incubation period in
susceptible and tolerant varieties, with the latter showing a slower progression of the d isease25.
Transcriptional profiling at the site of infection provides an efficient means to reflect the natural epidemiologic
cycle and constitutes an appealing alternative to discriminate among responses of genotypes with contrasting
behaviour against the disease. RNA-sequencing (RNA-seq) has proven to be a powerful method to detect, map
and quantify transcripts in several plant-pathogen interactions, regardless of the tissue under analysis or previous
genomic knowledge26. A few studies conducted in cultivated sunflower have exploited the advantages and sensi-
tivity of this methodology to identify differentially-expressed genes under biotic or abiotic stress c onditions27,28,
and none of them addressed the S. sclerotiorum-sunflower interaction. Indeed, only two low-throughput tran-
scriptomic studies have focused on this pathosystem29,30. In addition, most transcriptomic analyses of Sclerotinia
infection were made with data obtained from symptomatic p lants20–22. However, transcriptional changes taking
place during the asymptomatic period can provide insights into initial defense mechanisms and into the diversity
of responses to the disease in different crops.
The aim of this study was to investigate the transcriptional response of sunflower during early stages of SHR.
To this end, control and inoculated capitula of one susceptible and two tolerant ILs were subjected to RNA-seq
at 0, 4 and 8 days post-inoculation (dpi) to analyze their expression patterns and gain a comprehensive view of
the mechanisms involved in the defense against S. sclerotiorum infection.
Results
Disease assessment. ILs HA89, HA853 and RK416 were grown under field conditions during season
2010–11 at the experimental station INTA Balcarce (Buenos Aires, Argentina). After sampling for the RNA-seq
experiments, additional plants of the different ILs were maintained in the field to evaluate disease evolution and
confirm the efficacy of inoculation. Commercial hybrids ACA861 and Dekalb 3820 were used as susceptible
and tolerant controls, respectively. The distinct symptoms of SHR were observed in all cases. The three ILs and
the hybrids showed an increase in infection levels over time, as evidenced by both disease incidence (DI) and
disease severity (DS) scores. DI values exhibited a fast increment in HA89 and ACA 861 and a slower escalation
in HA853 and Dekalb 3820, whereas RK416 showed an intermediate behaviour. DS estimates revealed a rapid
spread of the fungus in ACA 861, a slower advance in HA89, while RK416, HA853 and Dekalb 3820 showed
a delayed expression of symptoms and did not reach the DS values of the first two cultivars (Supplementary
Fig. S1).
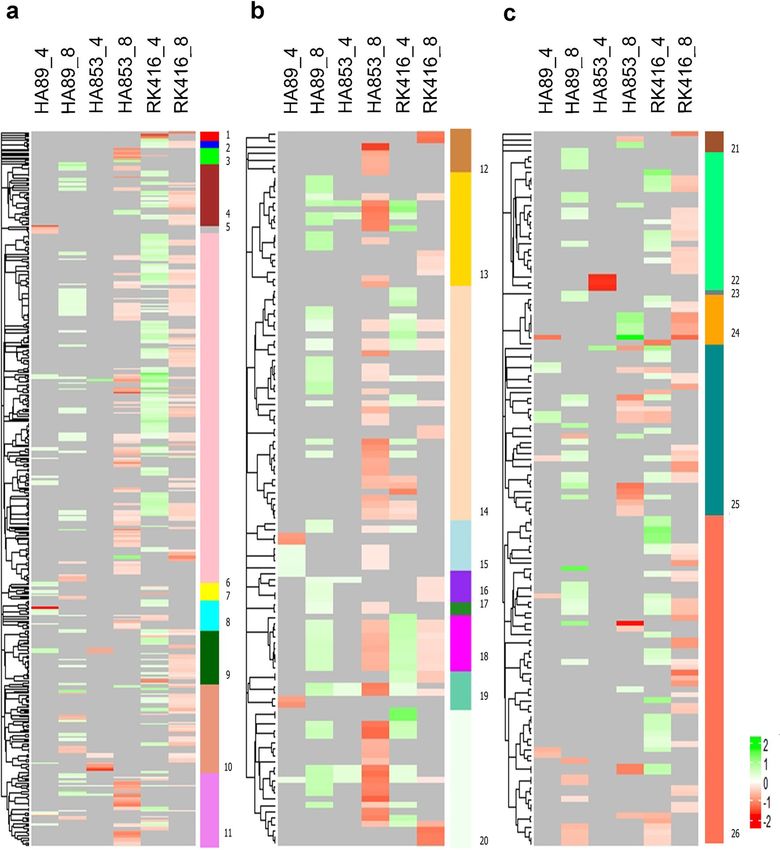
Overview of RNA‑seq analysis. Between 14.1 and 88.04 million reads per sample were mapped to the
HanXRQ v1 sunflower genome (mean 42.18 ± 12.62 million reads). An average of 64.18 ± 5.91% and 17.62 ± 1.84%
of reads were mapped uniquely and non-uniquely to the reference, respectively (Fig. 1a), whereas 18.19 ± 7.33%
of the total reads could not be mapped and were excluded from the analysis (Supplementary Table S1).
Transcript expression levels were established at 0, 4 and 8 dpi in inoculated (I) and control (N) capitula of
sunflower ILs HA89, HA853 and RK416 (Supplementary Table S2). Transcripts with more than 1 CPM in half of
the samples were considered for further analysis, encompassing 31,673 of the 58,050 inferred genes annotated in
the HanXRQ v1 sunflower genome31. Of these, 29,329 correspond to protein-coding genes (mRNAs) and 2,344
correspond to non-coding RNAs (ncRNAs).
Overall similarities between ILs and time point conditions were explored using PCA. Three samples from
RK416 (4_18_RK416_0_I, 1_5_RK416_0_N and 2_11_RK416_8_I) were identified as outliers and thus removed
from the analysis. In the final PCA, the first two principal components accounted for 57.82% of the total vari-
ation and grouped samples mainly by IL, separating RK416 samples from those of HA89 and HA853 (Fig. 1b).
Within lines, samples were clustered according to the plant developmental stage (0, 4 and 8 dpi), irrespective of
the inoculation condition, showing the greatest differences between 8 dpi and the previous time points. These
results reveal large transcriptomic differences between RK416 and the other two ILs and imply an increasing
time effect, consistent with the progression of disease symptoms.
Analysis of differentially expressed genes. The expression levels of the 31,673 transcripts were esti-
mated for each inoculation treatment and IL-time point combination. To validate these results, we assessed
the correlation between RNA-seq transcription ratios (I/N) and those obtained in qPCR assays at 4 and 8 dpi.
Between six and twelve genes were compared for each IL and time point. Only three genes were available for
Scientific Reports | (2020) 10:13347 | https://doi.org/10.1038/s41598-020-70315-4 2
Vol:.(1234567890)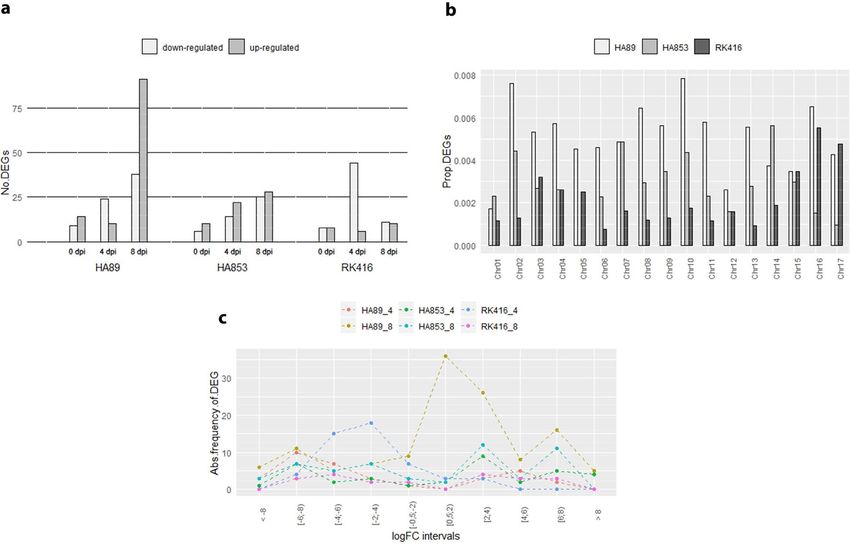
www.nature.com/scientificreports/
Figure 1. Overview of RNA-seq data. (a) Mean of Unique, Non-unique and Unmapped reads for each
treatment and IL-time point combination. (b) Principal component analysis of 53 samples based on the
expression levels of 31,673 transcripts.
comparison in HA853 at 4 dpi, and therefore it was excluded from the analysis. In general, expression results
from both methods were highly correlated, with coefficients ranging from 0.90 to 0.98 (p < 0.05). The only excep-
tion was HA89 at 8 dpi, which showed a weak and non-significant association (Supplementary Fig. S2).
To minimise false positives due to multiple testing, only those genes with FDR < 0.05 were assessed and
categorised as differentially expressed (DEGs) at each IL-time point combination. Differences at 0 dpi were also
identified to quantify the level of noise generated from sources other than inoculation. A total of 378 DEGs
were found, of which 186, 105 and 87 corresponded to HA89, HA853 and RK416, respectively (Supplementary
Table S3). The following distribution of DEGs was obtained at 0, 4 and 8 dpi: 23, 34 and 129 for HA89, 16, 36
and 53 for HA853 and 16, 50 and 21 for RK416 (Fig. 2a). As expected, the number of DEGs was larger at 4 and
8 dpi than at 0 dpi. Most IL-time point combinations had similar numbers of up- and down-regulated DEGs.
Notably, HA89 showed the largest proportion of up-regulated DEGs at 8 dpi and RK416 the largest proportion
of down-regulated ones at 4 dpi.
The analysis of the distribution of DEGs across chromosomes indicated that all ILs presented DEGs in the
17 chromosomes, except for HA853 with no representation in chromosome 5. Chromosomes 2 and 10 had the
highest number of DEGs, while chromosomes 1 and 12 had the lowest. Since HA89 encompassed the largest
number of DEGs, these were the most abundant transcripts in 13 of the 17 chromosomes. Conversely, HA853
and RK416 showed a comparable amount of DEGs across the genome, except for chromosomes 16 and 17 where
RK416 DEGs were more abundant (Fig. 2b).
In addition, to uncover distinct patterns of expression in the different IL-time point combinations, the dis-
tribution of the log2 fold change (logFC) for down- and up-regulated genes was analysed at 4 and 8 dpi (Fig. 2c).
Overall values varied from |0.73| to |10.19|, irrespective of gene regulation. Inspection of Fig. 2c shows a large
number of values within the lower intervals for HA89 at 8 dpi and more homogeneous patterns for the remain-
ing IL-time point combinations.
The analysis of the DEG intersections among IL-time point combinations showed that there were only
four DEGs in common between HA89 and HA853, albeit with opposite expression behaviour. Genes
HanXRQChr04g0102281 and HanXRQChr13g0407331 were down-regulated in the susceptible line and up-
regulated in the tolerant HA853 line. Conversely, genes HanXRQChr03g0066301 and HanXRQChr10g0282011
were down-regulated in HA853 and up-regulated in HA89. RK416 shared no DEGs with the other two lines.
In addition, the intersection between time points within ILs included two DEGs for HA89, four for HA853 and
none for RK416. A summary of these results is shown in Table 1.
Altogether, the ensemble of genes responding to the infection was IL-specific, suggesting the coordination
of idiosyncratic reactions at early stages of the infection process.
To determine if DEGs were located close to previously reported QTLs11,12, and to reinforce the results obtained
by both methodologies, we searched for DEGs in the vicinity of the molecular markers (MM) associated with
SHR tolerance (Supplementary Table S4). Examination of these regions allowed the detection of five DEGs within
the established 1 Mbp windows (Table 2). In detail, genes HanXRQChr03g0080031 and HanXRQChr03g0080021
were close to each other and within the range of MM HeAn_R_283.1, gene HanXRQChr10g0296411
was the closest to MM ORS437, gene HanXRQChr14g0449141 was in the vicinity of MM G34, while gene
HanXRQChr14g0460321 was found near MM HaCOI1-1.
Scientific Reports | (2020) 10:13347 | https://doi.org/10.1038/s41598-020-70315-4 3
Vol.:(0123456789)www.nature.com/scientificreports/
Figure 2. Analysis of DEGs. (a) Number of up- and down-regulated DEGs between I and N samples. (b)
Proportion of DEGs relative to all expressed transcripts in each IL distributed across chromosomes. (c) Absolute
Frequency of DEGs at different intervals of logFC values for each IL-time point combination (0 dpi not shown).
Gene ID Functional description HA89_4 HA89_8 HA853_4 HA853_8
HanXRQChr04g0102281 Spliced ncRNA – − 7.45 – 2.97
HanXRQChr03g0066301 Transcription factor IBH1 – 2.35 – − 1.69
HanXRQChr10g0282011 NA – 7.38 – − 6.79
HanXRQChr13g0407331 NA – − 1.42 7.55 –
HanXRQChr11g0350011 Retrovirus-related Pol poly from transposon TNT 1–94 − 6.91 7.89 – –
Mitochondrial import inner membrane translocase subunit
HanXRQChr13g0418051 − 7.66 − 6.91 – –
TIM14-1
HanXRQChr10g0287891 NA – – − 3.55 3.02
HanXRQChr14g0449141 Spliced ncRNA – – 6.37 − 6.46
HanXRQChr14g0435741 NA – – − 7.00 − 6.27
HanXRQChr11g0331821 Alcohol dehydrogenase – – 9.32 − 9.64
Table 1. Functional description and logFC values of the DEGs shared by the different IL-time point
combinations and/or time points within ILs.
Molecular marker Functional
DEG IL-time point Chr (MM) QTL source Distance to MM (bp) description of DEG
HanXRQChr03g0080031 HA89_4 3 HeAn_R_283.1 BM 106,548 NA
HanXRQChr03g0080021 HA89_4 3 HeAn_R_283.1 BM 108,115 ncRNA
DEAD-box ATP-
HanXRQChr10g0296411 HA853_8 10 ORS437 BM 7,475 dependent RNA
helicase 40
HanXRQChr14g0449141 HA853_4-8 14 G34 AM 469,108 ncRNA
Hypoxia-responsive
HanXRQChr14g0460321 HA89_8 14 HaCOI AM 615,017
family
Table 2. DEGs located in the vicinity of QTLs associated with SHR resistance by biparental (BM) or
association (AM) mapping.
Scientific Reports | (2020) 10:13347 | https://doi.org/10.1038/s41598-020-70315-4 4
Vol:.(1234567890)www.nature.com/scientificreports/
Functional analysis. The functional annotation of DEGs was compiled from the HanXRQ v1 sunflower
transcriptome31 (Supplementary Table S5). Gene Ontology (GO) Enrichment Analysis showed that no GO
terms were significantly over-represented when strictly considering the DEG list. Despite the lack of enriched
GO terms among DEGs in the different IL-time point combinations, at least one gene from each group
was associated with defense processes. These include glutathione S-transferase DHAR3, chloroplastic-like
(HanXRQChr13g0424161, HA89_4 dpi), probable leucine rich repeat (LRR) receptor-like serine threonine-
kinase At1g07650 (HanXRQChr04g0123251, HA89_8 dpi), resistance RGC2, partial (HanXRQChr02g0057101,
HA853_4 dpi), S-norcoclaurine synthase-like (HanXRQChr13g0397881, HA853_8 dpi), pathogenesis-related 1
(HanXRQChr04g0109991, RK416_4 dpi) and major allergen Pru ar 1-like (HanXRQChr03g0090261, RK416_8
dpi), among o thers32–37. Additionally, the MapMan ontology was used to organise the DEGs into main functional
categories and relate them to possible processes occurring during the defense response to the infection (Sup-
plementary Table S6 and Supplementary Fig. S3). Of the 34 specific functional categories (BINs) of the ontology,
23 were represented by at least one DEG. However, most DEGs fell within the “not assigned” category (BIN 35).
The remaining DEGs were most frequently related to “protein” (BIN 29), “RNA” (BIN 27), “signalling” (BIN 30)
and “transport” (BIN 34), in which the most common processes altered were protein degradation, regulation
of transcription, as well as the transcriptional variation of receptor kinases. Relevant categories for the defense
response included “cell wall” (BIN 10), “hormone metabolism” (BIN 17) and “stress” (BIN 20), which were rep-
resented in all ILs. Overall, our results revealed that although there was modulation of similar processes among
ILs, they were mediated by different biological molecules.
To extend the exploration of enriched GO terms, a logistic regression was applied on the whole gene set,
indexed according to logFC values and the adjusted p-value. This Gene Set Enrichment Analysis (GSEA)
approach yielded a total of 1,128 over-represented GO terms (biological process (BP): 704; cellular component
(CC): 227; molecular function (MF): 197) (Supplementary Table S7). RK416 presented the largest number of
enriched GO terms, followed by HA853 and HA89. The latter two lines showed only a few enriched GO terms at
4 dpi (55 and 26, respectively), but these increased three to ten times at 8 dpi. In comparison, RK416 maintained
a similar number of enriched GO terms at both time points.
There was little overlapping of enriched GO terms among IL-time point combinations. Only 15% of GO
terms were shared by at least half of the combinations, and just a few were shared by five or six of them (i.e.,
photosynthesis, BP; photosynthesis, light reaction, BP; ribosome biogenesis, BP; cytosolic part, CC; ribosomal
subunit, CC). After checking for redundancy, 699 unique GO terms were identified (BP: 455; CC: 114; MF: 130).
Figure 3 shows the dendrogram derived from the GO term similarity matrix obtained with GoSemSim, with
the corresponding LOR plotted as a heatmap for each IL-time point combination. The LORs of the different
GO terms were assigned by Multidimensional Gene Set A nalysis38 based on the expression levels of the genes
included within each category. It is noteworthy that the functional categories over-represented in HA89 at 8 dpi
and RK416 at 4 dpi were mainly derived from up-regulated genes, while HA853 and RK416 at 8 dpi showed the
opposite pattern.
The classification of GO terms according to their GoSemSim similarities allowed the delimitation of func-
tional modules (Fig. 3, Supplementary Table S8). In this way, apparently unconnected GO terms were grouped
into more general processes, thus becoming comparable between the different IL-time point combinations. In
regard to BP, “metabolic processes” was the main functional module, i.e. the one including the largest number
of related GO terms, and, to a lesser extent, “response to stimuli” and “cellular organisation and biogenesis” were
also frequently represented. In the CC category, the main functional module was “organelles”, closely followed
by “protein-containing complexes” and “membrane and membrane-related complexes”. As for MF, the main
functional module was “catalytic activity”. Secondary modules included “binding” and “transporter activity”.
In general, functional modules consisted of GO terms from all the IL-time point combinations, indicating a
modulation of similar general processes but with different actors being involved in each condition.
A gene set enrichment analysis based on the Kyoto Encyclopedia of Genes and Genomes (KEGG) database
revealed two enzyme KEGG identifiers (EC) over-represented in HA89 at 8 dpi, both belonging to Class “Oxi-
doreductases”. One EC from the class “Hydrolases” was identified in HA853 at 8 dpi, whereas eight EC were
identified in RK416 at 4 dpi, half of them being “Transferases” and the other half “Hydrolases”. Finally, one EC
classified within “Oxidoreductases” was identified in RK416 at 8 dpi (Supplementary Table S9). Although all of
them can be related to defense processes, the enzymatic reactions identified in this analysis were not completely
concordant among ILs.
Study of differentially expressed ncRNAs in response to S. sclerotiorum infection. Taking into
account that ncRNA genes are not part of GO terms, but that they were frequently represented in the IL-time
point combinations, their enrichment in the different groups was examined through Irwin-Fisher tests (Supple-
mentary Table S10). The proportion of differentially expressed ncRNAs compared to that of the remaining ncR-
NAs was significantly higher in HA89 at both time points, in HA853 at 8 dpi and in RK416 at 4 dpi (p-value < 0.05)
(Fig. 4). According to the HanXRQ v1 annotation, all ncRNAs corresponded to the splice ncRNA category. They
were considered as long ncRNAs (lncRNAs) based on the length of the identified transcripts (> 200 bp).
Because lncRNAs are involved in transcriptional and post-transcriptional regulation of protein-coding RNAs,
we used the LncTar algorithm to predict putative mRNA targets among DEGs. This tool computes the normalised
binding free energy (ndG) between molecules, thereby estimating a putative interaction. Here, differentially
expressed protein-coding genes and lncRNAs of the same IL at 4 and 8 dpi were used as input to predict their
binding capability. We identified one possible mRNA-lncRNA interaction for RK416, nine for HA89 and none
for HA853 (Table 3). Of these, six pairs were differentially expressed at different time points and four at 8 dpi.
Additionally, only four pairs showed the same expression behaviour.
Scientific Reports | (2020) 10:13347 | https://doi.org/10.1038/s41598-020-70315-4 5
Vol.:(0123456789)www.nature.com/scientificreports/
Figure 3. Heatmaps based on the LOR values of GO terms grouped by semantic similarities. Functional
terms over-represented in up-regulated genes (green) are differentiated from those over-represented in
down-regulated genes (red) upon inoculation. (a) BP ontology, (b) CC ontology and (c) MF ontology. Vertical
coloured bars represent functional modules in which GO terms were categorised. 1: miscellaneous processes;
2: immune system process; 3: miscellaneous organisation; 4: transport and localisation; 5: reproductive
development; 6: metabolic process; 7: developmental process; 8: cell integrity; 9: biological regulation; 10:
response to stimuli; 11: cellular organisation and biogenesis; 12: miscellaneous CC ; 13: membrane and
membrane-related complexes; 14: organelles; 15: extracellular region and cell junction; 16: Golgi and ER; 17:
encapsulating structure; 18: thylakoid; 19: lytic organelles; 20: protein-containing complexes; 21: miscellaneous
MF; 22: transporter activity; 23: antioxidant activity; 24: molecular function regulation; 25: binding; 26: catalytic
activity.
Although such interactions need further experimental confirmation, these results provide a first approach
to assess the involvement of lncRNAs in sunflower defense processes.
Discussion
The identification of the genes underlying quantitatively inherited traits is one of the most challenging tasks for
molecular breeders. Nonetheless, gene pyramiding strategies are considered the most effective way to achieve
durable resistance39–41. Large-scale transcriptional studies are a fruitful source of novel candidate genes, as
well as a means of validating previous results obtained by other approaches. By conducting a genome-wide
Scientific Reports | (2020) 10:13347 | https://doi.org/10.1038/s41598-020-70315-4 6
Vol:.(1234567890)www.nature.com/scientificreports/
Figure 4. Analysis of ncRNA enrichment for the different treatments; *: p < 0.05.
lncRNA mRNA/target
Inbred line Gene ID dpi Fold-change Gene ID dpi Fold-change ndG Functional description of mRNA
RK416 HanXRQChr01g0005231 8 − 2.68 HanXRQChr14g0427881 4 − 4.46 − 0.4193 NA
HA89 HanXRQChr08g0221721 4 2.44 HanXRQChr02g0038901 8 − 4.74 − 0.7460 NA
HA89 HanXRQChr08g0226611 4 − 8.97 HanXRQChr08g0235441 8 − 6.13 − 0.2542 NA
HA89 HanXRQChr08g0229491 4 5.07 HanXRQChr02g0038901 8 − 4.74 − 0.5924 NA
HA89 HanXRQChr16g0506901 4 4.72 HanXRQChr17g0559391 8 − 6.99 − 0.2190 Quinone oxidoreductase 2 homolog
HA89 HanXRQChr02g0033591 8 − 2.00 HanXRQChr02g0046121 4 − 1.58 − 0.6558 NA
HA89 HanXRQChr08g0226611 8 − 8.97 HanXRQChr10g0314321 8 3.06 − 0.1667 E3 UFM1- ligase 1 homolog
HA89 HanXRQChr13g0406311 8 3.64 HanXRQChr02g0041971 8 − 7.42 − 0.1620 Mitogen-activated kinase 16, partial
HA89 HanXRQChr13g0406311 8 3.64 HanXRQChr02g0046121 8 − 1.58 − 0.2095 NA
PREDICTED: uncharacterised protein
HA89 HanXRQChr13g0406311 8 3.64 HanXRQChr10g0308951 8 2.28 − 0.1504
LOC103323638
Table 3. Putative lncRNA-mRNA interactions within DEGs. ndG normalised free energy, NA not available.
transcriptomic analysis of one susceptible and two tolerant sunflower ILs to SHR, we were able to uncover new
molecular determinants of defense under conditions that mimic the natural infection process.
In this study, we established the expression profiles of more than half of the annotated genes in the sunflower
genome across ILs, inoculation treatments and time points. However, the number of DEGs identified here was
relatively low compared to those generally reported in RNA-seq analyses conducted for other pathosystems (e.g.
Gao et al., Kamber et al., Song et al., Wu et al.42–45). At early stages, SHR is restricted to a small portion of the
inflorescence. Therefore, RNA extraction from the whole set of florets in each capitulum may have diluted the
biological signal, limiting our ability to detect the full range of transcriptional changes triggered by the pathogen.
Although our approach may have prevented the detection of many of the small expression changes expected at
the onset of infection, when no symptoms are v isible46,47, it is likely to have detected more reliable and stronger
expression variations. Indeed, several DEGs were readily identified at 4 dpi in all ILs, indicating a rapid activation
and amplification of plant defense responses.
A comparison of gene activity elicited upon infection revealed limited commonalities among the three ILs
and between time points within ILs. HA89 and HA853 were the only ILs that shared DEGs and the fact that these
had opposite expression suggests a converging pathway leading to different responses. Of the four genes, one
is described as a transcription factor (IBH1) involved in the modulation between growth and immunity in A.
thaliana48, another one is inferred to be a ncRNA, while the remaining two have no known function. The singular
behaviour of these genes may be indicative of their relevance in the defense pathway, making them promising
candidates for improving r esistance24,49. On the other hand, although HA853 and RK416 have been character-
ized as tolerant to S HR6, they had no DEGs in common. The comparison of time points within ILs revealed
two and six DEGs at 4 and at 8 dpi in HA89 and in HA853, respectively. The sustained differential expression of
these genes suggests a modulation over time, in contrast to the time-specific response observed in most DEGs.
Against expectations, more DEGs were detected at 4 dpi than at 8 dpi in RK416, which may indicate an earlier
activation of defense mechanisms. Altogether, tolerant lines appear to deploy different responses to fungal attack.
Scientific Reports | (2020) 10:13347 | https://doi.org/10.1038/s41598-020-70315-4 7
Vol.:(0123456789)www.nature.com/scientificreports/
This differential pattern of defense is concordant with the diverse origins of the ILs used in this study and with
the dynamics of the sunflower domestication process, which included a larger number of genes with a small phe-
notypic effect than in other domesticated plant s pecies50. Although the three ILs examined here are maintainer
lines, HA89 and HA853 originated in USA, whereas RK416 originated in Argentina. HA89 is derived from the
Russian domestic oilseed variety “Vniimk 8931”51, and HA853 from the “1975 High Yield Composite”, which in
turn was generated from 11 high-oil Russian c ultivars52. RK416 was developed by crossing the Composite Ruso,
derived from Smena, Arnavirsk, Peredovik and Vniimk open pollinated populations, with the variety Klein, an
Argentinian population based on Russian varieties, which were brought by Jewish immigrants as confectionery
seeds (Julio Gonzalez, pers. comm.).
It is known that Helianthus species possess a rich spectrum of non-redundant defense mechanisms, many of
which were introduced into cultivated sunflower from their wild relatives53,54. QTL mapping has served to con-
firm the diversity of SHR tolerance sources within breeding g ermplasm4,11,13,55, whereas combining transcriptomic
and QTL mapping data has recently emerged as a powerful tool to identify candidate genes24,56–58. Our transcrip-
tomic study showed that DEGs were homogeneously distributed throughout chromosomes, as expected for a
complex quantitative trait. Interestingly, the absence of a cluster of DEGs also suggests a staggered introgression
of defense responses, instead of large wild-relative introgression blocks derived from modern breeding. In addi-
tion, the results presented here allowed to refine the mapping resolution of the recent QTL analysis by identifying
five DEGs that co-localised with QTL regions. Functional annotations of these DEGs include one DEAD-box
ATP-dependent RNA helicase 40, one hypoxia-responsive family protein and two ncRNAs, one of which was
differentially expressed at 4 and 8 dpi in HA853, and the other has no known function. DEAD-box helicases
have been identified as key factors of abiotic stress responses in p lants59, and hypoxia-responsive proteins have
been related to group VII Ethylene Response Factors, which in turn comprises elements playing a central role in
defense against necrotrophic p athogens60–62. These putative functions, together with their relationship to previ-
ously identified QTLs, highlight the potential of these genes as candidates to improve resistance.
In this work, different functional approaches were undertaken to explore the molecular responses to SHR.
Regardless of the method employed, each IL-time point combination showed a unique array of over-represented
GO terms and catalytic enzymes. This suggests a differential contribution of IL-specific features to tolerance and
susceptibility, and the existence of alternative control strategies involved in cell defense response. Further group-
ing of GO terms into broad functional categories revealed that ILs shared common mechanisms (i.e. responses
to stimuli, catalytic processes or altered transport activities).
Two types of resistance have been described in sunflower: resistance to penetration and to mycelial spread
in tissues63. The type of resistance is likely modulated by the transcriptomic responses elicited upon infection,
as they represent the first line of defense and determine the outcome. The functional annotations of the DEGs
identified here, as well as their enriched GO terms, may be related to both resistance processes. In tems of QDR,
many causal genes are responsible for the defense response and act beyond pathogen recognition64. The percep-
tion of the pathogen frequently involves LRR receptor-like kinases (RLKs), which propagate external signals
through their kinase domain32,65. Signal transduction pathways are then mediated by kinase/phosphatase activity
and the alteration of ion fluxes, such as Ca2+66,67. To counteract pathogen infection, these signaling networks
regulate the activity of transcription factors, transcriptional machinery, enzymes and antimicrobial compounds,
including pathogenesis-related (PR) p roteins68–71. In accordance with this general mechanism, a putative LRR
RLK was found in HA89, while candidates involved in signaling networks or transcription factors were detected
in HA89 and HA853. In addition, putative PR1 and PR10 proteins were found down-regulated in RK416 at 4
and 8 dpi. As suggested by Cregeen et al. and Upadhyay et al.72,73, the down-regulation of PR proteins may be
responsible for the delay in the appearance of symptoms observed in tolerant plants, by blocking fungal spread.
Since expression of PR1 is related to a salicylic acid (SA) response, it can also be inferred that the SA-pathway is
suppressed upon infection in the tolerant IL R K41674.
In agreement with current knowledge about the initiation of plant immune responses, all three ILs altered
the expression of genes involved in the cellular redox state75,76. In addition, the studied ILs appear to reorganise
their cell wall composition and use extracellular compounds during defense. We also found genes and GO terms
directly associated with defense responses, particularly in RK416 and, to a lesser extent, in HA853 (e.g. a resist-
ance gene candidate 2 34; a S-norcoclaurine synthase-like g ene35; or a Universal stress protein A 77). Overall, the
functional analysis reinforces the idea of genotype-specific activation of defense pathways. Based on the DEGs
and the GO terms enriched in the different ILs, RK416 exhibits the widest arsenal of resources to resist fungal
penetration, at least in the environment in which our experiment was performed.
Noteworthy, the most consistent signal in the defense response of sunflower to SHR seems to be related to
ncRNAs. Two out of the five DEGs found in the vicinity of previously identified QTLs are ncRNAs, two out of
ten DEGs shared by the different IL-time point combinations are ncRNAs, and the ncRNA category is signifi-
cantly enriched in four out of the six IL-time point combinations. A survey of ncRNA studies has shown that
genes encoding RNAs, rather than proteins, have both structural and regulatory functions78,79. In this study,
we could only assess spliced ncRNAs over 200 nt (i.e. long ncRNAs) due to a bias towards the sequencing of
polyadenylated RNAs. LncRNAs are poorly conserved and display diverse synthesis, processing and regulatory
functions. In plants, lncRNAs can function as g ene80–82, transcription83–85, or epigenetic r egulators86. Moreover,
they are known to participate in basal defense against stresses, including response to pathogenic fungi, where
they act as precursors of sRNAs, microRNAs (miRNAs) and/or small interfering RNAs (siRNAs)87–91. Recently, it
was found that A. thaliana cells secrete exosome-like extracellular vesicles to deliver sRNAs into Botrytis cinerea,
a fungal necrotrophic pathogen affiliated to S. sclerotiorum. The sRNAs transferred by the host induce silencing
of fungal genes essential for p athogenicity92.
Although ncRNAs appear to play a significant role as a first line of defense to SHR in sunflower, the specific
mechanisms by which they operate are yet to be determined. Analysis of RNA–RNA interactions revealed
Scientific Reports | (2020) 10:13347 | https://doi.org/10.1038/s41598-020-70315-4 8
Vol:.(1234567890)www.nature.com/scientificreports/
possible mRNA targets within DEGs, but RNA–DNA or RNA–protein interactions cannot be ruled out. In
particular, the genes HanXRQChr03g0080021 and HanXRQChr03g0080031, coding a lncRNA and a mRNA,
respectively, could represent an example of a RNA–DNA interaction, as their vicinity may facilitate a cis-acting
regulatory function of t ranscription79,93.
The relationship between tolerance to SHR and the expression patterns observed in this study is still difficult
to determine. In a recent multi-environment trial, RK416 and HA853 ranked among the top 20 of 137 ILs, with
RK416 showing lower DI and DS scores than HA8536. These findings were only partially replicated in our field
trial, where HA853 outperformed RK416, although both exhibited a similar behaviour to that of the tolerant
control Dekalb 3820. In line with these observations, sunflower response to SHR is known to be greatly affected
by environmental variables such as temperature, humidity, and rainfall6. In this context, our results suggest that
the ensemble of DEGs identified here may only partially represent the full array of sunflower responses to SHR,
with differences in environmental conditions triggering additional reactions, even for the same IL.
In sum, this research represents the first report on the transcriptional changes occurring in sunflower upon
infection with S. sclerotiorum. Our results suggest genotype-specific defense responses, in line with the diversity
of tolerance levels observed under field c onditions6. The combined analysis of transcriptomics and QTL map-
ping reported here provides a promising approach to identify relevant genes and genomic regions associated
with QDR. Finally, the involvement of ncRNAs adds an unexpected complexity to the discovery of the genetic
determinants of SHR resistance.
Methods
Plant material and field trial. Three sunflower public ILs were used in this study: HA89, HA853 and
RK416. Plants of each IL were grown under field conditions during season 2010–11 at the experimental station
INTA Balcarce (Buenos Aires, Argentina). A randomised complete block design comprising three blocks with a
furrow per IL was used. Furrows were 6 m long and spaced 75 cm apart. Commercial sunflower lines ACA861
and Dekalb3820 were included in each block as susceptible and tolerant controls, respectively.
Plants that reached the R5.2 flowering stage of the Schneiter and Miller94 scale on the same day were selected
in pairs and capitula were ascospore- (2,500 ascospores/ml) (I) or mock- (water) (N) inoculated with 1 ml of
inoculum using a portable hand s prayer95. Ascospores were obtained by inducing carpogenic germination of
sclerotia, as described by Escande et al.95. Briefly, apothecia were produced from sclerotia collected at the end
of the 2009/2010 field trials from naturally and experimentally infected plants at agricultural station INTA
Balcarce. Mature apothecia were hold in Petri dishes, incubated for 4 h to favor ascospore release and finally
stored at − 18 °C until use. Inoculated capitula were collected at 0 (i.e. immediately after spraying), 4 and 8 dpi,
resulting in a total of 56 samples. Four biological replicates at 0 dpi and two biological replicates at 4 and 8 dpi
were analysed for HA853 and HA89, whereas four biological replicates were used for RK416 at all time points
(Supplementary Table S1). Time 0 after inoculation was included to assess the incidence of false positives in the
statistical analysis.
Given that SHR symptoms appear at least after 10 dpi6, 14 to 21 plants per block and IL were maintained in
the field to evaluate disease progression and confirm the effect of the inoculation protocol.
Disease assessment. Disease progression was quantified by estimating the phenotypic variables DI, i.e.,
the number of plants infected over the number of plants inoculated in each furrow, and DS, i.e., the average
proportion of capitulum rotted area of plants inoculated in each furrow. These variables have been described as
suitable for appraising the resistance to fungal penetration in the first case, and the resistance to the spread of
the fungus in the second case96.
For graphical visualization of the results, average DI and DS values per day post inoculation and IL were
plotted using GraphPad Prism, v 5.01 for Windows, GraphPad Software, La Jolla California USA, https://www.
graphpad.com (Supplementary Fig. S1).
RNA isolation and sequencing. Disc florets and bracts were scraped off each capitulum and grinded in
liquid nitrogen. Total RNA of 100 mg grinded material was extracted using the RNAqueous Kit with addition
of the Plant RNA Isolation Aid (Ambion, Applied Biosystems, USA). Samples were treated with DNase I (Inv-
itrogen, USA) for 20 min to remove remaining DNA. Sample purity, integrity and concentration were assessed
using the RNA 6000 Nano Reagent kit in a 2100 Bioanalyzer (Agilent Technologies, Palo Alto, California, USA).
Sequencing libraries were prepared using an Illumina TruSeq RNA Sample Preparation Kit following the
manufacturer’s instructions. Libraries were sequenced using the Illumina HiSeq 2000 system at the Centre
Nacional d’Anàlisi Genòmica (CNAG: https://www.cnag.crg.eu/, Barcelona, Spain) as unstranded single-end
reads of 50 bp in length. The original data set was deposited at the NCBI Sequence Read Archive (Submission
ID: SUB5575431, BioProject ID: PRJNA561716).
Analysis of RNA‑seq data. Low-quality bases (average Q-score below 20) and adaptor sequences were
trimmed and sequences with less than 36 bases long were removed with Trimmomatic97. The remaining reads
were mapped to the Helianthus annuus XRQ (HanXRQ v1) genome-derived transcriptome (https://www.helia
gene.org/HanXRQ-SUNRISE/)31 with Bowtie2, using the global sensitive parameter and allowing all multimap-
ping reads to be mapped98. The EM algorithm of eXpress was used for transcriptome q uantification99. Differen-
100
tial gene expression analysis was performed with the program edgeR . In summary, transcripts with < 1 CPM in
half of the samples were filtered out and then normalised using the trimmed mean of M-values (TMM) method.
Read counts for each gene were fit to a negative binomial generalised log-linear model using the glmFit function,
defined as:
Scientific Reports | (2020) 10:13347 | https://doi.org/10.1038/s41598-020-70315-4 9
Vol.:(0123456789)www.nature.com/scientificreports/
Yijkl = µ + Gi + Dj + Tk + Ll + GDTjik + εijkl
which includes the IL (G) i, the day post inoculation (D) j, the inoculation treatment (T) k and the sequencing
lane (L) l as factors, and the interaction among G, D and T.
To identify DEGs, genewise likelihood ratio tests between I and N samples were conducted using the glmLRT
method for each IL-time point combination. Transcripts were considered as differentially expressed between
ascospore- and mock-inoculated treatments if the absolute value of logFC was ≥ 0.6 and FDR was < 0.05.
Validation of RNA‑seq analysis by qPCR. qPCR assays, which were previously performed to validate
a microarray experiment conducted on the same samples as our RNA-seq analyses, were used to confirm the
transcript levels estimated here.
Briefly, cDNA for qPCR was synthesised using Superscript III first strand synthesis system (Invitrogen, USA)
and random hexamer primers according to the manufacturer’s instructions. For amplification, a 25-µl reaction
mix containing 200 nM of each primer, 1 µl of cDNA sample and FastStart Universal SYBR Green Master (Roche
Applied Science, Germany) was run in a 96-well plate thermocycler (ABI Prism 7000 Sequence Detection Sys-
tem and software, PE Applied Biosystems, USA). Amplification efficiencies and Ct values were determined for
each transcript using L inRegPCR101. The relative expression of the genes was determined using the “RT-PCR
comparison of relative gene expressions analysis” included in the InfoStat s oftware102. Actin was established as
internal standard after comparison with Elongation Factor-1α and Tubulin using the program Bestkeeper103.
Primer pairs used for the qPCR assays are listed in Supplementary Table S11.
Co‑localisation of DEGs to previously identified QTLs. To investigate the putative correspondence
between previously reported QTLs and the DEGs identified here, 39 MM associated with SHR r esistance11,12
were mapped to the HanXRQ v1 genome31 using primersearch v6.6.0.0 for in silico PCR104. DEGs falling
within a window size of ± 1 Mbp around the MM were considered to co-localise with the QTLs (Supplementary
Table S4).
Functional profiling of genes. To assess the over-representation of GO categories, Single Enrichment
analyses were performed on DEGs from each IL and time point using F atiGO105.
Mapman classification106 was used to interpret DEGs in the context of hierarchically organised cellular path-
ways and processes focused on plant m etabolism107,108. To enable mapping, the genes predicted in the HanXRQ
v1 sunflower genome annotation were re-annotated through the Mercator pipeline using A. thaliana’s functional
annotation109, following Moschen et al.110.
In addition, a GO GSEA based on logistic regression was also applied to the whole gene set using the uvgsa
function of the mdgsa R package38, with transcripts indexed by the logFC and the adjusted p-value. Enrichment
was considered significant for p < 0.05, after Benjamini & Yekutieli111 correction for multiple testing. To evaluate
the affiliations among the over-represented GO terms, semantic similarities were computed using the goSim
function of the GOSemSim R package112 based on the genome-wide annotation for Arabidopsis113. Terms not
identified in this database were given zero similarity relative to the other terms. GO terms were plotted on heat-
maps according to their LOR values and grouped by semantic similarities using the complete-linkage hierarchical
clustering method implemented in the R package ComplexHeatmaps.
Finally, to explore systems and chemical information collected in the KEGG database, a KEGG gene set
analysis was also performed using the uvgsa function as described previously.
All analyses were performed based on the HanXRQ v1 gene annotation from Badouin et al.31.
Analysis of differentially expressed non‑coding RNAs. To include ncRNAs into the functional
enrichment analysis, the number of differentially expressed ncRNAs of each IL-time point combination was
compared to the total number of expressed ncRNAs by bilateral Irwin-Fisher tests using I nfoStat102.
The LncTar software, version of November 10, 2015114 was used to predict the interaction between the ncRNAs
and the mRNAs differentially expressed in each IL. Type 1 command line was used to perform all ncRNAs- vs.
all mRNAs predictions. Following the developers’ recommendations, a ndG cutoff of − 0.15 was used to obtain
high confidence predictions.
Data availability
All data generated or analysed during this study are included in this published article, its Supplementary Infor-
mation files or deposited at the NCBI Sequence Read Archive (Submission ID: SUB5575431, BioProject ID:
PRJNA561716).
Received: 6 November 2019; Accepted: 24 July 2020
References
1. Pereyra, V. R. & Escande, A. Enfermedades del Girasol en la Argentina : Manual de Reconocimiento. (Instituto Nacional de Tec-
nología Agropecuaria, 1994).
2. Gulya, T., Rashid, K. Y. & Masirevic, S. M. Sunflower diseases. in Sunflower Technology and Production (ed. Schneiter, A. A.)
263–379 (1997).
3. Mantecon, J. D. & Pereyra, V. Integrated control methods for managing sunflower head rot in Argentina. Int. J. Pest Manag. 43,
143–144 (1997).
Scientific Reports | (2020) 10:13347 | https://doi.org/10.1038/s41598-020-70315-4 10
Vol:.(1234567890)www.nature.com/scientificreports/
4. Bert, P. F. et al. Comparative genetic analysis of quantitative traits in sunflower (Helianthus annuus L.) 1. QTL involved in resist-
ance to Sclerotinia sclerotiorum and Diaporthe helianthi. Theor. Appl. Genet. 105, 985–993 (2002).
5. Castaño, F. & Giussani, M. A. Effectivness of components of partial resistance in assessing white rot of sunflower head. Helia
32, 59–68 (2009).
6. Filippi, C. V. et al. Phenotyping sunflower genetic resources for Sclerotinia head rot response: Assessing variability for disease
resistance breeding. Plant Dis. 101, 1941–1948 (2017).
7. Hahn, V. Genetic variation for resistance to Sclerotinia head rot in sunflower inbred lines. F. Crop. Res. 77, 153–159 (2002).
8. Leclerq, P. Influence de facteurs héréditaires sur la résistance apparente du tournesol á Sclerotinia sclerotiorum. Ann. Amélior.
Plantes 23, 279–286 (1973).
9. Talukder, Z. I., Seiler, G. J., Song, Q., Ma, G. & Qi, L. SNP discovery and QTL mapping of Sclerotinia basal stalk rot resistance
in sunflower using genotyping-by-sequencing. Plant Genome 9 (2016).
10. Yue, B. et al. Identifying quantitative trait loci for resistance to Sclerotinia head rot in two USDA sunflower germplasms. Phy-
topathology 98, 926–931 (2008).
11. Zubrzycki, J. E. et al. Main and epistatic QTL analyses for Sclerotinia head rot resistance in sunflower. PLoS ONE 12, e0189859
(2017).
12. Filippi, C. Diversidad Genómica y Mapeo por Asociación Para la Resistencia a la Podredumbre Húmeda del Capítulo Causada por
Sclerotinia sclerotiorum en Girasol. (Universidad de Buenos Aires, 2015).
13. Fusari, C. M. et al. Association mapping in sunflower for Sclerotinia head rot resistance. BMC Plant Biol. 12, 93 (2012).
14. Talukder, Z. I. et al. Candidate gene association mapping of Sclerotinia stalk rot resistance in sunflower (Helianthus annuus L.)
uncovers the importance of COI1 homologs. Theor. Appl. Genet. 127, 193–209 (2014).
15. Amselem, J. et al. Genomic analysis of the necrotrophic fungal pathogens Sclerotinia sclerotiorum and Botrytis cinerea. PLoS
Genet. 7, e1002230 (2011).
16. Bolton, M. D., Thomma, B. P. H. J. & Nelson, B. D. Sclerotinia sclerotiorum (Lib) de Bary: Biology and molecular traits of a
cosmopolitan pathogen. Mol. Plant Pathol. 7, 1–16 (2006).
17. Mbengue, M. et al. Emerging trends in molecular interactions between plants and the broad host range fungal pathogens Botrytis
cinerea and Sclerotinia sclerotiorum. Front. Plant Sci. 7, 1–9 (2016).
18. Boland, G. J. & Hall, R. Index of plant hosts of Sclerotinia sclerotiorum. Can. J. Plant Pathol. 16, 93–108 (1994).
19. Dai, F.-M., Xu, T., Wolf, G. A. & He, Z.-H. Physiological and molecular features of the pathosystem Arabidopsis thaliana L.-
Sclerotinia sclerotiorum Libert. J. Integr. Plant Biol. 48, 44–52 (2006).
20. Girard, I. J. et al. RNA sequencing of Brassica napus reveals cellular redox control of Sclerotinia infection. J. Exp. Bot. 68,
5079–5091 (2017).
21. Joshi, R. K., Megha, S., Rahman, M. H., Basu, U. & Kav, N. N. V. A global study of transcriptome dynamics in canola (Brassica
napus L.) responsive to Sclerotinia sclerotiorum infection using RNA-Seq. Gene 590, 57–67 (2016).
22. Wu, J. et al. Genome-wide association study identifies new loci for resistance to Sclerotinia stem rot in Brassica napus. Front.
Plant Sci. 7, 1418 (2016).
23. Zhao, J. et al. Analysis of gene expression profiles in response to Sclerotinia sclerotiorum in Brassica napus. Planta 227, 13–24
(2007).
24. Wen, Z. et al. Integrating GWAS and gene expression data for functional characterization of resistance to white mould in soya
bean. Plant Biotechnol. J. 16, 1825–1835 (2018).
25. Rodriguez, M. A., Venedikian, N., Bazzalo, M. E. & Godeas, A. Histopathology of Sclerotinia sclerotiorum attack on flower parts
of Helianthus annuus heads in tolerant and susceptible varieties. Mycopathologia 157, 291–302 (2004).
26. Han, Y., Gao, S., Muegge, K., Zhang, W. & Zhou, B. Advanced applications of RNA sequencing and challenges. Bioinform. Biol.
Insights 9, 29–46 (2015).
27. Guo, S. et al. Large-scale transcriptome comparison of sunflower genes responsive to Verticillium dahliae. BMC Genomics 18,
42 (2017).
28. Liang, C. et al. Identification of differentially expressed genes in sunflower (Helianthus annuus) leaves and roots under drought
stress by RNA sequencing. Bot. Stud. 58, 42 (2017).
29. Monazzah, M., Tahmasebi Enferadi, S. & Rabiei, Z. Enzymatic activities and pathogenesis-related genes expression in sunflower
inbred lines affected by Sclerotinia sclerotiorum culture filtrate. J. Appl. Microbiol. 125, 227–242 (2018).
30. Muellenborn, C., Krause, J.-H. & Cerboncini, C. Analysis of differential transcript expression reveals time-dependent leaf
responses to Sclerotinia sclerotiorum in wild and cultivated sunflower. Plant Mol. Biol. Report. 29, 597–608 (2011).
31. Badouin, H. et al. The sunflower genome provides insights into oil metabolism, flowering and Asterid evolution. Nat. Publ. Gr.
546, 148–152 (2017).
32. Afzal, A. J., Wood, A. J. & Lightfoot, D. A. Plant receptor-like serine threonine kinases: Roles in signaling and plant defense.
Mol. Plant-Microbe Interact. 21, 507–517 (2008).
33. Breen, S., Williams, S. J., Outram, M., Kobe, B. & Solomon, P. S. Emerging insights into the functions of pathogenesis-related
protein 1. Trends Plant Sci. 22, 871–879 (2017).
34. Christopoulou, M. et al. Genome-wide architecture of disease resistance genes in lettuce. G3 (Bethesda). 5, 2655–2669 (2015).
35. Desgagné-Penix, I. et al. Integration of deep transcriptome and proteome analyses reveals the components of alkaloid metabolism
in opium poppy cell cultures. BMC Plant Biol. 10, 252 (2010).
36. Fan, S. et al. A novel pathogenesis-related class 10 protein Gly m 4l, increases resistance upon Phytophthora sojae infection in
soybean (Glycine max [L.] Merr.). PLoS One 10, e0140364 (2015).
37. Gullner, G., Komives, T., Király, L. & Schröder, P. Glutathione S-transferase enzymes in plant-pathogen interactions. Front. Plant
Sci. 9, 1836 (2018).
38. Montaner, D. & Dopazo, J. Multidimensional gene set analysis of genomic data. PLoS ONE 5, e10348 (2010).
39. Fukuoka, S. et al. Gene pyramiding enhances durable blast disease resistance in rice. Sci. Rep. 5, 7773 (2015).
40. Hittalmani, S., Parco, A., Mew, T. V., Zeigler, R. S. & Huang, N. Fine mapping and DNA marker-assisted pyramiding of the three
major genes for blast resistance in rice. Theor. Appl. Genet. 100, 1121–1128 (2000).
41. Joshi, R. K. & Nayak, S. Gene pyramiding-A broad spectrum technique for developing durable stress resistance in crops. Bio-
technol. Mol. Biol. Rev. 5, 51–60 (2010).
42. Gao, Y. et al. Time-course transcriptome analysis reveals resistance genes of Panax ginseng induced by Cylindrocarpon destructans
infection using RNA-Seq. PLoS ONE 11, e0149408 (2016).
43. Kamber, T. et al. Fire blight disease reactome: RNA-seq transcriptional profile of apple host plant defense responses to Erwinia
amylovora pathogen infection. Sci. Rep. 6, 21600 (2016).
44. Song, Y. et al. Comparative transcriptome analysis of resistant and susceptible kiwifruits in response to Pseudomonas syringae
pv. Actinidiae during early infection. PLoS ONE 14, e0211913 (2019).
45. Wu, J. et al. Comparative transcriptomic analysis uncovers the complex genetic network for resistance to Sclerotinia sclerotiorum
in Brassica napus. Sci. Rep. 6, 19007 (2016).
46. de Haro, L. A. et al. Mal de Río Cuarto virus infection causes hormone imbalance and sugar accumulation in wheat leaves. BMC
Plant Biol. 19, 112 (2019).
47. Rezzonico, F., Rupp, O. & Fahrentrapp, J. Pathogen recognition in compatible plant-microbe interactions. Sci. Rep. 7, 6383 (2017).
Scientific Reports | (2020) 10:13347 | https://doi.org/10.1038/s41598-020-70315-4 11
Vol.:(0123456789)You can also read