A genome-wide association study identifies Arabidopsis thaliana genes that contribute to differences in the outcome of infection with two Turnip ...
←
→
Page content transcription
If your browser does not render page correctly, please read the page content below
Virus Evolution, 2021, 7(2), 1–13
                                                                                                                        DOI: https://doi.org/10.1093/ve/veab063
                                                                                                                   Advance access publication date: 30 June 2021
                                                                                                                                                  Research Article

A genome-wide association study identifies Arabidopsis
thaliana genes that contribute to differences in the
outcome of infection with two Turnip mosaic potyvirus
strains that differ in their evolutionary history and

                                                                                                                                                                         Downloaded from https://academic.oup.com/ve/article/7/2/veab063/6311756 by guest on 09 December 2021
degree of host specialization
Anamarija Butković,1,† Rubén González,1,‡ Mark Paul Selda Rivarez,1,2,§ and Santiago F. Elena1,3,*,**
1
  Instituto de Biología Integrativa de Sistemas (I2 SysBio), CSIC-Universitat de València, Catedrático Agustín Escardino 9, Paterna, València 46980, Spain, 2 Present
address: Department of Biotechnology and Systems Biology, National Institute of Biology, Večna pot 111, Ljubljana, 1000, Slovenia and 3 The Santa Fe Institute,
1399 Hyde Park Road, Santa Fe, NM 87501, USA
†
  https://orcid.org/0000-0002-1435-0912
‡
  https://orcid.org/0000-0001-9588-1127
§
  https://orcid.org/0000-0002-8544-5740
**
   https://orcid.org/0000-0001-8249-5593
*Corresponding author: E-mail: santiago.elena@csic.es

Abstract
Viruses lie in a continuum between generalism and specialism depending on their ability to infect more or less hosts. While generalists
are able to successfully infect a wide variety of hosts, specialists are limited to one or a few. Even though generalists seem to gain an
advantage due to their wide host range, they usually pay a pleiotropic fitness cost within each host. On the contrary, a specialist
has maximal fitness within its own host. A relevant yet poorly explored question is whether viruses differ in the way they interact
with their hosts’ gene expression depending on their degree of specialization. Using a genome-wide association study approach, we
have identified host genes whose expression depends on whether hosts were infected with more or less specialized viral strains.
Four hundred fifty natural accessions of Arabidopsis thaliana were inoculated with Turnip mosaic potyvirus strains with different past
evolutionary histories and that shown different degrees of specialization. Three disease-related traits were measured and associated
with different sets of host genes for each strain. The genetic architectures of these traits differed among viral strains and, in the case of
the more specialized virus, also varied along the duration of infection. While most of the mapped loci were strain specific, one shared
locus was mapped for both strains, a disease-resistance TIR-NBS-LRR class protein. Likewise, only putative cysteine-rich receptor-like
protein kinases were involved in all three traits. The impact on disease progress of 10 selected genes was validated by studying the
infection phenotypes of loss-of-function mutant plants. Nine of these mutants have altered the disease progress and/or symptoms
intensity between both strains. Compared to wild-type plants six had an effect on both viral strains, three had an effect only on the
more specialized, and two were significant during infection with the less specialized.

Key words: emerging viruses; GWAS; host-range; Potyvirus; specialism-generalism continuum; virus evolution; virus-host interactions

1. Introduction                                                                       viruses pose a great threat e.g. to monocultured crops since well-
                                                                                      adapted viruses usually show enhanced within-host replication
Viruses are constantly facing heterogeneity in the hosts they
                                                                                      rates that are often associated with stronger symptoms (Roossinck
infect. They face species with different response to infection or
                                                                                      2010; Lacroix et al. 2014; Stobbe and Roossinck 2016). Examples of
in many instances differences in immune status among indi-                            specialist viruses are Dengue flavivirus and Mumps orthorubulavirus,
viduals within the same host species. Some viruses adapt to                           among mammalian viruses, and Barley stripe hordeovirus from
a particular host species, genotype, or even cell type in which                       plants (Elena, Agudelo-Romero, and Lalić 2009; Roossinck 2010).
they efficiently complete their reproductive cycle (Turner and                        Other viruses infect hosts from widely different cell types, geno-
Elena 2000; Cooper and Scott 2001; Cuevas, Moya, and Elena                            types, species, or even higher taxonomical units and are dubbed
2003; Bedhomme, Lafforgue, and Elena 2012; Hillung et al. 2014;                       generalists (Elena, Agudelo-Romero, and Lalić 2009). Cucumber
Navarro et al. 2020). These viruses are called specialists. Specialist                mosaic cucumovirus (that infects more than 1,000 plant species)

© The Author(s) 2021. Published by Oxford University Press.
This is an Open Access article distributed under the terms of the Creative Commons Attribution License (http://creativecommons.org/licenses/by/4.0/),
which permits unrestricted reuse, distribution, and reproduction in any medium, provided the original work is properly cited.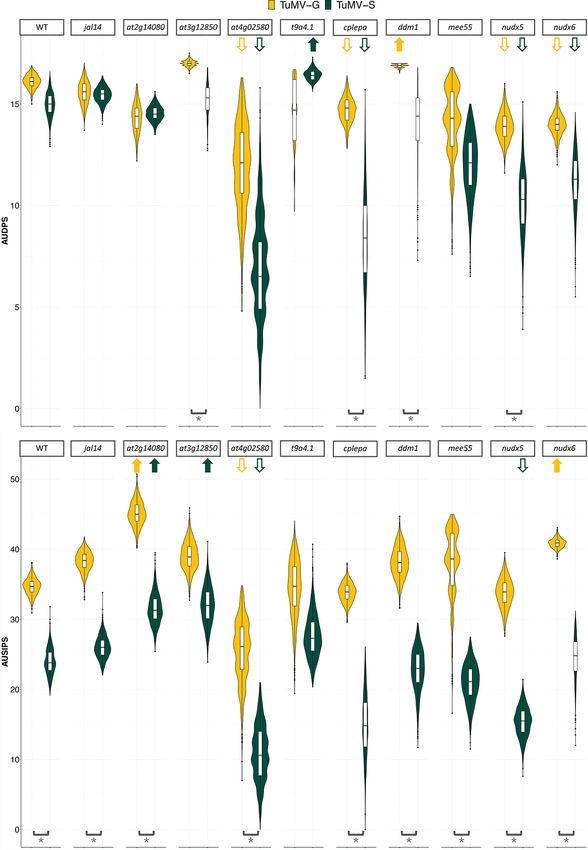
2     Virus Evolution

and the Alphainfluenzavirus (that infects birds, humans, and other         100 different hosts but produces ∼105 new viral particles in all
mammalian species) are examples of generalist viruses (Elena,              of them. According to the binary definition, both strains must be
Agudelo-Romero, and Lalić 2009).                                          considered as generalists. However, in our view the first strain is
    Each host range strategy comes with advantages and disadvan-           much closer to the specialist end while the second strain is much
tages. By hyperspecializing in a single host, a virus can limit inter-     closer to the generalist end of a continuum of possible interac-
specific competition and better access limited resources (Elena,           tions. In this study, we would take this second definition and refer
Agudelo-Romero, and Lalić 2009; Bedhomme, Hillung, and Elena              to specialist and generalist (or less specialist) viral strains of TuMV
2015). The advantage of generalism is the successful infection of          not on the basis of whether they infect one or more host genotypes
multiple hosts. However, there is an obvious limitation to gen-            but on the basis of how well they do across accessions.
eralism: by being able to infect multiple hosts a virus does not               The genetic basis of the observed differences between gener-
maximize fitness in any particular one, conforming to the jack-of-         alist and specialist viruses is actually poorly understood, at least
all-trades is a master of none hypothesis (Whitlock 1996; Bedhomme,        from the perspective of the interaction of these two strategies with
Hillung, and Elena 2015). It is proposed that selection favors spe-        the host’s gene expression. Differences between the genomes of
cialist viruses because there is a trade-off limiting the fitness of       generalist and specialist viruses have been previously described

                                                                                                                                                     Downloaded from https://academic.oup.com/ve/article/7/2/veab063/6311756 by guest on 09 December 2021
a generalist virus in any of the alternative hosts and evolution           (Takeuchi et al. 1991; Llamas-Saiz et al. 1996; Remold, Rambaut,
proceeds faster in narrower niches (Woolhouse 2001). Antagonis-            and Turner 2008; Deardroff et al. 2011; Hillung et al. 2014; Navarro
tic pleiotropy, where beneficial adaptations to a particular host          et al. 2020). However, so far just one study has sought to explore
could be disadvantageous in another (Lalić, Cuevas, and Elena             differential host responses associated with each virus strategy
2011), is the most commonly claimed mechanism to explain this              (Hillung et al. 2016).
trade-off. Furthermore, to infect multiple hosts, viruses might                Here, we aim to explore whether viral strains with different
need to encode for additional genetic information that would               degrees of specialization affect the plant physiology and disease
slow down their replication and increase their mutational fragility.       progress in different ways, identifying differentially responding
Also, mutations that are fixed in order to compensate for antag-           candidate host genes. To reach this goal, we have undertaken
onistic pleiotropy limit access to alternative evolutionary paths          a genome-wide association study (GWAS) approach. GWAS has
towards global maxima in the fitness landscape, reducing evolv-            gained popularity over the last 20 years due to the increasing
ability (Cervera, Lalić, and Elena 2016). All these characteris-          number of genome sequences available for a wide range of organ-
tics make specialists capable of faster evolution and adaptation           isms (Cantor, Lange, and Sinsheimer 2010; Bush and Moore
than generalists in the face of perturbations or new environ-              2012). The basis of GWAS is capturing single-nucleotide poly-
ments (Bedhomme, Hillung, and Elena 2015; Bono, Draghi, and                morphisms (SNPs) along the genome of an organism and using
Turner 2020). Although specialists tend to adapt faster to single          statistical methods (such as linear mixed models) to infer the
hosts, generalists usually outcompete them in fluctuating envi-            association of SNPs with the trait being analyzed. The common
ronments by being more prepared to survive and reproduce as a              disease-common variant hypothesis posits that common inter-
consequence of having similar fitness in different hosts (Kassen           acting alleles at multiple disease-predisposing loci underlie the
2002; Dennehy et al. 2013). This allows generalist viruses to have         most common diseases (Bush and Moore 2012). This hypothe-
higher initial fitness compared to specialists when infecting novel        sis would justify the use of GWAS in the identification of alleles
host species, making them most likely emerging and re-emerging             associated with specific phenotypes. This connection permits the
pathogens (Woolhouse and Gowtage-Sequeria 2005; Turner et al.              identification of genetic risk factors for disease, such as suscepti-
2010). Indeed, this theory has widespread support by experiments           bility and resistance to viral infections (Korte and Farlow 2013).
in which viral lineages being sequentially exposed to different            One of the most relevant inferences from GWAS is trait heri-
hosts for long periods of time maximize their fitness in all hosts         tability, which indicates how much of the observed phenotypic
to the same extent as the corresponding specialist, thus over-             variation is explained by genotypic variation (SNPs) relative to the
coming the expected costs of generalism (Turner and Elena 2000;            contribution of environmental factors (Zaitlen and Kraft 2012).
Duffy, Turner, and Burch 2006; Deardorff et al. 2011; Bedhomme,                Identifying host factors responsible for resistance or permis-
Lafforgue, and Elena 2012; Remold 2012).                                   siveness to infection is a major goal when studying host–pathogen
    Before moving forward, we would make a remark about def-               interactions, as this knowledge will help in better management of
initions: specialist and generalists are usually defined by many           diseases. Here, we have characterized the infection of two strains
authors as the two sides of a coin, as discrete events. That is, a         of turnip mosaic virus (TuMV; species Turnip mosaic potyvirus,
virus would be defined as a specialist if and only if it infects one or,   genus Potyvirus, Family Potyviridae) that differ in their degree of
at best, a few closely related host species (or genotypes). In contra-     specialization in 450 natural accessions of A. thaliana (L.) Heynh.
position, a virus would be a generalist if and only if it infects more     TuMV infects mostly Brassicaceae and is widespread worldwide
than one host species (or genotypes). This binary definition, how-         causing important economical loses by damaging several impor-
ever, does not fully reflect the complexity of interactions between        tant crops (Ohshima et al. 2002; Yasaka et al. 2017). One of the
parasites and their potential hosts. Specialism and generalism             natural hosts of TuMV is A. thaliana (Pagán et al. 2010). This plant
are broad terms that can be applied to different levels; viruses           is undoubtedly one of the most suitable organisms for GWAS.
that are able to infect only one or more different hosts species,          It has over 1,000 natural accessions genotyped and described
cell types, or genotypes (Turner and Elena 2000; Cooper and Scott          so far from Eurasia, North America, and North Africa (1001
2001; Cuevas, Moya, and Elena 2003; Bedhomme, Lafforgue, and               Genomes Consortium 2016). Genotypes can be maintained by self-
Elena 2012; Navarro et al. 2020). Let us take a very simple numeri-        fertilization for an unlimited number of generations, facilitating
cal example that easily illustrates this inconsistency. Imagine that       GWAS and making phenotyping highly reproducible (Korte and
a viral strain infects 100 different hosts (species, genotypes, or cell    Farlow 2013). The viral strains used in this study were obtained by
types) but, in 99 of them, produces few, say 10, new viral parti-          Navarro et al. (2020) after experimental evolution of an A. thaliana-
cles, whilst, in the remaining one host, it produces 1010 new viral        naïve ancestral TuMV isolate. This ancestral TuMV was evolved in
particles. Now imagine a second viral strain that infects the same         plant genotypes deficient in different disease signaling pathways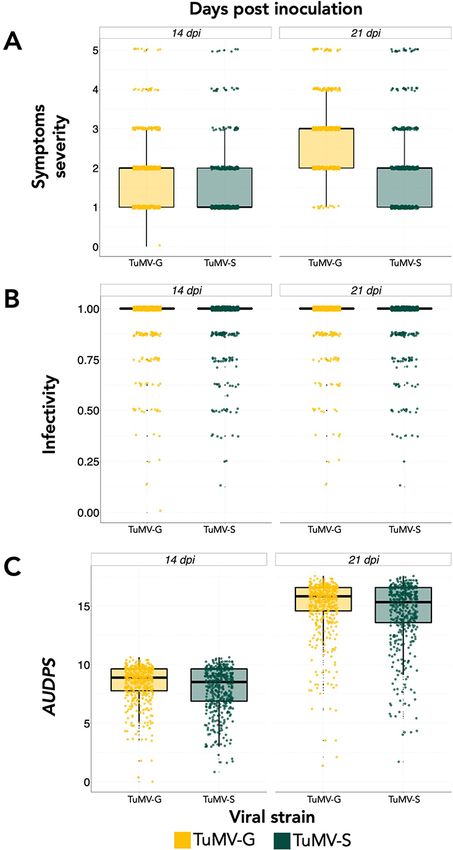
A. Butković et al.    3

or in the presence of recessive susceptibility genes, resulting in       mutations (HC-Pro/C1760U and P3/U3269C) and two nonsynony-
two particular strains that largely differed in their experimental       mous ones (VPg/R118H and CP/S70N). Therefore, TuMV-S and -G
degree of specialization (see Section 2.2 below for details on the       lie at two different locations in the specialist—generalist contin-
evolutionary history of these two strains).                              uum. While TuMV-S behaves more like a specialist, showing high
    In summary, the response to infection of 450 A. thaliana natu-       fitness only in its local host genotype, TuMV-G would better be
ral accessions from different geographic regions was phenotyped          described as a generalist that infects and induces similar disease
in a controlled common garden setting. These accessions were             severity across multiple host genotypes.
inoculated with two TuMV strains that differ in their degree of              TuMV-G and -S infected plant tissues were frozen in liquid
specialization. Infection data were analyzed using GWAS, specifi-        N2 and homogenized and mixed with 10 volumes of inoculation
cally looking for SNPs differentially associated with infection with     buffer (50 mM KH2 PO4 pH 7.0, 3 per cent polyethylene glycol 6,000,
each strain. The genetic architecture of the phenotyped disease-         10 per cent carborundum) right before the mechanical inocula-
related traits was also studied using the Bayesian sparse linear         tions. The two TuMV strains were mechanically inoculated into
mixed model (BSLMM).                                                     healthy A. thaliana plants that were between 21 and 25 days old.
                                                                         The inoculation started from the plants that were the largest

                                                                                                                                                     Downloaded from https://academic.oup.com/ve/article/7/2/veab063/6311756 by guest on 09 December 2021
                                                                         (8–12 leaves) giving the smaller plants extra time to grow, so all
2. Materials and methods                                                 the accessions got inoculated at a similar size (Boyes’ 3.2–3.5).
2.1 Plant material and growth conditions                                 Three middle sized leaves were mechanically inoculated with 5 µl
                                                                         of infectious sap prepared in inoculation buffer. To further mini-
Four hundred and fifty A. thaliana accessions (Supplementary
                                                                         mize differences due to inoculation efficiency all the inoculations
File S1) from the 1,001 Arabidopsis genome collection (https://
                                                                         were done by the same researcher. Hence, we assume that the
1001genomes.org last accessed 29 June 2021; 1001 Genomes
                                                                         inoculation failure rate would be the same among all accessions.
Consortium 2016) were phenotyped. The accessions were repre-
                                                                             Eight plants per accession for each TuMV strain were inocu-
sentative of the global species distribution. To ensure all the acces-
                                                                         lated, resulting in a total of 16 plants phenotyped and two mock-
sions were at a similar growth stage and to reduce the noise that
                                                                         inoculated control plants per accession. Accessions were split into
large differences in vegetative development could cause, we con-
                                                                         two blocks because of chamber space and workforce capacity.
firmed that all selected accessions reached growth stage 3.2–3.5 in
                                                                         The inoculation procedure took about 3–4 days per block, where
Boyes et al. (2001) scale ∼21 days after germination in our experi-
                                                                         on consecutive days different accessions underwent the inocula-
mental growth conditions [16 h day/8 h night with temperature of
                                                                         tion procedure because (1) it was not possible to inoculate all the
24◦ C day/20◦ C night, 45 per cent relative humidity and 125 µmol
                                                                         plants on the same day due to the sheer number of them and (2)
m−2 s−1 of light intensity (1:3 mixture of 450 nm blue and 670 nm
                                                                         this way all the plants got synchronized in size at the moment of
purple light-emitting diode)].
                                                                         inoculation. The first block was inoculated from 6 May 2019 to 8
                                                                         May 2019 and the second block was inoculated from 11 September
2.2 Virus inoculum and inoculation procedure                             2019 to 14 September 2019. Three hundred and one hundred and
The two strains of TuMV used in this study were obtained after           fifty accessions were inoculated in each block. Pot trays contained
12 passages of experimental evolution in mutant genotypes of the         four accessions inoculated with each viral strain along with their
A. thaliana accession Col-0, as detailed in Navarro et al. (2020).       corresponding mock-inoculated controls. To reduce spatial corre-
Among all the resulting viral lineages, lineage L4 evolved in the        lations due the relative position of plants in the growth chamber,
enhanced disease susceptibility 8 (eds8-1) mutant, hereafter referred    pots trays were translocated to a new random position everyday.
as TuMV-G, and lineage L4 evolved in the jasmonate insensitive 1             Col-0 loss-of-function (LOF) mutant genotypes that were used
(jin1) mutant, referred as TuMV-S, showed strikingly different host      to confirm GWAS results (Supplementary File S2) were seeded
ranges. The eds8-1 plants lacked the EDS8 protein, causing the           on 3 June 2020 and inoculated, as described above, with the
reduction of the expression of plant defensin genes and reduced          two TuMV strains on 23 June 2020. All LOF mutants and wild-
induced systemic resistance but enhanced systemic acquired               type (WT) control plants were analyzed in one block in the same
resistance (SAR). The jin1 plants lacked the JIN1 protein, causing       growth chamber with 10 plants per virus and per genotype and
the loss of jasmonic acid (JA) signaling that is a negative regulator    two mock-inoculated controls per combination.
of salicylic acid (SA)-dependent signaling. This results in a con-
stitutive expression of SAR. The eds8-1 plants turned out to be          2.3 Phenotyping
the most resistant ones to TuMV infection, while the jin1 plants         Three phenotypic traits were measured (Supplementary File S3):
were the most susceptible ones. TuMV-G was able to infect all            (1) symptoms severity: on a scale from 0 to 5 (Fig. 1) measured
plant genotypes tested by Navarro et al. (2020) with equal fitness,      at intermediate (14 days post-inoculation—dpi) and late (21 dpi)
while TuMV-S infected only jin1 well. Indeed, Navarro et al. (2020)      infection times so as to explore time-dependent differences in
calculated Blüthgen’s d’ specialization indexes (Blüthgen, Menzel,
and Blüthgen 2006) for these two strains, finding that TuMV-G
had d’ = 0 (no specialization) while TuMV-S had d’ = 1 (complete
specialization). In agreement with previous potyvirus-A. thaliana
studies (Hillung et al. 2014; González, Butković, and Elena 2019),
more permissive hosts (herein jin1) were selected for specialist
viruses while more restrictive hosts (in this case, eds8-1) were
selected for generalist viruses. At the genomic level, TuMV-G and
-S differed in a total of seven point mutations (Navarro et al. 2020).   Figure 1. Symptoms scale that was used to evaluate the severity of
                                                                         symptoms in the plants during the 21 days period post inoculation. 0: no
Relative to the ancestral naïve TuMV strain, TuMV-G contains             symptoms or healthy plant, 1: mild symptoms without chlorosis, 2:
three nonsynonymous mutations, all affecting the VPg protein             chlorosis is visible, 3: advanced chlorosis, 4: strong chlorotic symptoms
(H33Y, D113N, and K121E). Likewise, TuVM-S has two synonymous            and beginning of necrosis, and 5: clear necrosis and death of the plant.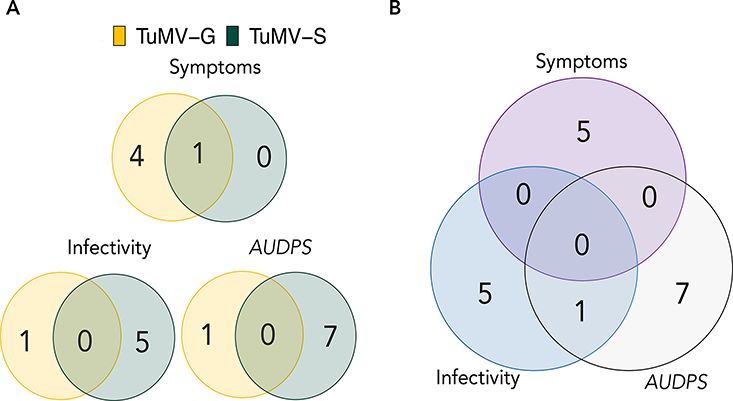
4     Virus Evolution

gene expression. Therefore, the status of plant infection was             21 dpi FDR = 2.73 × 10⁻¹⁰ , infectivity 14 dpi FDR = 6.32 × 10⁻¹³ and
assessed by visual inspection for symptoms. Out of 450 accessions         21 dpi FDR = 1.78 × 10⁻⁸ , and symptoms 14 dpi FDR = 9.59 × 10⁻¹⁰ .
only two had less than 50 per cent of symptomatic plants, making          While for TuMV-S it was calculated only for symptoms at 14 dpi
the symptom development a good indication of virus infection.             FDR = 1.49 × 10⁻¹² and 21 dpi FDR = 1.15 × 10⁻⁹ . Manhattan and
All the infected plants showed clear symptomatology associated            quantile–quantile (QQ) plots were drawn using rMVP R package
with TuMV infection. The intensity of symptoms was also visu-             (Yin et al. 2020).
ally quantified, as the degree of damage TuMV causes correlates              Each significant SNP was tested for linkage disequilibrium (LD)
with its detrimental effects on the host. TuMV is a sterilizing agent,    within a 10 kb window by calculating r2 with the help of PLINK 1.9
which directly impacts host reproduction (Vijayan et al. 2017). For       (www.cog-genomics.org/plink/1.9/). Furthermore, the r2 results
a plant, the intensity of symptoms is an evolutionarily relevant          were examined for indications of any SNPs in strong LD with other
trait, since the degree of damage on the vegetative organs and            significant SNP outside of the region of the significant gene. A
fruit development directly impacts its fitness (Pagan et al. 2007;        10 kb window was taken because in A. thaliana LD decays rapidly
Vijayan et al. 2017). (2) Infectivity: number of infected plants out      within 10 kb (Kim et al. 2007; Gan et al. 2011).
of the total number of inoculated plants after 21 dpi. (3) Disease

                                                                                                                                                    Downloaded from https://academic.oup.com/ve/article/7/2/veab063/6311756 by guest on 09 December 2021
progress, calculated as the area under the disease progress stairs        2.5 Bayesian sparse LMM
(AUDPS) (Simko and Piepho 2012). This measures the number of              To determine whether many variants with small effects or a
infected plants from the total number of inoculated plants each           small number of large effects (sparse) variants were contribut-
day during 21 days and combines it into a single value.                   ing to the disease-related traits variability, the BSLMM method
   In the characterization of LOF mutant response to infection,           implemented in GEMMA was used to infer the genetic architec-
AUDPS and symptoms intensity progression step (AUSIPS) curve              ture of the measured phenotypic traits (Zhou and Stephens 2012;
(Kone et al. 2017) were measured. AUSIPS is calculated similarly to       Zhou, Carbonetto, and Stephens 2013). BSLMM models the genetic
AUDPS and it summarizes the progression of the symptomatology             contribution as the sum of a sparse component and a highly poly-
through time. Every day during 21 days the severity of symptoms           genic component. The proportion of genetic variance explained
(scale shown in Fig. 1) was measured for all plants from each LOF         by sparse effects is represented by the parameter PGE ∈ [0, 1].
mutant.                                                                   The second parameter in the model is the total variance explained
                                                                          (PVE ∈ [0, 1]) by additive genetic variants. PVE is a flexible Bayesian
2.4 Genome-wide association mapping                                       equivalent of the narrow sense heritability (h2 ) estimated by more
Association analyses were done with a Python program based                classical linear mixed models (LMMs). Raw values were used for
on LIMIX (Lippert et al. 2014) written by Prof. Magnus Nord-              symptoms severity (discrete variable), while AUDPS and infectivity
borg’s group. LIMIX is a linear mixed model (LMM) that was used           (continuous variable) were normalized by block using a univariate
for single-trait analysis where SNPs and covariates were treated          general linear model in SPSS. The block effect on the phenotypes
as fixed effects while the population structure and noise were            was not incorporated as a covariate in GEMMA, as it was done
treated as random effects. The kinship matrix (identical-by-state,        in LIMIX, because the optimization algorithm in GEMMA causes
IBS matrix) and the genotype data come from the 1,001 Genome              errors if some covariates are identical for some genotypes. In
project in A. thaliana (1001 Genomes Consortium 2016), consisting         all cases, Markov chain Monte Carlo (MCMC) were run with the
of the SNPs for the 1,135 genome accessions plus imputed SNPs             default settings (burn-in at 100,000, sampling steps at 1,000,000,
of a set of accessions that were genotyped with a 250k SNP chip.          and recording every 10 steps) and minor allele frequency cut-off
Kinship measures the degree of genetic relatedness between indi-          set at 5 per cent.
viduals and is used to remove confounding factors that decrease               The posterior inclusion probability (PIP) for an SNP is the prob-
power and increase the false positive rate in GWAS.                       ability of including this SNP as causal in the MCMC analysis,
    Data were explored with SPSS version 25 (IBM Corp., Armonk            estimated from posterior samples of a gamma distribution that
NY, USA) and deviations between the phenotypic values were                reflects the sparse effects (Schaid, Chen, and Larson 2018). PIP can
observed between the two blocks, therefore the block effect was           be used as a measure of the strength of the association that an
accounted for in the GWAS analysis through the covariates option          SNP has with the corresponding phenotype. Variants with a large
in LIMIX. Untransformed phenotypic data was used in the GWAS,             effect in at least 25 per cent of the MCMC samples were diagnosed
since transformed phenotypic data did not show much improve-              as significant (PIP ≥ 0.25).
ment compared with the untransformed data. The untransformed
AUDPS and infectivity distributions were characterized by sig-            2.6 Validation of GWAS associations
nificantly negative skewness (in all cases, g3 ≤ −1.378 ±0.082,           Ten genes identified with the GWAS were selected for further
P < 0.001) and leptokurtosis (i.e. fatter tails than the Normal; in all   study of their LOF effect on disease progress (Supplementary
cases, g4 ≥ 1.907 ±0.163, P < 0.001). In the case of symptoms sever-      File S2). The 10 chosen Col-0 T-DNA insertion LOF mutants were
ity, the distributions were significantly skewed toward positive          selected on the criteria that (1) a candidate gene per each of the
values (in all cases, g3 ≥ 0.631 ±0.082, P < 0.001) but significantly     phenotypic traits per virus was included and (2) they were avail-
leptokurtic only at 14 dpi (g4 = 2.253 ±0.163, P < 0.0001). In all        able as homozygous lines in Nottingham Arabidopsis stock center
cases, a one-sample Kolmogorov-Smirnov test rejected the null             (NASC) (https://arabidopsis.info/BrowsePage last accessed 29 June
hypothesis of Normal distribution (in all cases D ≥ 0.112, P < 0.001).    2021). AUDPS and the AUSIPS were calculated using the number
    Out of ∼10 million SNPs (Seren 2018), 1,815,154 had a minor           of infected plants, and their symptomatology was measured dur-
allele frequency higher than 0.05 for all phenotypes. To minimize         ing 21 dpi for each individual plant. For statistical comparisons, a
false positives due to multiple testing (type I errors), we used          bootstrap approach was taken. One thousand pseudo-replicated
the false discovery rate (FDR) or the −logP ≥ 5 threshold, what-          matrices, of equal dimensions to the original one (rows repre-
ever value was more conservative. FDR was calculated using the            senting individual plants and columns representing dpi), were
fdrBH function (with q = 0.001) of the mSTEM R package version            generated per experimental condition. The matrix rows were
1.0. The exact FDR values used were as follows: for TuMV-G AUDPS          replaced, and thus, the temporal correlations across time points
A. Butković et al. 5
Table 1. Non-parametric two-ways analysis of variance (Scheirer–Ray–Hare) test of the two main effects and their interaction for each
of the three disease-related traits experimentally determined.
Symptoms severity (S) AUDPS Infectivity (i)
a
Source of variation df H P H P H P
Virus genotype 1 191.4146 Virus Evolution
(0.03, 0.14)], while the largest value was obtained also for AUDPS thresholds determined for each of the traits (Supplementary File
measured at 14 dpi but for TuMV-S [median 0.28 and 89 per cent S5), a total of eight significant SNPs were identified for TuMV-G and
HDI (0.19, 0.38)]. In all other instances, PVE values were similar for 19 for TuMV-S infection (Supplementary File S5). Some of these
both strains and between the two time points. SNPs were positioned within seven genes for TuMV-G and 12 for
Regarding PGE (Supplementary File S4), on one hand, the small- TuMV-S (Table 2 and Supplementary File S5). Most of the identified
est value was observed for the severity of symptoms induced by genes were unique to plants infected by TuMV-G or TuMV-S, with
TuMV-G at 14 dpi [median 0.33 and 89 per cent HDI (0, 0.82)] and only one locus shared both at 14 and 21 dpi, for symptoms sever-
21 dpi [median 0.33 and 89 per cent HDI (0, 0.81)] and by TuMV-S ity: AT2G14080, a TIR-NBS-LRR class family disease resistance
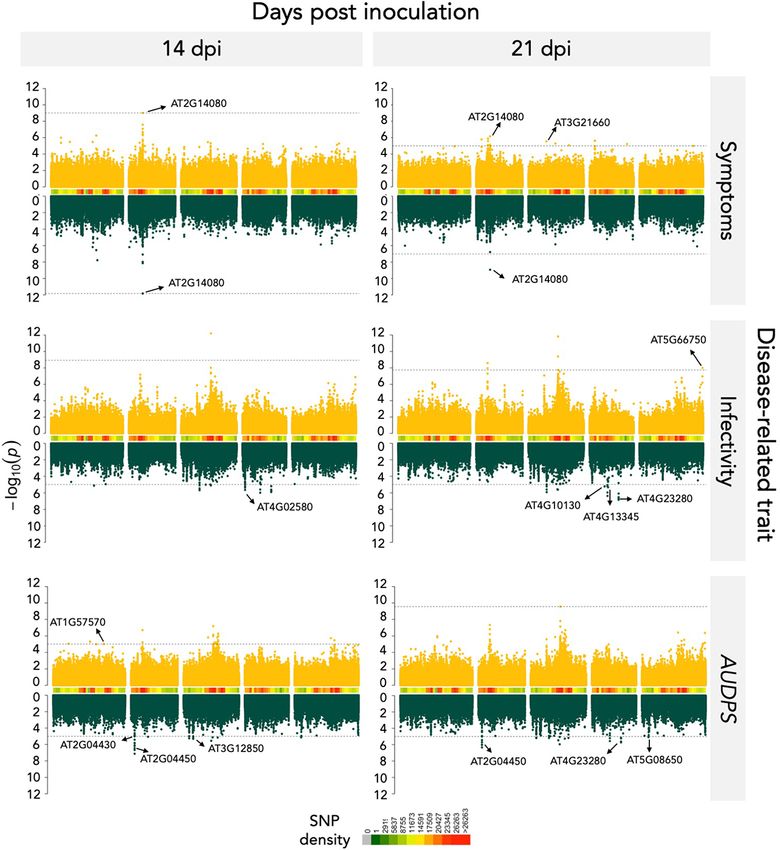
at 21 dpi [median 0.33 and 89 per cent HDI (0, 0.81)]. On the other protein (Fig. 4A).
hand, the largest PGE value was estimated for TuMV-G infectiv- Comparing the results at 14 and 21 dpi for TuMV-G, genes at
ity measured at 21 dpi [median 0.92 and 89 per cent HDI (0.71, 1)]. 14 dpi seem more related to a general disease response whilst
The percentage of PVE explained by large sparse effect variants genes at 21 dpi are more specific and involved in ubiquitin-related
(PGE) indicates that major effect loci account for between 50 and processes. Such temporal difference is not seen for TuMV-S. This
90 per cent of PVE in AUDPS and infectivity traits, in both time may suggest that plants responses to the less specialized strain
Downloaded from https://academic.oup.com/ve/article/7/2/veab063/6311756 by guest on 09 December 2021
points for both viruses (median values reported in Supplemen- change more dynamically than when infected with the more
tary File S4). The number of variants with large effect size, the specialized one, in which case the response seems unchanged
SNPs that explain most of the phenotype among the 431,323 SNPs, between the two time points studied. Fig. 4B shows that most
was low for infectivity and symptoms severity at 14 dpi for both of the identified genes (17) had an effect only in one of the
viruses as well as for AUDPS and infectivity at 21 dpi also for both disease-related traits. However, locus AT4G23280 that encodes
viruses (Supplementary File S4). To detect large-effect SNPs that for the putative cysteine-rich receptor-like protein kinase 20 (CRK20)
might be contributing the most to the variance in disease-related was involved both in AUDPS and infectivity. Interestingly, locus
phenotypes, a PIP ≥ 0.25 threshold was imposed in the BSLMM AT4G04540 mapped for symptoms severity also encodes for a
model in GEMMA. With this constrain, three highly significant putative rich receptor-like protein kinase 39 (CRK39).
SNPs have been detected. The first was detected for TuMV-S AUDPS
estimated at 21 dpi. This SNP was mapped within the gene encod- 3.4 Experimental validation of identified genes
ing for AT2G04440, a MutT/Nudix family protein (Supplementary Ten of the identified genes were selected for a validation study
Fig. S1). The second significant SNP was found for TuMV-G infec- in which the corresponding LOF mutants were inoculated with
tivity at 21 dpi within locus AT3G19350 that corresponds to the both viral strains and the disease progress was characterized
gene MATERNALLY EXPRESSED PAB C-TERMINAL (MPC). The third (Fig. 5 and Supplementary File S6). Out of the 10 genes, one was
significant SNP was also observed for TuMV-G infectivity at 21 dpi shared between the two viral strains, two were unique for plants
and corresponds to position 6,685,977 of an intergenic region on infected by TuMV-G and seven were unique for plants infected by
chromosome 3 (Supplementary Fig. S1). Chromosome 3 inter- TuMV-S. More genes were validated for TuMV-S because the GWAS
genic position 6,685,977 is between loci AT3G19290, which corre- mapped more significant SNPs upon infection with this strain.
sponds to the gene ABA-responsive element binding protein 4 (ABF4), The selected LOF mutants were jal14, nudx5, nudx6, at2g14080,
and AT3G19280, which corresponds to the gene fucosyltransferase at3g12850, t9a4.1, mee55, cplepa, ddm1, and at4g02580. To evaluate
11 (FUT11). Interestingly, the chromosome 3 intergenic position differences in infection dynamics between the mutants and the
6,685,977 shows a strong LD (r2 = 1; in a 10 kb window) with WT plants, AUDPS and AUSIPS were calculated using the data col-
FUT11. lected along the 21 dpi. A comparation between the WT and LOF
Next, we ran an LD analysis to discover SNPs at different loci mutant values for each viral strain was done (Fig. 5, Supplemen-
that might be significantly associated. A total of four pairs of SNPs tary File S6) based on the inferred 89 per cent HDIs. Differences in
located at different loci showed significant LD values (r2 > 0.5 in all most of the LOFs were found when comparing the AUDPS values
cases; Supplementary File S5). The rest of SNPs showed strong LD of the two viral strains with the WT (Supplementary File S6).
only with other SNPs within the same locus. All four significant Evaluating the mutant AUDPS intervals, lower 89 per cent HDIs
pairs involved protein coding genes. Three of the four pairs of SNPs compared to the WT imply that these mutants have slower dis-
in LD were mapped for TuMV-S. ease progress because the LOF gene is positively involved in the
In summary, for this host-pathogen system, the genetic archi- viral cycle and the virus uses it to aid its replication, translation,
tecture of AUDPS and infectivity phenotypes is relatively sim- assembly, or movement. For the TuMV-S and TuMV-G infection,
ple, involving few small-effect SNPs along with one large effect there are four mutants that have lower 89 per cent HDI compared
SNP that is being responsible for the majority of variance in the to the WT: at4g02580, cplepa, nudx5, and nudx6.
observed phenotypes. Symptoms severity, however, is geneti- Observing LOF mutants with AUDPS intervals higher than the
cally more complex and involves many more small effect SNPs. WT suggests that the corresponding genes are involved in plant
For both viral strains, all the disease phenotypes have a simi- defense response against infection, removing them enhanced dis-
lar genetic architecture between the two temporal stages (14 and ease progress beyond the one observed for the WT plants. In
21 dpi). TuMV-G infection, ddm1 had 89 per cent HDI higher than the WT.
In plants infected with TuMV-S only t9a4.1 had higher 89 per cent
3.3 GWAS identifies genetic loci associated with HDI compared to the WT.
disease-related phenotypes differentially induced For AUSIPS, if mutant values had higher intervals than the WT
by virus strains that differ on their past it meant that the virus causes stronger symptoms in the absence
evolutionary history and degree of specialization of these host genes. This is the case for at2g14080 and nudx6 plants
The significantly associated SNPs for the three disease-related infected with TuMV-G. In the case of TuMV-S this happened in
traits were visualized using Manhattan plots in (Fig. 3). The QQ- at3g12850 and, as for TuMV-G, in at2g14080 plants. An interest-
plots for infection traits showed no detectable population struc- ing observation was made for nudx6 mutant for AUDPS, where it
ture (Supplementary Fig. S2). Using the FDR or the −logP ≥ 5 showed an opposite effect in comparation with AUSIPS.A. Butković et al. 7
Downloaded from https://academic.oup.com/ve/article/7/2/veab063/6311756 by guest on 09 December 2021
Figure 3. Manhattan plots of the analyzed disease-related traits. Data for TuMV-G are indicated in yellow and for TuMV-S in green. Peaks marked on
the plots correspond to the most significant SNP values of the genes selected for the mutant analysis. SNP density shows how many SNPs are
genotyped for a particular chromosomal region. The dashed lines indicate the significance threshold (FDR or −logP = 5 whenever computing FDR was
not possible).
Therefore, significant differences in AUDPS confidence inter- symptoms severity progression were also significant between the
vals between WT and mutant plants confirm the role in infection two viral strains in the WT, at2g14080, at4g02580, cplepa, ddm1,
of the genes that were knocked-out. When the mutant had lower jal14, mee55, nudx5, and nudx6. This difference indicates that the
AUDPS values (e.g. at4g02580, cplepa, nudx5, and nudx6 for both two viral strains cause different symptomatology in the WT and
viral strains), it confirmed the positive function of the gene in the the majority of the mutants.
viral replication. In contrast, mutants with values higher than
those of the WT (e.g. ddm1 mutants for TuMV-G and t9a4.1 for
TuMV-S) confirmed the role of the gene in the host defense. Com- 4. Discussion
parations of AUSIPS values between WT and mutant plants also Pathogens will have different virulence and induce different
confirm the role of most of the studied genes in symptoms sever- responses in their hosts depending on their adaptation history. For
ity. The at4g02580 plants had lower AUSIPS interval in the TuMV-G example, in the whole-genome transcriptomic study by Hillung
infection. Therefore, plants defective in an NADH-ubiquinone et al. (2016), they compared the transcriptomic responses of six
oxidoreductase susceptibility factor had a milder symptoma- A. thaliana accessions infected with generalist or specialist strains
tology than WT ones. Mutants at4g02580 and nudx5 also had of Tobacco etch potyvirus. They showed that the generalist virus
lower AUSIPS intervals when infected with TuMV-S. Differences in manipulated a similar set of host genes across the experimental8 Virus Evolution
Table 2. Significant genes detected using GWAS for the three disease-related traits during the course of infection with each viral strain.
Trait dpi Gene Description −log P
TuMV-G
Symptoms severity 14 and 21 AT2G14080 Disease resistance protein (TIR-NBS-LRR class) 9.02
family
Symptoms severity 21 AT3G21660 PUX6 Plant UBX domain-containing protein 6 5.54
Symptoms severity 21 AT3G46590 TRP2 Telomere repeat-binding protein 2 5.09
Symptoms severity 21 AT4G04540 CRK39 Putative cysteine-rich receptor-like protein kinase 5.65
39
Symptoms severity 21 AT4G32660 AME3 Serine/threonine-protein kinase AME3 5.22
AUDPS 14 AT1G57570 JAL14 Jacalin-related lectin 14 5.01
Infectivity 21 AT5G66750 DDM1 ATP-dependent DNA helicase DDM1 8.00
TuMV-S
Downloaded from https://academic.oup.com/ve/article/7/2/veab063/6311756 by guest on 09 December 2021
Symptoms severity 14 and 21 AT2G14080 Disease resistance protein (TIR-NBS-LRR class) 11.83
family
AUDPS 21 AT4G23280 CRK20 Putative cysteine-rich receptor-like protein kinase 5.73
20
AUDPS 14 and 21 AT2G04450 NUDX6 Nudix hydrolase 6 6.45
AUDPS 14 and 21 AT2G04440 MutT/nudix family protein 6.11
AUDPS 21 AT3G07470 Transmembrane protein 5.20
AUDPS 14 AT3G12850 COP9 signalosome complex-related/CSN 5.18
complex-like protein
AUDPS 14/21 AT5G08650 CPLEPA Translation factor GUF1 homolog, promotes 5.14
efficient protein synthesis in chloroplasts
AUDPS 14 AT2G04430 NUDX5 Nudix hydrolase 5 5.02
infectivity 14 and 21 AT4G23280 CRK20 Putative cysteine-rich receptor-like protein kinase 6.52
20
infectivity 14 and 21 AT3G21980 CRRSP27 Cystein-rich repeat secretory protein 27
infectivity 14 AT4G02580 NADH dehydrogenase [ubiquinone] flavoprotein 2 5.64
infectivity 21 AT4G13345 MEE55 Serine-domain containing serine and sphingolipid 5.32
biosynthesis protein
infectivity 21 AT4G10130 T9A4.1 DNAJ heat shock N-terminal domain-containing 5.22
protein
If we focus on the different evolutionary strategies of the two
strains, we can say that selection has driven the less special-
ized (this is to say, the more generalist one) virus to manipulate
a similar set of host genes across the host range for successful
infection. In contrast, host-specific selective pressures modu-
lated the evolution of the more specialized strain; hence, more
genes associated with TuMV-S have been found by the GWAS
analysis.
Mapped genes in the GWAS belonged to categories such as
F-box proteins, kinase, hydrolase, LRR family proteins, disease
resistance proteins, transcription factors, lectins, helicases, ubiq-
uitin proteases, proteins involved in iron metabolism, pentatri-
copeptide repeat-containing, GTPases, and berberines, all of them
Figure 4. Venn diagram showing the number of unique and shared being involved in the plant response to infection, the viral cycle
genes. (A) Genes mapped for each viral strain and disease-related traits. or RNA metabolism (Ge and Xia 2008; Lee 2008; Corrêa et al.
(B) Genes mapped for all disease-related traits pooling together both
2013; Manna 2015; Li et al. 2016; Guo et al. 2020; Herlihy, Long,
viral isolates.
and McDowell 2020; Huang et al. 2020). Locus AT2G14080 was
identified as significant for both viral strains in the analysis of
host range, while the specialist virus showed a more heteroge- symptoms severity. AT2G14080 belongs to NBS-LRR genes that
neous response. In our GWAS study, similar conclusions can be are the most numerous class of the R (resistance) genes in A.
reached by comparing host genes associated with infection by thaliana. Their effector recognition LRR domains recognize spe-
the two TuMV strains differing in their degree of specialization. cific pathogens and can lead to a hypersensitive immune response
In the case of the less specialized strain, TuMV-G, fewer host (HR) or to an extreme resistance against the virus infection. An
candidate genes were identified compared to the more specialist HR restricts the pathogen at the primary infection site caus-
strain, TuMV-S. This difference might have emerged as a conse- ing cell death followed by SAR that increases SA accumulation
quence of the different evolutionary strategies of the two viruses and expression of pathogenesis-related genes (Meyers et al. 2003;
or as a consequence of the limitations of the GWAS analysis, Marone et al. 2013). There were also some strain-specific hits
such as inability to identify all genetic determinants of com- that were previously characterized as involved in plant defense
plex traits that is a common problem in all similar methods. or in some important part of the viral cycle. Indeed, host genesA. Butković et al. 9
Downloaded from https://academic.oup.com/ve/article/7/2/veab063/6311756 by guest on 09 December 2021
Figure 5. 89 per cent HDI calculated for AUDPS and AUSIPS for each viral strain on each LOF mutant plant genotype. Not overlapping 89 per cent HDI
between a given mutant and the WT plants is indicated by an arrow. Arrows pointing up indicate a significant positive difference in medians, while
arrows pointing down indicate the opposite trend. Brackets and asterisks indicate significant differences between TuMV-G and TuMV-S disease
progress or severity in the LOF mutant plant genotype being considered.10 Virus Evolution
that differ between the two strains could be targets of differential is reduced, plants are more susceptible (Raja et al. 2008). Dif-
selection during their experimental evolution. For example, ubiq- ferences in adaptation history of TuMV-G and the strains studied
uitin protease and telomere repeat-binding protein 2 were specific by Corrêa et al. (2020) might explain why TuMV-G replicates bet-
responses of the plant to TuMV-G infection. While the Nudix ter in this mutant in our study. For TuMV-G, the lack of DDM1
hydrolase, NADH dehydrogenase and DNAJ heat shock proteins might help the virus replicate better since defense genes are
were specific for plants infected with TuMV-S strain. not properly methylated and henceforth their expression deregu-
Loci AT4G04540 and AT4G23280 both encode for cysteine-rich lated. Another significant gene in the mutant analysis was T9A4.1,
receptor-like protein kinases (CRK39 and CRK20, respectively). which is involved in peptidyl-diphthamide biosynthetic processes
CRKs are the only genes mapped in common for all three disease- and tRNA wobble uridine modification. Both of these processes are
related phenotypic traits. CRK genes are induced upon pathogen involved in translation modifications and this protein might have
infection in A. thaliana via the SA signaling pathway, result- a role in an anti-pathogenic response.
ing in HR (Chen et al. 2004). In general, receptor-like protein For the strain TuMV-S in the AUSIPS values, one host gene had
kinases (RLKs), a large family with more than 600 members, are a significant effect on the mutant analysis, AT3G12850, which
central players in the plant receptor kinase-mediated signaling is involved in regulation of JA levels. Viruses infecting at3g12850
Downloaded from https://academic.oup.com/ve/article/7/2/veab063/6311756 by guest on 09 December 2021
involved in hormonal responses pathways, cell differentiation, plants replicate better. AT3G12850-encoded protein is a COP9 sig-
plant growth and development, self-incompatibility, and symbi- nalosome complex-related/CSN complex-like protein. The tomato
otic and pathogen recognition (Liang and Zhou 2018). Given their yellow leaf curl Sardinia virus (TYLCSV) C2 protein interacts with
upstream role in the MAPK signaling cascades, it is not surprising CSN5 resulting in a reduction of JA levels. As previously shown,
that RLK expression has many pleiotropic effects on diverse plant treating A. thaliana plants with exogenous JA disrupts TYLCSV
phenotypes. infection (Lozano-Durán et al. 2011). It is known that plant viruses
There was one gene that came up in the GWAS of both strains, and herbivores have strategies to manipulate JA levels as this
AT2G14080 that had a significant effect on the mutant involved hormone confers defenses to the plant against biotic and abiotic
with the two strains and it appears to be involved in plant defense. stresses (Wu and Ye 2020). This means that in our pathosystem
Two of the 10 genes selected for the mutant analysis came from the JA is negatively affecting the viral replication.
TuMV-G analysis and seven came from the TuMV-S analysis. Eight A GWAS of TuMV infection in A. thaliana in a natural set-
of the selected host genes had a significant effect on the virus ting was recently performed by Rubio et al. (2019). None of the
disease progress and/or symptoms maternal effect embryo arrest genes found by these authors were pinpointed in our study but
55 (MEE55, encodes for a serine and sphingolipid biosynthesis this could simply reflect three major experimental differences: (1)
protein) and AT1G57570 (JAL14, encodes for a member of the Rubio et al. (2019) grew their plants in a natural setting where
mannose-binding lectin superfamily protein) apparently had no they were exposed to a changing environment. The highly com-
significant effect on either viral strain under our experimental plex natural setting can lead to much more heterogeneous gene
conditions. There were five host genes that had an effect in regulations, as opposed to a controlled environment that min-
both viral strains: AT2G14080, AT4G02580, CPLEPA, NUDX5, and imizes external abiotic and biotic stressors. It has been shown
NUDX6. AT2G14080 is an NBS-LRR resistance gene. These pro- before that abiotic stresses influence the response of the plant
teins monitor the status of plant proteins targeted by pathogens to viruses (Xu et al. 2008; Hily et al. 2016; González et al. 2021).
and activate a series of defense responses (McHale et al. 2006). Multiple stresses affecting the plant at the same time can be prob-
By removing this host gene, viruses managed to induce stronger lematic when trying to identify genes responsible for the specific
symptoms AT4G02580 is a susceptibility factor and could aid viral response of plants to virus infection. (2) The evolutionary histories
pathogenesis (Kant et al. 2019). CpLEPA is a highly conserved of the TuMV strains used in both studies were largely different.
chloroplastic translation factor that could assist viral transcrip- While Rubio et al. (2019) used the UK1 isolate, we used strains
tion in the cytoplasm by enhancing the translation of chrolopastic derived from the YC5 isolate originally obtained from calla lily
proteins involved in photosynthesis to compensate for the nega- plants (Chen et al. 2003). (3) In our study, the 450 accessions
tive side-effects of infection in chloroplasts activity (Ji et al. 2012; were chosen to represent the world-wide genetic diversity of the
Li et al. 2013; Sanfaçon 2015). Mutants nudx5 and nudx6 are defi- species, while French accessions were largely overrepresented in
cient in proteins that form part of the Nudix hydrolase family, Rubio et al. (2019) study. Rubio et al. (2019) identified six new genes
which act as positive regulators in plant immunity (Ge and Xia above a threshold of −logP ≥ 4 in their GWAS analysis:restriction to
2008; Yoshimura and Shigeoka 2015), thus leading to a stronger tobacco etch virus movement 3, a DEAD box RNA helicase 1 candidate
anti-pathogen response. In both viral strains, they seem to have gene, eukaryotic translation initiation factor 3b, a protein with a pleck-
important roles for disease progress by enhancing viral replication strin homology domain, a protein containing a TIM barrel domain,
or gene expression since viruses replicated worse when these two and a key enzyme involved in the glutamate pathway. Our study
genes where knocked-out. Suggesting the possibility that these identified 13 genes specifically mapped for viral infection response
two Nudix hydrolases could have additional functions besides the (Table 2), of which eight were experimentally confirmed as hav-
one described in defense. This role for the two hydrolases in viral ing roles in the plant response to TuMV-S and TuMV-G (Fig. 5).
infection was not described before. Despite the lack of matching genes mapped between both studies,
Genes that had an effect on the LOF mutant analysis for AUDPS there are similarities at the functional level: for both studies there
for virus TuMV-G were DDM1 and T9A4.1. Corrêa et al. (2020) were genes mapped that belonged to ATP-dependent DNA heli-
showed that ddm1 plants were more resistant to two different case, DnaJ domain superfamily protein and ubiquitin associated
strains of TuMV. This might be because induction of SA-mediated proteins.
defense in ddm1 mutants may be an explanation of their resis- Looking at the analysis of the underlying genetic architec-
tance to TuMV. The opposite has been noticed for geminiviruses ture of each phenotyped trait, it was evident that some disease-
where ddm1 mutant showed hypersusceptibility to infection (Raja related phenotypes were explained by few SNPs (infectivity and
et al. 2008). The reason for this was the methylation of viral symptoms severity at 14 dpi for both viruses and AUDPS and
genomes that is a plant defense mechanism; when methylation infectivity at 21 dpi for both viruses as well), while some traitsA. Butković et al. 11
were highly polygenic and explained by a large number of SNPs Conflict of interest: None declared.
(AUDPS for TuMV-S at 14 dpi). SNPs that passed the PIP thresh-
old were mapped within locus AT2G04440 (MutT/Nudix family
protein) for AUDPS of TuMV-S at 21 dpi and position 6,685,977 References
in an intergenic region on chromosome 3, along with gene MPC 1001 Genomes Consortium. (2016) ‘1,135 Genomes Reveal the Global
for infectivity of TuMV-G at 21 dpi (Supplementary Fig. S1). All Pattern of Polymorphism in Arabidopsis Thaliana’, Cell, 166: 481–91.
had possible roles in the viral infection. AT2G04440 was previ- Bedhomme, S., Hillung, J., and Elena, S. F. (2015) ‘Emerging Viruses:
ously characterized as an important player in the plant immune Why They are Not Jacks of All Trades?’, Current Opinion in Virology,
response (Ge and Xia 2008). MPC is an important translation ini- 10: 1–6.
tiation factor that binds to the viral VPg and the RNA-dependent —— Lafforgue, G., and Elena, S. F. (2012) ‘Multihost Experimen-
RNA polymerase (RdRP) NIb of TuMV, affecting the viral RNA accu- tal Evolution of a Plant RNA Virus Reveals Local Adaptation
mulation (Dufresne et al. 2008). The noncoding intergenic region and Host-Specific Mutations’, Molecular Biology and Evolution, 29:
at position 6,685,977 on chromosome 3 could be a promoter region 1481–92.
involved in regulation of the expression of both ABF4 and FUT11. Bluöthgen, N., Menzel, F., and Bluöthgen, N. (2006) ‘Measuring
Downloaded from https://academic.oup.com/ve/article/7/2/veab063/6311756 by guest on 09 December 2021
ABF4 controls the ABA-dependent stress response. It was previ- Specialization in Species Interaction Networks’, BMC Ecology, 6:
ously shown that Wheat yellow mosaic potyvirus disturbs the ABA 1–12.
signaling pathway through the interaction between the viral RdRp Bono, L. M., Draghi, J. A., and Turner, P. E. (2020) ‘Evolvability Costs of
and the wheat’s light-induced protein TaLIP thus facilitating virus Niche Expansion’, Trends in Genetics, 36: 14–23.
infection (Zhang et al. 2019). There is no clear description of FUT11 Boyes, D. C. (2001) ‘Growth Stage-based Phenotypic Analysis of Ara-
in plant virus infection, but it is involved in protein N-linked gly- bidopsis: A Model for High Throughput Functional Genomics in
cosylation and the intergenic position 6,685,977 shows a strong LD Plants’, The Plant Cell, 13: 1449–510.
(r2 = 1; in a 10 kb window) with this gene. Bush, W. S., and Moore, J. H. (2012) ‘Genome-wide Association
Since the genome of A. thaliana is highly polygenic and is gov- Studies’, PLoS Computational Biology, 8: e1002822.
erned by small effect loci (as shown by the BSLMM analysis), Cantor, R. M., Lange, K., and Sinsheimer, J. S. (2010) ‘Prioritizing GWAS
our study might have missed some of the genes described in the Results: A Review of Statistical Methods and Recommendations
literature as being involved in the potyvirus infection. Other expla- for Their Application’, The American Journal of Human Genetics, 86:
nation for the absence of previously described genes would be that 6–22.
they were not important in the context of our virus strains that Cervera, H., Lalić, J., and Elena, S. F. (2016) ‘Efficient Escape from
were preadapted in specific mutants of A. thaliana. Local Optima in a Highly Rugged Fitness Landscape by Evolving
Altogether, this work (1) describes differences between two RNA Virus Populations’, Proceedings of the Royal Society B: Biological
strains whose past evolutionary history determined differences Sciences, 283: 20160984.
in their degree of specialization, (2) identifies and characterizes Chen, C. C. et al. (2003) ‘Identification of Turnip Mosaic Virus Isolates
genes involved in the infection with more or less specialized viral Causing Yellow Stripe and Spot on Calla Lily’, Plant Disease, 87:
strains, and (3) illustrates the variability of the genetic elements 901–5.
involved in a viral infection depending on the evolutionary history Chen, K. et al. (2004) ‘Activation of Hypersensitive Cell Death by
of the viral strain. Pathogen-induced Receptor-like Protein Kinases from Arabidop-
sis’, Plant Molecular Biology, 56: 271–83.
Cooper, L. A., and Scott, T. W. (2001) ‘Differential Evolution of Eastern
Data availability
Equine Encephalitis Virus Populations in Response to Host Cell
Supplementary data are available at GitHub https://github.com/ Type’, Genetics, 157: 1403–12.
sfelena/TuMV-specialist-generalist-GWAS, last accessed June 29th Corrêa, R. L. et al. (2013) ‘The Role of F-Box Proteins during Viral
2021. Infection’, International Journal of Molecular Sciences, 14: 4030–49.
—— et al. (2020) ‘Viral Fitness Determines the Magnitude of Tran-
Supplementary data scriptomic and Epigenomic Reprograming of Defense Responses
in Plants’, Molecular Biology and Evolution, 37: 1866–81.
Supplementary data is available at Virus Evolution online.
Cuevas, J. M., Moya, A., and Elena, S. F. (2003) ‘Evolution of RNA Virus
in Spatially Structured Heterogeneous Environments’, Journal of
Acknowledgements Evolutionary Biology, 16: 456–66.
We thank Paula Agudo and Francisca de la Iglesia for excellent Deardorff, E. R. et al. (2011) ‘West Nile Virus Experimental Evolu-
technical support and Prof. Magnus Nordborg’s group for providing tion in Vivo and the Trade-Off Hypothesis’, PLoS Pathogens, 7:
the seeds of A. thaliana accessions and the Python code for the e1002335.
GWAS. Dennehy, J. J. et al. (2013) ‘Frequent Coinfection Reduces RNA Virus
Population Genetic Diversity’, Journal of Heredity, 104: 704–12.
Duffy, S., Turner, P. E., and Burch, C. L. (2006) ‘Pleiotropic Costs
Funding of Niche Expansion in the RNA Bacteriophage Φ6’, Genetics, 172:
Work was funded by Spain’s Ministerio de Ciencia e Innovación- 751–7.
FEDER grant PID2019-103998GB-I00 and Generalitat Valenciana Dufresne, P. J. et al. (2008) ‘Arabidopsis Thaliana Class II Poly(A)-Binding
grants GRISOLIAP/2018/005 and PROMETEU2019/012 to SFE. RG Proteins are Required for Efficient Multiplication of Turnip Mosaic
was supported Ministerio de Ciencia e Innovación-FEDER contract Virus’, Journal of General Virology, 89: 2339–48.
BES-2016-077078. MPSR was supported by a Young Investiga- Elena, S. F., Agudelo-Romero, P., and Lalić, J. (2009) ‘The Evolution of
tors fellowship from the Universitat de València International 0.7 Viruses in Multi-Host Fitness Landscapes’, Open Virology Journal, 3:
Cooperation Program. 1–6.You can also read