Analysis of an Ebola virus disease survivor whose host and viral markers were predictive of death indicates the effectiveness of medical ...
←
→
Page content transcription
If your browser does not render page correctly, please read the page content below
Bosworth et al. Genome Medicine       (2021) 13:5
https://doi.org/10.1186/s13073-020-00811-9

 RESEARCH                                                                                                                                         Open Access

Analysis of an Ebola virus disease survivor
whose host and viral markers were
predictive of death indicates the
effectiveness of medical countermeasures
and supportive care
Andrew Bosworth1,2,3, Natasha Y. Rickett3,4, Xiaofeng Dong4, Lisa F. P. Ng3,4,5, Isabel García-Dorival4,
David A. Matthews6, Tom Fletcher3,7, Michael Jacobs8, Emma C. Thomson9*, Miles W. Carroll1,3,10* and
Julian A. Hiscox3,4,5*

  Abstract
  Background: Ebola virus disease (EVD) is an often-fatal infection where the effectiveness of medical countermeasures
  is uncertain. During the West African outbreak (2013–2016), several patients were treated with different types of anti-
  viral therapies including monoclonal antibody-based cocktails that had the potential to neutralise Ebola virus (EBOV).
  However, at the time, the efficacy of these therapies was uncertain. Given the scale of the outbreak, several clinical
  phenotypes came to the forefront including the ability of the same virus to cause recrudescence in the same patient—
  perhaps through persisting in immune privileged sites. Several key questions remained including establishing if
  monoclonal antibody therapy was effective in humans with severe EVD, whether virus escape mutants were selected
  during treatment, and what is the potential mechanism(s) of persistence. This was made possible through longitudinal
  samples taken from a UK patient with EVD.
  Methods: Several different sample types, plasma and cerebrospinal fluid, were collected and sequenced using
  Illumina-based RNAseq. Sequence reads were mapped both to EBOV and the human genome and differential gene
  expression analysis used to identify changes in the abundance of gene transcripts as infection progressed. Digital Cell
  Quantitation analysis was used to predict the immune phenotype in samples derived from blood.
  (Continued on next page)

* Correspondence: emma.thomson@glasgow.ac.uk; miles.carroll@phe.gov.uk;
julian.hiscox@liverpool.ac.uk
9
 MRC-University of Glasgow Centre for Virus Research, Glasgow, UK
1
 Public Health England, Manor Farm Road, Porton Down, Salisbury, UK
3
 Health Protection Research Unit in Emerging and Zoonotic Infections,
National Institute for Health Research, Liverpool, UK
Full list of author information is available at the end of the article

                                      © The Author(s). 2021 Open Access This article is licensed under a Creative Commons Attribution 4.0 International License,
                                      which permits use, sharing, adaptation, distribution and reproduction in any medium or format, as long as you give
                                      appropriate credit to the original author(s) and the source, provide a link to the Creative Commons licence, and indicate if
                                      changes were made. The images or other third party material in this article are included in the article's Creative Commons
                                      licence, unless indicated otherwise in a credit line to the material. If material is not included in the article's Creative Commons
                                      licence and your intended use is not permitted by statutory regulation or exceeds the permitted use, you will need to obtain
                                      permission directly from the copyright holder. To view a copy of this licence, visit http://creativecommons.org/licenses/by/4.0/.
                                      The Creative Commons Public Domain Dedication waiver (http://creativecommons.org/publicdomain/zero/1.0/) applies to the
                                      data made available in this article, unless otherwise stated in a credit line to the data.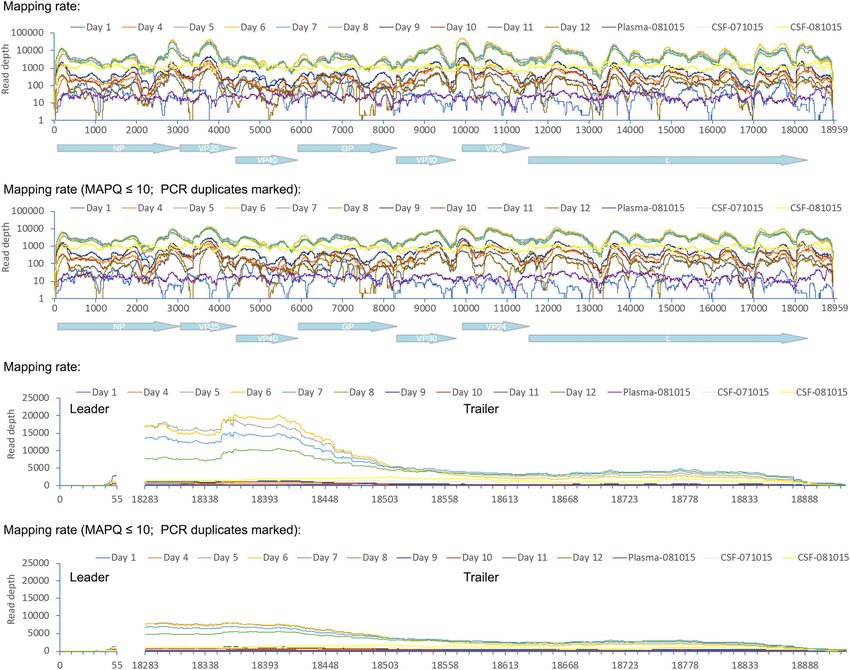
Bosworth et al. Genome Medicine   (2021) 13:5                                                                        Page 2 of 18

 (Continued from previous page)
 Results: The findings were compared to equivalent data from West African patients. The study found that both virus
 and host markers were predictive of a fatal outcome. This suggested that the extensive supportive care, and most likely
 the application of the medical countermeasure ZMab (a monoclonal antibody cocktail), contributed to survival of the
 UK patient. The switch from progression to a ‘fatal’ outcome to a ‘survival’ outcome could be seen in both the viral and
 host markers. The UK patient also suffered a recrudescence infection 10 months after the initial infection. Analysis of
 the sequencing data indicated that the virus entered a period of reduced or minimal replication, rather than other
 potential mechanisms of persistence—such as defective interfering genomes.
 Conclusions: The data showed that comprehensive supportive care and the application of medical countermeasures
 are worth pursuing despite an initial unfavourable prognosis.

Background                                                       with severe EVD, whether virus escape mutants were se-
Ebola virus disease (EVD) has a high case fatality rate and      lected during treatment, and what is the potential mecha-
is caused by infection of humans with Ebola virus (EBOV)         nism(s) of persistence. Such a study was made possible in a
[1]. Once confined to isolated outbreaks, West Africa wit-       healthcare worker in the UK with EVD (referred to as UK2),
nessed the largest ever EBOV outbreak between 2013 and           who had recently returned from Sierra Leone and who devel-
2016 [2] and a large outbreak then occurred in the Demo-         oped relapse of EVD in association with meningoencephalitis
cratic Republic of Congo [3]. The outcome of infection           10 months after initial presentation [16]. Longitudinal and re-
(death/survival) in EVD may be influenced by several fac-        crudescence blood, plasma, and cerebral spinal fluid samples
tors including viral load [4, 5], the host response [6, 7] and   were taken from UK2; RNA was extracted and sequenced.
the presence of other infections at the time of acute symp-      This provided a unique opportunity to study both EBOV
toms [8]. Generally, at the time of diagnosis, for the West      population genetics and the host response over the course of
African outbreak, patients with higher viral loads (as mea-      EVD and to probe the effectiveness of antibody-based inter-
sured by RT-qPCR) had a poorer prognosis than patients           ventions given as part of extensive supportive care. The peak
with lower viral loads [5]. RNA sequencing of blood sam-         viral load in UK2 during the early course of infection and to-
ples taken by the European Mobile Laboratory (EMLab)             gether with host markers was predictive of a fatal outcome
from acute patients at the time of presentation to a treat-      when compared to equivalent Guinean patients. Our study
ment centre during the West African outbreak indicated           found little change in overall EBOV consensus sequence, or
that the blood transcriptome was different between indi-         at a minor variant level despite the application of selection
viduals in the acute phase who went on to have a fatal in-       pressure (in the form of antibody-mediated therapy) or be-
fection or survived [6, 7]. This included stronger               tween initial infection and recrudescence 10 months later,
upregulation of interferon signalling and acute phase re-        suggesting a phase of reduced or low level replication, with
sponses in patients progressing to a fatal infection and in-     concomitant undetectable viral load. Changes in the blood
creased NK-cell populations in patients who went on to           transcriptome during EBOV infection in UK2 demonstrated
survive infection. During the West African outbreak, sev-        that many of the markers for inflammation and the innate
eral medical countermeasures were used and evaluated             response were much more abundant than that of patients in
both in Africa and on repatriated health care works in-          West Africa, at a similar time point in infection, who went
cluding favipiravir, convalescent plasma and monoclonal          on to have a fatal infection and far greater than those who
antibodies targeted against the EBOV glycoprotein (GP)           survived in this setting. This study provides molecular data
[9–11]. Whilst the presence of EBOV in seminal fluid was         to support the observation that the extensive care given to
described in 1977 [12] and shown to persist after non-           UK2 tipped the balance to survival [17]. The unusual situ-
detectable amounts were found in the blood [12], the             ation of a patient recovering from an infection associated
West African outbreak illustrated that a number of pa-           with very high viral load (that without high level critical care
tients had recrudescent infections. This often correlated        would almost certainly have resulted in death) could also
with persistence of the virus in what can be described as        prove useful for comparison with fatal EBOV challenge ex-
immune-privileged sites including the testes [13] and the        periments in non-human primate models for the purposes of
eye [14]. Analysis of EBOV evolution rates in semen sug-         evaluating medical countermeasures.
gested a mechanism of persistence rather than latency and
indicated that EBOV replication continued during conva-          Methods
lescence [15].                                                   Sampling
   Thus, several key questions remained including establish-     Samples were collected as part of diagnostic testing
ing if monoclonal antibody therapy was effective in humans       process and retained for research purposes with patient
Bosworth et al. Genome Medicine   (2021) 13:5                                                                 Page 3 of 18

consent. Samples were tested in accordance with con-             The RT-qPCR primers were designed as described for
sent and ethical approval. All blood specimens collected       EBOV targeting the glycoprotein (GP) gene sequence,
for RT-qPCR in this study were collected into EDTA             including MGB probe design (Thermo Scientific). For-
blood collection tubes. CSF was collected directly into        ward primer (900 nM), 900 nM Reverse primer and 250
plastic tubes without buffer. Blood and CSF was proc-          nM Probe were added to each reaction. Sequences of the
essed for RNA extraction immediately on arrival into the       primers and probe were Forward: 5′-TTT TCA ATC
diagnostic testing laboratory and residual RNA used in         CTC AAC CGT AAG GC-3′, Reverse: 5′-CAG TCC
this analysis.                                                 GGT CCC AGA ATG TG-3′, and Probe: 6FAM-CAT
                                                               GTG CCG CCC CAT CGC TGC-BHQ-3′. The Taq-
RT-qPCR analysis of viral RNA                                  MAN Fast Virus kit was used for reverse transcription
For extraction and purification of viral RNA, the              and PCR (Thermo Scientific), and water used in the re-
QiaAMP Viral RNA Mini Kit (Qiagen) was used. This              action was nuclease free water (Qiagen).
kit was validated as a suitable method for extraction of
viruses by diagnostic clinical laboratories, and the ability   Sequencing and bioinformatics analysis
of the contained Buffer AVL to neutralise Ebola virus          Samples from the patient from the initial infection or re-
has supporting evidence in the literature [18]. Initial        crudescence were either sequenced on MiSeq or HiSeq
samples prior to confirmed diagnosis of EVD were han-          platforms as described previously [8, 16, 20]. Briefly,
dled at ACDP (Advisory Committee for Dangerous                 RNA extraction from plasma and CSF was carried out in
Pathogens) Containment Level 3. Subsequent specimens           Containment Level 3 on the easyMag platform according
were handled in ACDP Containment Level 4 facilities.           to the manufacturer’s instructions, or on further samples
Inactivation was performed by addition of 140 μl plasma        from the initial infection by PHE at Containment Level
into 560 μl Buffer AVL; after 10 min incubation at room        4. CSF eluate was treated with RNase-free DNase I
temperature, 1:1 volume of 100% molecular grade Etha-          (Ambion), purified with RNAClean XP magnetic beads
nol was added (Sigma-Aldrich) and incubated for a fur-         (Beckman Coulter) and eluted into 11 μl of water.
ther 10 min. After inactivation specimens were surface         Plasma eluate was concentrated using magnetic beads as
disinfected by 10% sodium hypochlorite and transferred         indicated above, in the absence of DNase I treatment.
to Containment Level 2 for extraction and purification.        Samples were reverse transcribed using Superscript III
Viral RNA was quantified using the Nanodrop 2000               (Invitrogen) followed by dsDNA synthesis with NEB
(Thermo Scientific) or Qubit (ABi; Thermo Scientific).         Next(r) mRNA Second Strand Synthesis Module (NEB).
The standard Nanodrop 2000 assay for RNA concentra-            Libraries were prepared using a KAPA DNA Library
tion estimation was performed and ratios at 260/280 nm         Preparation Kit (KAPA Biosystems), following a modi-
and 260/230 nm calculated to ascertain purity. Samples         fied protocol as previously described. Resulting libraries
below an expected value of 1.8 were retested and, if per-      were quantified using a Qubit 3.0 fluorometer (Invitro-
sistently below this level, were re-extracted; no samples      gen) and their size determined using a 2200 TapeStation
used in this project failed this basic quality check. For      (Agilent). Libraries were pooled in equimolar concentra-
concentration estimation by Qubit assay, the Broad             tions and sequenced on the MiSeq and NextSeq Illumina
Range RNA kit (ABi; Thermo Scientific) was used. A             platforms.
synthetic control was designed using sequence from the            In this analysis, a human genome assembly GRCh38
region targeted by the RT-qPCR assay used in this pro-         with its gene structures (release-91) from Ensembl and
ject to use as control template [19]. This synthetic oligo-    an EBOV genome (GenBank sequence accession:
nucleotide sequence was cloned into the pMX-01 vector          KY426690) were used as references. Tophat2 v2.1.1 [21]
under the control of a T7 promoter (GENEArt; Thermo            was used to map RNAseq reads to the human reference
Scientific) and sequence verified by Sanger sequencing         and Cufflinks v2.2.1 [22] to determine normalised hu-
at GENEArt (Thermo Scientific) and Public Health Eng-          man gene expression levels (FPKM). Hisat2 v2.1.0 [23]
land’s Sequencing Service, Colindale, London, UK.              was used to map the trimmed reads on the human refer-
Quantitative real-time reverse transcription polymerase        ence genome assembly with default setting.
chain reaction (RT-qPCR) was used to quantify the                 FPKM calculated using Cufflinks was used as input
abundance of viral genome in study materials. Rather           data into Digital Cell Quantitation, which uses transcrip-
than designing a new assay, an assay with established ef-      tomic patterns to infer the predicted activity of immune
fectiveness and with validation data supporting usage          cell types. The unmapped reads were extracted by bam2-
was selected. This assay has been validated for clinical       fastq (v1.1.0) and then mapped on the EBOV reference
diagnostic use in the Rare & Imported Pathogens La-            genome using Bowtie2 v2.3.5.1 [23] by setting the option
boratory, part of Public Health England, UK, and utilised      to parameters “--local”, followed by Sam file to Bam file
in examining samples from patients with EVD [19].              conversion, sorting, and removal of the reads with a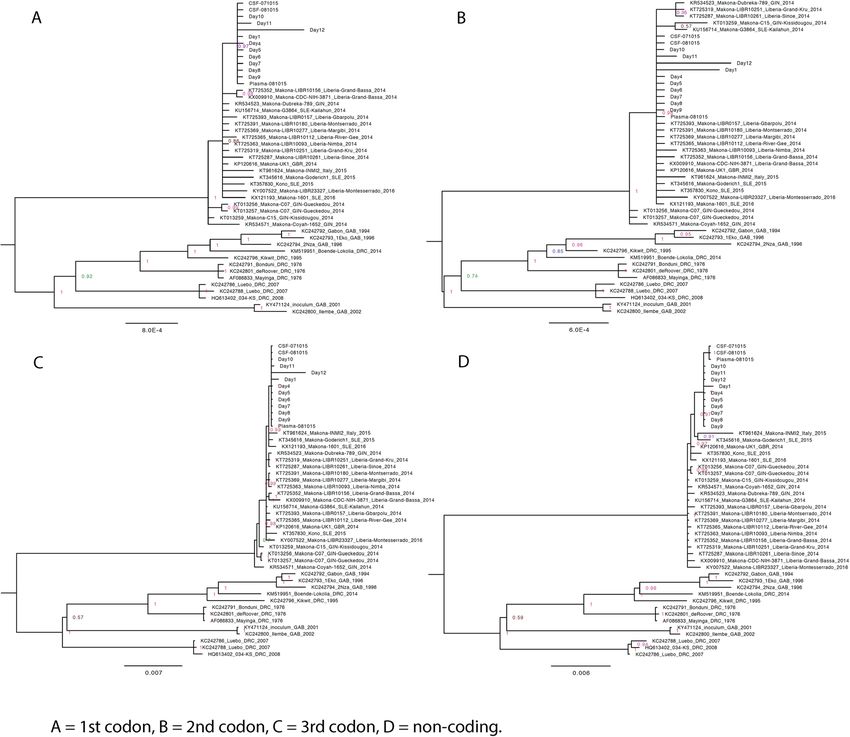
Bosworth et al. Genome Medicine   (2021) 13:5                                                                 Page 4 of 18

mapping quality score below 11 using SAMtools v1.9            had a markedly elevated temperature of 39.3 °C and was
[24]. After that, the PCR and optical duplicate reads in      haemodynamically unstable but responded rapidly to
the bam files were discarded using the MarkDuplicates         rapid intravenous fluids and antibiotic therapy. RT-
in the Picard toolkit v2.18.25 (http://broadinstitute.        qPCR for EBOV genome was performed by the Royal In-
github.io/picard/) with the option of “REMOVE_DUPLI-          firmary of Edinburgh Clinical Virology Department in
CATES=true”. The resultant Bam file was processed by          conjunction with the Rare & Imported Pathogens La-
Quasirecomb v1.2 [25] to generate a phred-weighted            boratory (days 1–2) and Virus Reference Department,
table of nucleotide frequencies which were parsed with a      Colindale (days 3–28) (part of PHE). The patient’s initial
custom perl script to generate a consensus genome se-         sample tested positive for EBOV RNA, and the patient
quence as our previous description [4]. The consensus         was transferred to the high-level isolation unit at the
genome was then used as a template in the second              Royal Free Hospital, London, UK, on the 2nd day after
round of mapping to generate the final consensus gen-         admission (referred to in this study as day 2). To ensure
ome sequences and corresponding phred-weighted table          consistency, all samples used in this study were retested
of nucleotide frequencies. yn00 in the PAML package in        and EBOV quantified using the Trombley RT-qPCR
the R environment was utilised to calculate rate of nu-       assay that targets a region within the GP coding
cleotide substitution within the patient and compare this     sequence.
with published rate of substitution determined through           A Ct value of 23.9 in the GP gene qRT-PCR assay was
analysis of multiple patients across transmission events.     recorded at presentation (day 1). On day 2, this changed
Consensus genome sequences (Supplementary data 1)             to Ct 21.2 in the GP gene assay. The patient was treated
and a phred-weighted table of nucleotide frequencies          with one oral dose of Brincidofovir (200 mg) (an experi-
(Supplementary data 1) were obtained for each sample.         mental antiviral drug) and two doses of convalescent
These nucleotide frequencies were used for comparison         plasma (300 ml) on consecutive days, obtained from a
of minor variation. These consensus genome sequences          survivor of EVD. By day 5, symptoms worsened, and the
were aligned with Mafft v 7.402 [26]. The aligned ge-         patient developed severe watery diarrhoea and type 1 re-
nomes were partitioned into four sets of sites: 1st, 2nd      spiratory failure. The patient also developed erythro-
and 3rd codon positions of the protein-coding regions         derma, mucositis and agitation, but did not develop
and the noncoding intergenic regions. PartitionFinder         overtly haemorrhagic manifestations.
v2.1.1 [27] was then used to find the best-fit substitution      The highest viral load was recorded on day 6 (Ct 14.3),
model and distribution of rates for each set. Four Bayes-     and the severity of the patient’s illness approximately
ian nucleotide divergence tree for these sets was then        correlated with viral load. The viral load data from this
constructed using MrBayes v3.2.6 [28], a Bayesian ana-        patient was compared with diagnostic findings from
lysis tool with their best-fit substitution model and         European Mobile Laboratory in the 2013–2016 West Af-
distribution of rates. The final consensus genome se-         rican outbreak [5]. West African patients in the outbreak
quences were also used as reference to identify DI events     with Ct of ~ 14, and treated in West Africa, all had a
by running the DI-tector v0.6 [29] programme with de-         fatal outcome. This illustrated the severity of illness for
fault setting.                                                UK2, and on this basis, the patient would have been pre-
                                                              dicted not to survive EVD.
Results                                                          The patient was administered ZMAb (50 mg/kg) by in-
Studies describing EVD over the course of an infection        fusion on day 5 and day 8. After day 12 of the illness,
in humans under controlled conditions are rare. Gener-        the viral load began to decrease. By day 21, the patient
ally, these have made use of laboratory accidents [12] or     had developed a pronounced thrombocytosis (peaking at
healthcare and related workers who were given extensive       1726 × 109/L; normal range 150–400) and was dis-
supportive care, and treated with experimental medical        charged on low-molecular-weight aspirin and heparin
countermeasures [30]. Currently, none of the medical          [31] following two consecutive negative RT-qPCR fur-
countermeasures for Ebola virus are of absolute proven        ther on days 25 and 28 of illness, in accordance with
benefit, although some hold promise [10, 11]. The ana-        general WHO advice. The overall course of illness was
lysis of longitudinal samples provides greater insight into   very similar to the clinical findings of outbreaks caused
EVD, and where given, the potential role of medical           by other variants of EBOV. However, 10 months follow-
countermeasures in facilitating survival.                     ing this illness, the patient was readmitted with a previ-
                                                              ously undescribed presentation of relapse of EVD in
Overview of UK2 upon presentation with and during EVD         association with the presence of virus in both plasma
In December 2014, a healthcare worker returned to the         and cerebral spinal fluid (CSF) [16].
UK from West Africa with acute febrile illness. On pres-         To investigate virus evolution and the host response to
entation at hospital (referred to as day 1), the patient      EBOV over the course of the primary infection and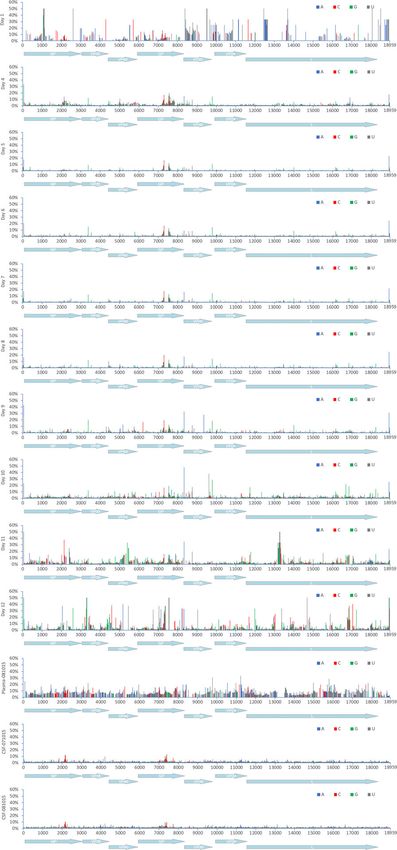
Bosworth et al. Genome Medicine (2021) 13:5 Page 5 of 18
Table 1 Sequencing reads across patient timeline for UK2 and also comparative data from selected EMLab patients (IDs 413, 753,
578, 462 and 351).
Plasma Blood
Day 1 Day 4 Day 5 Day 6 Day 7 Day 8 Day 9 Day 10 Day 11 Day 12
Total reads 13,431,416 3,833,134 2,645,578 2,177,628 5,431,570 5,705,462 1,864,628 3,049,104 1,481,988 4,342,832
Reads mapped 595 (0.00%) 54,856 1,037,421 1,198,007 914,490 692,250 116,405 65,188 21,352 25,429
to EBOV (1.43%) (39.21%) (55.01%) (16.84%) (12.13%) (6.24%) (2.14%) (1.44%) (0.59%)
Reads mapped 12,555,014 1,436,018 862,860 519,467 3,116,172 3,487,829 1,239,462 1,980,054 916,534 2,736,038
to human (93.47%) (37.5%) (32.6%) (23.9%) (57.4%) (61.1%) (66.5%) (64.9%) (61.8%) (63%)
Plasma CSF CSF EMLab 413 753 578 462 351
Month 10 Month 10 Month 10 Patient ID
071015 081015
Total reads 14,377,682 11,626,808 12,774,412 Total reads 56,565,350 6,398,890 78,423,238 47,990,570 75,648,710
Reads mapped 180 (0.00%) 9227 10,200 Reads mapped 20,471,809 1,099,593 7,544,790 4,469,920 5,525,548
to EBOV (0.08%) (0.08%) to EBOV (36.19%) (17.18%) (9.62%) (9.31%) (7.30%)
Reads mapped 13,590,746 11,073,317 12,164,725 Reads mapped 33,939,691 4,853,256 69,922,793 42,888,768 68,391,308
to human (94.53%) (95.24%) (95.23%) to human (60.00%) (75.85%) (89.16%) (89.37%) (90.41%)
during recrudescence, longitudinal analysis using RNA- the genes located towards the 3′ end of the negative
seq was carried out using available samples and com- strand genome [32].
pared to equivalent patients from West Africa (Table 1).
These included a plasma sample sequenced upon initial Analysis of viral genome abundance by RNA-seq in UK2
admission (day 1), blood samples taken over the acute with time post-admission suggested a viral load
phase between days 4 and 12, and during recrudescence, associated with a fatal outcome at the early stages of
a plasma and CSF samples. These latter samples were infection
from the same lumbar puncture, but separate aliquots The sequencing data from the blood samples (Table 1)
sent to independent laboratories who received them on also provided an independent comparison of the relative
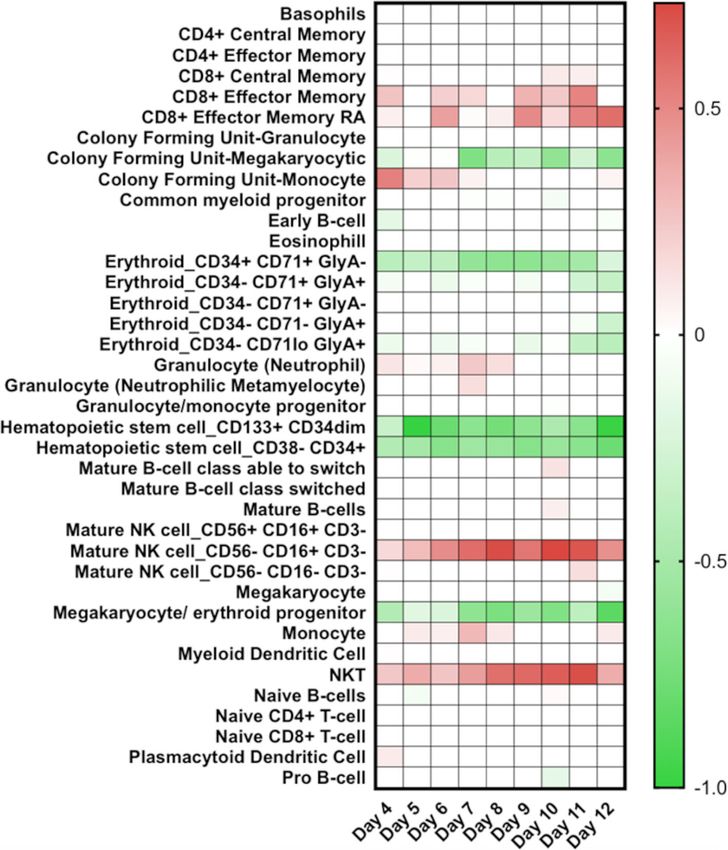
different days. Sequence reads were mapped to the amount of EBOV between each day post admission
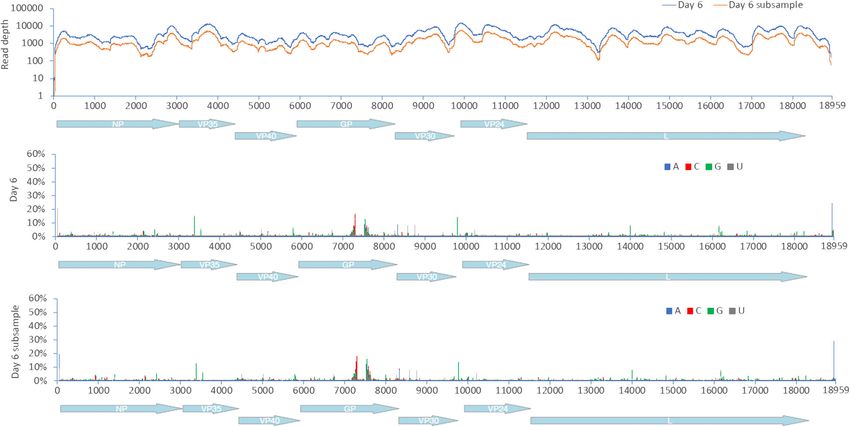
EBOV genome and the human genome (Table 1). The using the number of sequence reads mapped to the viral
sequence read depth across the EBOV genome was ap- genome and clarified ambiguity with the RT-qPCR-
proximately equivalent for the different samples suggest- based assays. Analysis of diagnostic leftover plasma/
ing that viral genomic RNA had been sequenced rather blood samples taken from patients during the West Afri-
than EBOV mRNA (Fig. 1), which would have been as- can outbreak in Guinea showed a close correlation at ad-
sociated with a higher proportion of reads mapping to mission between viral load as determined by RT-qPCR,
Fig. 1 Time-course showing viral load as measured by RT-qPCR of the GP gene of EBOV in samples collected from a UK case of EVD. The X-axis
displays the days post symptoms. The right-hand y-axis displays the relative viral genome abundance (calculated by PCR maximum cT (30) −
sample cT to calculate the proportional inverse value). The left-hand y-axis displays RNAseq data from the blood samples as reads mapping to
the EBOV genome as a proportion of total reads. The peak of viremia is discernible at day 6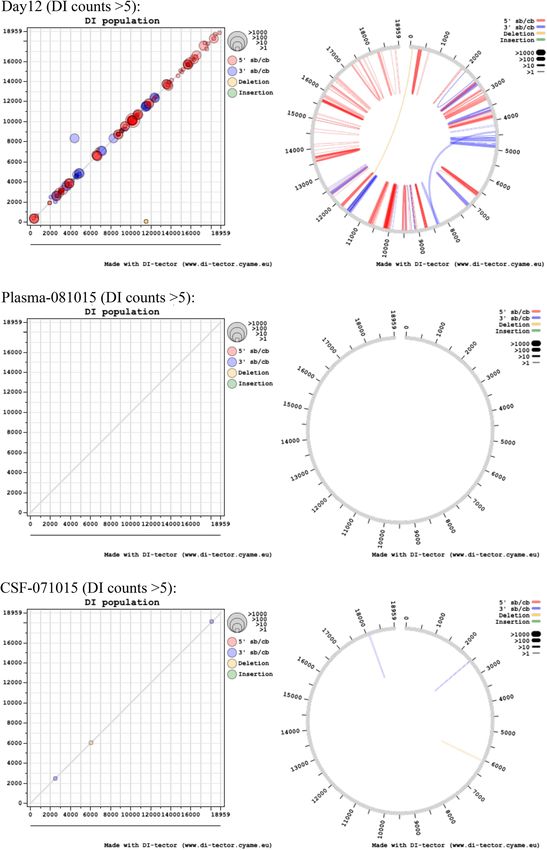
Bosworth et al. Genome Medicine         (2021) 13:5                                                                                      Page 6 of 18

genome abundance determined by the number of                                   Analysis of RNAseq data between UK2 and gender
mapped reads and outcome (survival/death) [4]. There-                        matched data from similar blood samples from adult
fore, for each sequenced sample for UK2, the proportion                      Guinean patients with EVD at the time of admission
of reads mapping to the EBOV genome was compared                             (Table 1) allowed comparative quantification of viral
to the total number of reads (Table 1). This value was                       loads. The samples from Guinea were taken on average
then compared to the viral load data—derived from RT-                        6 days post symptom onset and therefore are approxi-
qPCR analysis of blood samples (Fig. 1). This compari-                       mately equivalent to UK2 at the early stage of infection.
son revealed that where data for both viral load and                         Patient 413 (Table 1) had the largest proportion of se-
reads mapping to the EBOV genome were available,                             quence reads mapping to EBOV, yet this was less than
there was a close correlation between both measure-                          UK2 at day 6. This provided further evidence for the se-
ments. Both viral load and percentage reads mapping to                       verity of this EBOV infection in the UK2 patient, and
the EBOV genome peaked on day 6. The percentage of                           based on this, the prediction of a fatal outcome in UK2.
reads mapping to the EBOV genome illustrated a sharp
increase in EBOV over a 2-day period from day 4                              Measurement of host biomarkers in UK2 and comparison
(1.43%) to day 6 (55.01%). After the infusion of ZMAb                        to acutely ill Guinean patients were indicative of a fatal
on day 5, the reads mapping to the viral genome                              outcome
dropped between day 6 and day 7. However, not until                          Analysis of the blood transcriptome in patients with
days 11/12 did the percentage of reads mapping to the                        EVD can provide detailed information on the host re-
EBOV genome decrease below the day 4 value. Also, for                        sponse to EBOV infection [6, 7]. The RNAseq data pro-
day 6, most sequence reads mapped to the EBOV gen-                           vided a readout on what host RNAs increased and
ome (Table 1).                                                               decreased in abundance in patients with EVD compared

 Fig. 2 Transcript abundance data (FPKM) displayed for 16 genes characterised as known interferon stimulated genes (ISG). The transcript abundance
 for each of the genes correlates well with abundances of viral RNA and they decrease over time. Transcript FPKM is shown on the y-axis for each gene
 and x-axis displays the days with symptoms from day 4 to day 12. The identifier for each gene is given above each chart. A zero value indicates that
 the transcripts was either not detected or the transcript was absent
Bosworth et al. Genome Medicine        (2021) 13:5                                                                                     Page 7 of 18

to patients without EVD. These changes in abundance                         database. In the dataset, 31 potential ISGs were identified
may have been caused by differential gene expression                        at all 9 time points (days 4–12). Transcripts encoding
and/or an influx or efflux of different cell types from the                 well-characterised interferon stimulated genes are shown
blood. In this study, we made use of the sequencing data                    in Fig. 2. FPKM values for each transcript were compared
to map reads to the human genome (Table 1). For six of                      at each time point and displayed without further process-
the samples, from day 7 to day 12, the number of reads                      ing. With the general exception of the day 4 sample, the
that could be mapped to the human genome was around                         majority of gene transcript abundance peaked with max-
60%. For the other days, a lower number of reads                            imum viral genome abundance in the samples from day 5/
mapped to the human genome, reflecting the very high                        day 6. Reflecting data from non-human primate studies
viral load in UK2, and dominance of EBOV RNA in the                         [33] and from the blood transcriptome analysis of samples
blood transcriptome. The abundance of transcripts was                       from patients from Guinea [6], this suggested that the in-
inspected across the time course to ensure that no major                    nate response was a critical aspect of the cellular response
variation in either library preparation on sequencing run                   to EBOV.
introduced bias. In many cases, the abundance of tran-                        The abundance of several host transcripts/proteins has
scripts in the day 4 samples was higher than any of the                     been shown to correlate with outcome in West African
other samples; therefore, the dataset from this day was                     patients with EVD. For example, fatal EVD has been as-
treated with caution. Values from this day are included                     sociated with the increase in abundance of cytotoxic T
for completeness in the analysis of differential gene ex-                   lymphocyte-associated protein 4 (CTLA-4) and eomeso-
pression but should not be considered definitive.                           dermin (Eomes), suggestive of defects in T cell homeo-
  The blood transcriptome of patients in Guinea at pres-                    stasis [34]. Where detected by sequencing, both
entation to an Ebola virus treatment centre indicated in-                   transcripts were elevated in abundance at day 6 com-
creased levels of interferon stimulated genes (ISGs)                        pared to the other days. The abundance of chemokine
relative to normal or convalescent controls [6]. Therefore,                 transcripts that could be detected, except for CXCL11
the abundance of ISGs in UK2 was analysed. Transcripts                      (which peaked on day 6), tended to peak on day 7. These
which were consistently detected across the longitudinal                    included CXCL2, CXCL9 and CXCL12 (Fig. 3) and func-
time course were identified using the Interferome v2.01                     tion to recruit T cells.

 Fig. 3 Transcript abundance data (FPKM) displayed for 6 genes characterised as involved in the immune response. The transcript abundance for
 each gene correlates well with abundances of viral RNA and they decrease overtime. Transcript FPKM is shown on the y-axis for each gene, and
 x-axis displays the days with symptoms from day 4 to day 12. The identifier for each gene is given above each chart. A zero value indicates that
 the transcripts was either not detected or the transcript was absent
Bosworth et al. Genome Medicine         (2021) 13:5                                                                                       Page 8 of 18

  Overall, the data suggested that the IFN response was                      system. Conventionally flow cytometry is used to assess
robust and to be expected in an overwhelming infection.                      these—however, this was not possible with samples from
There was no evidence of any rare immunodeficiency in                        this patient. Therefore, to investigate changes in the im-
innate immunity. Indeed comparison of day 6 levels to                        mune cell phenotype, digital cell quantification (DCQ)
equivalent Guinean patients with a fatal outcome [6]                         [35] was used to predict which cell types may have been
would suggest that the innate response was generally                         present at each time point by comparing the transcrip-
higher than when compared to those patients who went                         tomic data to a characterised healthy control group [6].
on to survive EVD.                                                           Previously, we used this approach to interrogate simi-
                                                                             lar transcriptomic data from West African patients
Changes in the immune cell phenotype occur as infection                      [6]. In patients with EVD who went on to have a fatal
progresses and viral load decreases                                          outcome, DCQ analysis predicted that lower levels of
Potential changes in the blood/plasma transcriptome can                      circulating CD14+ classic monocytes would be
be through either changes in gene regulation such as dif-                    present, which was confirmed with flow cytometry
ferential expression and/or through the influx and efflux                    [6]. DCQ was applied to the transcriptomic data from
of different cell types—such as those of the immune                          UK2 (Fig. 4) and indicated potential changes in the

 Fig. 4 Predicted differential abundance of cell types present in the samples from UK2 at the days indicated. These are shown as relative abundance as
 predicted by DCQ compared to a healthy control group at each day. Within the heatmap, darker green represents a decrease in the abundance of a
 given cell type and darker red indicates an increase in the abundance of a specific cell type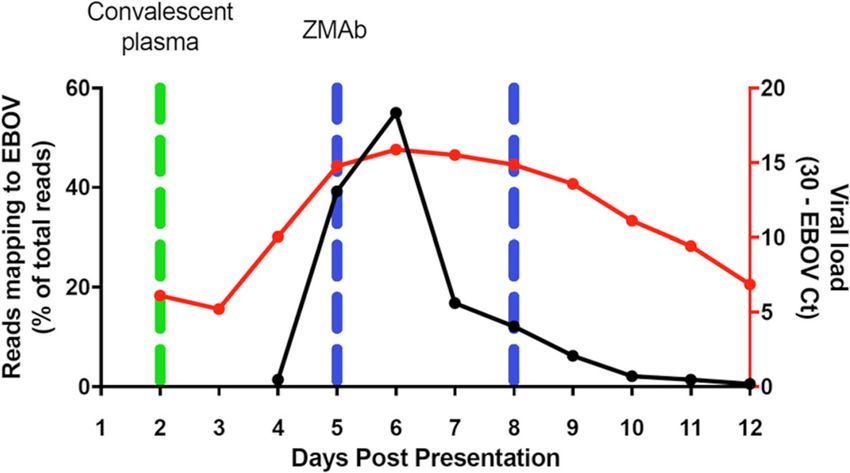
Bosworth et al. Genome Medicine (2021) 13:5 Page 9 of 18
abundance of a given cell type. Of note were the pre- consensus sequence covering the full length of the
dicted increase in abundance of both natural killer GP gene. All the amino acids identified to be critical
cells (CD56− CD16+ CD3−) and natural killer T cells for targeting by ZMAb were represented in each con-
(NKT) cells, through alignment of the transcriptomic sensus sequence (Fig. 5). This data suggested that
profile of these cell types by the DCQ process. there was no selection of antibody escape mutants to
form the dominant amino acid sequence in a consen-
Analysis of the viral genome population suggested that sus population at the dosing schedule used.
escape mutants to ZMab during infection and treatment The application of ZMab, although not affecting the
were not selected or present consensus EBOV genome population, may have acted as
UK2 was administered ZMAb at day 5 and day 8. The spe- a selection pressure at the level of minor variants, e.g.
cific targets of ZMab are known and found in GP. Both 2G4 changes in sequence that did not achieve a 50% thresh-
and 4G7 target the base of GP, between them encompassing old, and hence become consensus sequence. To investi-
amino acids C511, N550, D552, G553 and C556. Monoclo- gate this, the pattern of minor variants within the EBOV
nal antibody 1H3 targets the glycan cap and encompasses genome at each time point was examined (Fig. 6). The
amino acids W275, K276 and P279. To investigate whether data suggested that there was no overall large increase in
there were any changes in GP (or other EBOV proteins), minor variant frequency in any codon position and par-
EBOV consensus genomes were assembled for each time ticularly at positions 1 and 2 that would have been indi-
point and sample and then used to derive EBOV protein se- cative of a non-synonymous substitution and emergence
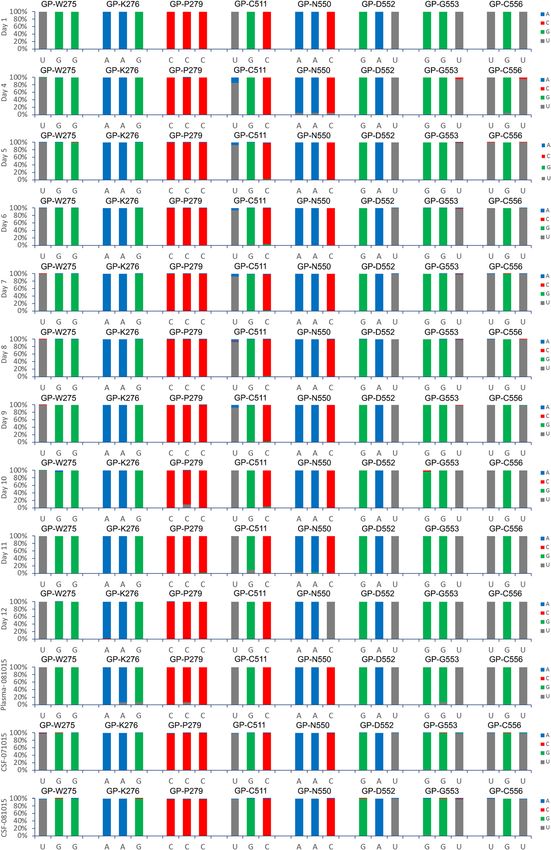
quences. Alignment of these sequences produced a of specific escape mutants to ZMab (Fig. 6).
Fig. 5 Consensus sequence in the portions of the EBOV genome corresponding to the ZMAb binding sites identified in GP. In red are amino
acids targeted by the antibody cocktail that forms ZMabBosworth et al. Genome Medicine (2021) 13:5 Page 10 of 18 Fig. 6 Minor variant frequencies at specified amino acid positions involved in binding the monoclonal antibodies that form ZMab in EBOV GP for the different time points post infection, including recrudescence Analysis of virus population genetics suggested the response and the production of neutralising antibodies antibody response was directed against the consensus some 10–12 days post-infection. Longitudinal samples genome population were analysed to investigate EBOV population genetics During infection, there are various evolutionary pres- in UK2. Phylogenetic analysis of the consensus nucleo- sures placed on the virus, including the innate immune tide sequences of EBOV in UK2 at different sampling system early in infection transitioning to the adaptive points indicated a lack of divergence (Fig. 7). Day 12
Bosworth et al. Genome Medicine      (2021) 13:5                                                                              Page 11 of 18

 Fig. 7 Phylogenetic analysis and comparison of EBOV sequence of the 1st, 2nd and 3rd codons and non-coding sequences in UK2 (from both
 the first and recrudescent infections) with EBOV genome sequences from the West African (2013–2016) and earlier outbreaks back to 1976

post admission was the most divergent sample, based on                 investigate this possibility, 62% of the reads were ran-
an analysis of coding sequence, with the recrudescent                  domly removed from day 6 to make the read depth
plasma and CSF samples being most similar to day 10/                   equivalent to the day 11 and day 12 read depths. The
day11, suggesting that potentially prior to day 12, EBOV               mapping depths were compared before and after the
had migrated to the central nervous system, considered                 subsampling. This indicated the random selection had
an immune privileged site. Whilst there was no overall                 no bias and no change in the frequency of variants, sug-
major change in EBOV consensus sequence, variation in                  gesting that the minor variants were real phenomena
the EBOV genome was investigated between each sam-                     (Fig. 9). Second, is that the immune therapy given (con-
ple and whether potential nucleotide variation occurred                valescent sera/monoclonal antibodies) restricted the viral
at the level of minor variants. Analysis of minor variants             genotypes. However, as described, there was no evidence
showed that these were frequent on day 1, and then ap-                 of minor variants being selected in response to ZMab,
peared restricted on days 4 to 8 (Fig. 8). Several hypoth-             and anecdotal evidence suggested that the convalescent
eses could account for this. First, was the lower                      sera used was not neutralising. Although this treatment
sequence read depths mapping to the EBOV genome,                       may have placed some selective pressure on the virus
providing noisier data, although the general trend in the              through Fc mediated antiviral actions. Minor variants
pattern of minor variants was similar at all days. To                  appeared to increase in frequency on day 9 and become
Bosworth et al. Genome Medicine (2021) 13:5 Page 12 of 18
[13, 38] has been suggested as potentially containing res-
ervoirs of virus that can initiate new infections many
months after an individual has been declared free of
EBOV. As described herein and previously [16], UK2 de-
veloped EVD approximately 9 months after being dis-
charged from the first infection with EBOV. This
manifested in a severe acute meningo-encephalitic illness
with fever, severe headache and photophobia and bilat-
eral VI, left pupillary-sparing partial III, left upper motor
neuron VII and left VIII cranial nerve palsies and left-
sided cerebellar dysfunction. A markedly higher viral
load was present in CSF than plasma and MRI scanning
of the brain confirmed involvement of the leptomenin-
ges, brainstem, cranial nerves, cauda equina, conus
medullaris and left cerebellar hemisphere. This fluid sur-
rounds central nervous system sites described as im-
mune privileged. After the case report for the
recrudescent illness involving meningoencephalitis in
this patient was published [16], the presence of aber-
rantly synthesised EBOV genomes, termed defective
interfering (DI), was proposed as a potential mechanism
to maintain a persistent infection of EBOV [39]. In this
case, the DIs proposed, copy backs, are formed from the
5′ end of the genome, and outcompete the genome in
terms of replication. Thus, from the sequence data, a
greater number of sequence reads would be predicted to
map to the 5′ end versus the 3′ end of the genome if
this type of DI was present. Another form of DI, called a
deletion DI, is created through discontinuous RNA syn-
thesis. Alternatively, to DIs supressing or competing
with virus replication, the virus may have entered a state
of reduced or less efficient replication, in which case, the
rate of non-synonymous versus synonymous substitu-
tions would be lower than would predicted based on the
expected rate of genome evolution from studies that in-
clude transmission. This latter hypothesis is possible be-
cause phylogenetic analysis indicated that the major
evolutionary driving force in the initial infection was
non-synonymous changes, whereas between the initial
Fig. 8 Map of minor variants across the EBOV genome for each infection and recrudescence the predominant mutations
sample (day 4 to day 12) and during recrudescence. A schematic of were synonymous (Fig. 7).
the position of EBOV genes along the genome is shown on To investigate the presence of DIs, the viral sequen-
the X-axis cing data from UK2 was analysed both for read depth at
the 3′ and 5′ ends and also fusion events using the Di-
more common place by day 12. This corresponded with tector algorithm to establish the frequency of discon-
the large decrease in viral load on these days compared tinuous fusion events, which would be characteristic of
to peak viral load at day 6. deletion DIs [29]. Further, the same fusion event would
be predicted to be in multiple sequential samples if the
EBOV persistence may be due to a state of significantly DI became established and was propagated during repli-
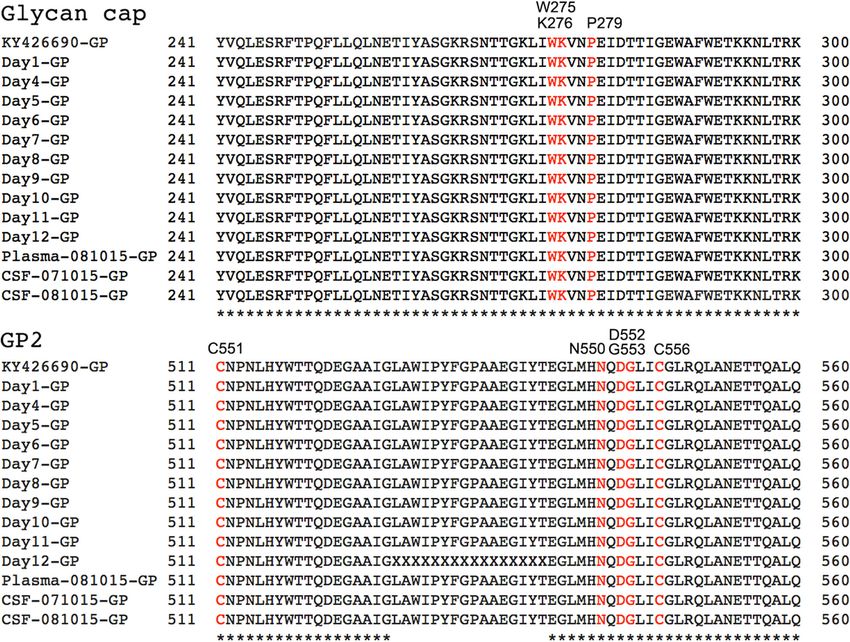
reduced rate of viral replication rather than defective cation of viral RNA. The read depth analysis indicated
genomes no enrichment of sequence reads mapping to the 5′ end
The presence of EBOV in sites described as immune pri- of the genome relative to the 3′ end suggesting that copy
vileged in both non-human primate models [36, 37] and back DIs had not become established in any of the sam-
in survivors of the 2013–2016 West African outbreak ples (Fig. 10).Bosworth et al. Genome Medicine (2021) 13:5 Page 13 of 18 Fig. 9 Distribution of sequence reads mapping to the EBOV genome before and after randomised sub sampling. Day 6 was chosen as a comparison point. A schematic of the position of EBOV genes along the genome is shown on the X-axis Analyses of the sequence data by Di-tector indicated a substitutions per site per year, we would expect ap- diverse array of fusion events in many of the samples ei- proximately 22 nucleotide substitutions over a 9- to ther within or between negative (genome) and positive 10-month period. (anti-genome) strands (Table 2). Mostly these were con- The ratio of non-synonymous substitutions (dN) and fined to short deletions of the genome. DIs can be pack- synonymous substitutions (dS) were compared between aged into virions and therefore spread during infection. day 1 and day 12 showing a substitution rate of 0.4323 Several the same fusion events were present in multiple for the NP gene, 0.6717 for the VP35 gene, 0.0961 for days and also in the CSF and also increased with read the GP gene, and 0.3545 for the L gene, with VP40, depth from sequential days in the blood samples VP30 and VP24 showing no evidence of nucleotide sub- (Fig. 11). This suggested that potentially the same DI stitution. This shows potentially differential selection was being propagated. However, the reads mapping to pressure acting along the EBOV genome during infec- the fusion events were never in the majority and infre- tion. The analysis was similarly performed between day quent compared to the total number of reads mapping 9 (when we postulate EBOV became established in a to the EBOV genome, including in the CSF. state of less active replication) and the samples taken in As discussed, alternatively, the virus may have entered 2015 using yn00 in the paml package. Unlike the small a state of low level replication, proposed by Young et al. rate of substitution seen between days 1 and 12, com- for other viruses [40]. Here, genome variants may be se- parison between day 9 and recrudescent infection several lected for in which virus replication is suppressed and months in 2015 later showed no significant genomic may therefore evade antiviral activity and a cellular changes. response. Previously, comparison of non-synonymous changes between EBOV in the plasma and CSF re- Discussion vealed only two non-coding changes, present and Whilst both the host response [6, 7, 30] and the pres- identical in both samples, compared with the original ence of co-infections [8] may contribute to the outcome sequence from plasma (NCBI accession numbers in EVD, the overwhelming factor is viral load, with high KU052669 and KU052670) [16]. Herein, EBOV gen- viral loads (Ct < 18.1) being associated with a fatal out- ome sequence from these samples was also compared come [4, 5]. The analysis of both viral load and the host to the samples taken at different days from the ori- response through sequencing blood samples from UK2 ginal infection. Given that the nucleotide substitution and comparison to equivalent matched patients from frequency, as calculated from data from the West Af- Guinea revealed the severity of the infection in UK2 rican outbreak [4], was in the order of 1.42 × 10⁻³ (Table 1). In our experience, West African patients with
Bosworth et al. Genome Medicine       (2021) 13:5                                                                               Page 14 of 18

 Fig. 10 Read depth analysis of samples sequenced. A schematic of the position of EBOV genes along the genome is shown on the X-axis for the
 mapping rate, and the lower two analyses focus on the reads mapping to the 3′ and 5′ ends of the genome. Mapping rates were shown before
 and after filtration, i.e. the MAPQ > 10 and PCR duplicates were removed

these viral loads invariably had a fatal outcome. Simi-                 been predicted to have a fatal outcome. This frames the
larly, in West African patients upon testing at the Ebola               question of how UK2 survived.
Treatment Centre, in those patients who succumbed to                      UK2 was administered a monoclonal antibody cock-
the disease, there was a greater upregulation of inter-                 tail, ZMab, on two occasions. Data from experiments
feron signalling and acute phase responses, compared to                 in non-human primate models of EVD suggested that
patients who went on to survive infection [6]. Particu-                 such therapeutics enhanced the chance of survival.
larly notable was the strong upregulation of gene tran-                 For example, the monoclonal antibody cocktail MB-
scripts associated with significant liver pathology. Cell               003, provided 50–100% survival in rhesus monkeys
subtype prediction using mRNA expression patterns in                    when administered within 24–72 h after EBOV inocu-
the blood indicated that natural killer (NK) cell popula-               lation [41]. A different cocktail of antibodies called
tions were greater in patients who went on to survive in-               ZMAb (Public Health Agency of Canada) resulted in
fection versus patients who went on to have a fatal                     100% survival when administered to cynomolgus ma-
outcome [6]. Fatal EVD in these patients was also char-                 caques 24 h after exposure to EBOV [42], and was
acterised by strong T-cell activation [34]. The data indi-              used to treat a repatriated healthcare worker [43].
cated that the abundance of transcripts associated with                 During the 2013–2016 EBOV outbreak in West Af-
severe and fatal infection in West African patients [6] at              rica, a different formulation called ZMapp was also
the early time points in UK2, e.g. days 5 and 6, was                    used. This had also previously been shown to be ef-
greater (Figs. 2 and 3), suggesting that UK2 would have                 fective in the treatment of nonhuman primates with
Bosworth et al. Genome Medicine       (2021) 13:5                                                                   Page 15 of 18

Table 2 Frequency of defective viral genomes detections
                     Total DI reads          5′ DVGs           3′ DVGs              DVGs with deletion        DVGs with insertion
Day 1                83                      8 (9.4%)          1 (1.2%)             28 (33.73%)               46 (55.42%)
Day 4                4096                    3163 (77.22%)     815 (19.90%)         24 (0.59%)                94 (2.29%)
Day 5                68,219                  55,389 (81.19%)   10,926 (16.02%)      447 (0.66%)               1457 (2.14%)
Day 6                109,650                 96,162 (87.70%)   11,518 (10.50%)      498 (0.45%)               1472 (1.34%)
Day 7                90,244                  71,070 (78.75%)   17,882 (19.82%)      433 (0.48%)               859 (0.95%)
Day 8                76,582                  59,710 (77.97%)   16,004 (20.90%)      325 (0.42%)               543 (0.71%)
Day 9                13,202                  10,145 (76.84%)   2904 (22.00%)        55 (0.42%)                98 (0.74%)
Day 10               7449                    5346 (71.77%)     2074 (27.84%)        17 (0.23%)                12 (0.16%)
Day 11               2179                    1678 (77.01%)     471 (21.62%)         14 (0.64%)                16 (0.73%)
Day 12               2914                    2125 (72.92%)     762 (26.15%)         10 (0.34%)                17 (0.58%)
Plasma-081015        16                      4 (25.00%)        11 (68.75%)          0 (0.00%)                 1 (6.25%)
CSF-071015           437                     154 (35.24%)      197 (45.08%)         22 (5.03%)                64 (14.65%)
CSF-081015           463                     137 (29.59%)      215 (46.44%)         33 (7.13%)                78 (16.85%)

EVD after 5 days post experimental infection [44]. Al-            the potential for recrudescence after the initial infec-
though a randomised control trial in humans using a               tion and persistence of the virus in immune privileged
combination of ZMapp plus the current standard of                 sites [13, 14, 16]. Similar to patients from West Africa
care versus the current standard of care alone showed             and other repatriated health care workers [14], UK2
some benefit, the study did not reach the prespecified            suffered a recrudescent infection 10 months after their
statistical threshold for efficacy [11]. In certain exam-         initial infection—despite there being no evidence of
ples, EBOV escape mutants have been identified when               EBOV in the blood after the first infection. Several
antibody-based therapy has been used to inhibit/re-               mechanisms may account for the recrudescence, in-
duce EBOV infection in non-human primate models                   cluding a ‘latent state’ and the possible role of DIs as
of infection [45]. The RNAseq data from UK2 re-                   way of modulating virus replication [39] to levels
vealed a decrease in reads mapping to the viral gen-              below the limit of detection. Certainly, this hypothesis
ome after the application of the monoclonal antibody              is not without merit, as defective measles virus ge-
cocktail ZMab. This was perhaps a more accurate in-               nomes have been identified in the brain cells of pa-
dication of the amount of virus than the RT-qPCR                  tients with subacute sclerosing panencephalitis (SSPE)
analysis. Although UK2 was effectively a N of one, we             [47]. If this were the case with UK2, we would hy-
hypothesise that given both viral and cellular markers            pothesise that DIs would compete for viral proteins
were predictive of a fatal outcome, the application of            involved in RNA synthesis and other processes and
ZMab was responsible for the dramatic lowering of                 maintain low levels of viral genomes. Recrudescence
viral load, and the change in the patient from a pre-             would then be explained through the resurgence of
dicted fatal outcome to a survival pathway. This was              the viral genome—similar to predator/prey relation-
perhaps evidenced by the DCQ analysis suggesting a                ships. Analysis of the RNA sequencing data from both
greater abundance of natural killer cells as the time             the initial infection and recrudescence in UK2 indi-
increased post-presentation and viral load decreased              cated that at no point did the DIs become the
(Fig. 4). DCQ analysis of samples from West African               majority population. Overall, we conclude that DIs
survivors at the acute phase of infection suggested a             (assuming they are not artefacts of the sequencing
greater abundance of NK cells compared to equivalent              protocols) may have been present at levels where they
patients who went on to have a fatal infection [6].               did not outcompete genomic replication and therefore
This was confirmed in further experiments using flow              did not significantly impact virus lifecycle.
cytometry [46], where CD56 negative NK cells were                    Rather, based on the lack of viral sequence diversity/evolu-
associated with a survivor outcome [46]. The DCQ                  tion between the initial infection and relapse, we favour a
analysis of the samples from UK2 predicted an in-                 model of the virus entering a state of reduced virus replica-
crease in CD56- NK cells (Fig. 4).                                tion, as suggested by the phylogenetic analysis based on cod-
  Given the scale of the outbreak and attention, sev-             ing versus non-coding changes (Fig. 2). Recently, models of
eral aspects of EVD came to the forefront including               persistence in RNA viruses that cause acute infections have
Bosworth et al. Genome Medicine (2021) 13:5 Page 16 of 18 Fig. 11 In left scatter-plot, the breakpoint site (BP) and re-initiation site (RI) positions are respectively used for “x” and “y” axis, and the closer the dot is to the diagonal of the scatter plot, the smaller the distance between BP and RI. In the right chord diagram, sequence starts at the viral genome extremity, jumps from BP to RI and terminates from RI to genome extremity again. Colour and dot/line size change according to DI genome type and frequency been proposed where single amino acid substitutions in viral infection in UK2, we hypothesise that whilst a robust adap- proteins can result in aberrant RNA replication [40]. Restor- tive immune response cleared the consensus EBOV genome ation of the wild-type or alternative functional amino acid re- population in the original infection, minor variant virus pop- sults in lytic infection [40]. To account for the recrudescent ulations were harboured in immune privileged sites.
Bosworth et al. Genome Medicine                   (2021) 13:5                                                                                                 Page 17 of 18

  These minor variants may have been deficient in repli-                                     Availability of data and materials
cation and protected from the immune response. This                                          All raw sequencing reads from this study have been deposited under NCBI
                                                                                             project PRJNA668038 BioProject (https://www.ncbi.nlm.nih.gov/bioproject/
would lead to persistence of the virus. In which case, the                                   PRJNA668038) [48].
restoration of efficient replication through mutation and
random chance led to a second EBOV infection and po-                                         Ethics approval and consent to participate
                                                                                             This study was reviewed by the National Research Ethics Committee, part of
tentially the requirement for the generation of further                                      the National Health Service, UK. A North-Westsub-committee considered the
neutralising antibodies. Analysis of the virus population                                    ethical aspects of this study and approved this work under REC reference 15/
genetics in the initial infected revealed a narrowing of                                     NW/0744. The patient provided informed consent to this work after discus-
                                                                                             sions with NHS medical staff. This study was conducted in accordance with
the minor variants from day 4 to day 10. To account for                                      the declaration of Helsinki. All work was performed in accordance with the
this observation, we postulated that although the im-                                        Human Tissue Act (2004). The study is listed on the Health Research Author-
mune system will be directed against the whole virus                                         ity website, and can be found under IRAS 189909.
                                                                                             The patient received all experimental treatments under compassionate use:
population, the dominant immune response would have                                          approval was obtained through an established internal clinical review and
been against the consensus phenotype/genotype of the                                         governance process, and included fully informed patient consent.
virus, potentially eliminating the consensus genotype vi-
ruses at an accelerated rate compared to viruses carrying                                    Consent for publication
                                                                                             Written informed consent was obtained from the patient to publish data
minor variants. Analysis of the minor variant frequency                                      from this study and reviewed under REC reference 15/NW/0744.
in the samples taken during recrudescence indicated
fewer variants compared to the original infection.                                           Competing interests
                                                                                             The authors declare that they have no competing interest.

Conclusions                                                                                  Author details
                                                                                             1
                                                                                              Public Health England, Manor Farm Road, Porton Down, Salisbury, UK.
This sequencing analysis provided a longitudinal natural                                     2
                                                                                              Clinical Virology, University Hospitals Birmingham NHS Foundation Trust,
history of infection and the corresponding host response                                     Birmingham, UK. 3Health Protection Research Unit in Emerging and Zoonotic
in a patient with EVD. Together with the supportive care,                                    Infections, National Institute for Health Research, Liverpool, UK. 4Institute of
                                                                                             Infection, Veterinary and Ecological Sciences, University of Liverpool,
the use of the medical countermeasure ZMab was likely to                                     Liverpool, UK. 5Infectious Disease Horizontal Technology Centre (ID HTC),
have changed UK2’s pathway from a fatal outcome to sur-                                      A*STAR, Singapore, Singapore. 6School of Cellular and Molecular Medicine,
vival. The study thus provides direct molecular evidence                                     University of Bristol, Bristol, UK. 7Liverpool School of Tropical Medicine,
                                                                                             Liverpool, UK. 8Department of Infection, Royal Free London NHS Foundation
to support the supposition by one of the authors (and at-                                    Trust, London, UK. 9MRC-University of Glasgow Centre for Virus Research,
tending physician for UK2) [17] that despite an initial un-                                  Glasgow, UK. 10Nufield Department of Medicine, Wellcome Trust Centre for
favourable prognosis (i.e. death), disease management and                                    Human Genetics, University of Oxford, Oxford, UK.
treatment in extreme cases of EVD are worth pursuing.                                        Received: 27 November 2019 Accepted: 12 November 2020

Acknowledgements
We would like to thank Richard Randall and Elizabeth Wignall-Fleming at the                  References
University of St. Andrews for discussions on DIs. We would like to thank UK2                 1. Malvy D, McElroy AK, de Clerck H, Gunther S, van Griensven J. Ebola virus
for permission to analyse their blood samples. We thank Professor Gary                           disease. Lancet. 2019;393(10174):936–48.
Kobinger (University of Laval, Quebec; formerly Public Health Laboratory of                  2. Dudas G, Carvalho LM, Bedford T, Tatem AJ, Baele G, Faria NR, Park DJ,
Canada) for supply of ZMAb.                                                                      Ladner JT, Arias A, Asogun D, et al. Virus genomes reveal factors that spread
                                                                                                 and sustained the Ebola epidemic. Nature. 2017;544(7650):309–15.
                                                                                             3. Mbala-Kingebeni P, Pratt CB, Wiley MR, Diagne MM, Makiala-Mandanda S,
Authors’ contributions
                                                                                                 Aziza A, Di Paola N, Chitty JA, Diop M, Ayouba A, et al. 2018 Ebola virus
Conceptualization: A.B., E.T., M.W.C and J.A.H. Formal analysis: X.D., N.Y.R., A.B.,
                                                                                                 disease outbreak in Equateur Province, Democratic Republic of the Congo:
D.A.M., M.J., T.F., L.F.P.N., E.T., I.G.-D., M.W.C and J.A.H. Funding acquisition: E.T.,
                                                                                                 a retrospective genomic characterisation. Lancet Infect Dis. 2019;19:641–7.
M.W.C and J.A.H. Investigation: A.B., E.T., M.J., N.Y.R. and X.D. Resources: A.B.,
                                                                                             4. Carroll MW, Matthews DA, Hiscox JA, Elmore MJ, Pollakis G, Rambaut A,
E.T. and M.J. Software: X.D., N.Y.R. and D.A.M. Supervision: M.W.C, L.F.P.N. and
                                                                                                 Hewson R, Garcia-Dorival I, Bore JA, Koundouno R, et al. Temporal and
J.A.H. Validation: X.D., N.Y.R., A.B., I.G.-D., D.A.M., T.F. and E.T. Visualisation: X.D.,
                                                                                                 spatial analysis of the 2014-2015 Ebola virus outbreak in West Africa. Nature.
N.Y.R., A.B. and J.A.H. Writing—original draft preparation: A.B., N.Y.R. and J.A.H.
                                                                                                 2015;524(7563):97–101.
Writing—review and editing: M.J., X.D., D.A.M., T.F., L.F.P.N., E.T., M.W.C. and
                                                                                             5. Kerber R, Krumkamp R, Diallo B, Jaeger A, Rudolf M, Lanini S, Bore JA,
J.A.H. All authors read and approved the final manuscript.
                                                                                                 Koundouno FR, Becker-Ziaja B, Fleischmann E, et al. Analysis of diagnostic
                                                                                                 findings from the European Mobile Laboratory in Gueckedou, Guinea,
Funding                                                                                          March 2014 through March 2015. J Infect Dis. 2016;214(suppl 3):S250–7.
The research was funded by the National Institute for Health Research Health                 6. Liu X, Speranza E, Munoz-Fontela C, Haldenby S, Rickett NY, Garcia-Dorival I,
Protection Research Unit (NIHR HPRU) in Emerging and Zoonotic Infections                         Fang Y, Hall Y, Zekeng EG, Ludtke A, et al. Transcriptomic signatures
at the University of Liverpool in partnership with Public Health England (PHE)                   differentiate survival from fatal outcomes in humans infected with Ebola
and Liverpool School of Tropical Medicine (LSTM), which directly supported                       virus. Genome Biol. 2017;18(1):4.
the PhD studentships of A.B. and N.Y.R. and a fellowship for N.Y.R. The work                 7. Eisfeld AJ, Halfmann PJ, Wendler JP, Kyle JE, Burnum-Johnson KE, Peralta Z,
was also funded by the Food and Drug Administration (USA) to J.A.H and                           Maemura T, Walters KB, Watanabe T, Fukuyama S, et al. Multi-platform
M.W.C. number HHSF223201510104C and assessing animal models for MCM                              ‘Omics analysis of human Ebola virus disease pathogenesis. Cell Host
development, number HHSF223201710194C, and directly supported X.D and                            Microbe. 2017;22(6):817–29 e818.
I.G.-D. E.T. is funded by a Wellcome Trust clinical intermediate fellowship                  8. Carroll MW, Haldenby S, Rickett NY, Palyi B, Garcia-Dorival I, Liu X, Barker G,
(102789/Z/13/A) and core funding from the Medical Research Council                               Bore JA, Koundouno FR, Williamson ED, et al. Deep sequencing of RNA
(MC_UU_12014/1).                                                                                 from blood and oral swab samples reveals the presence of nucleic acid
You can also read