ALS-associated genes in SCA2 mouse spinal cord transcriptomes
←
→
Page content transcription
If your browser does not render page correctly, please read the page content below
Human Molecular Genetics, 2020, Vol. 29, No. 10           1658–1672

                                                                              doi: 10.1093/hmg/ddaa072
                                                                              Advance Access Publication Date: 20 April 2020
                                                                              General Article

GENERAL ARTICLE

ALS-associated genes in SCA2 mouse spinal cord

                                                                                                                                                        Downloaded from https://academic.oup.com/hmg/article-abstract/29/10/1658/5822587 by guest on 01 July 2020
transcriptomes
Daniel R. Scoles1,*, Warunee Dansithong1 , Lance T. Pflieger1,2 , Sharan Paul1 ,
Mandi Gandelman1 , Karla P. Figueroa1 , Frank Rigo3 , C. Frank Bennett3 and
Stefan M. Pulst1
1 Department of Neurology, University of Utah, 175 North Medical Drive East, 5th Floor, Salt Lake City, UT 84132,
USA, 2 Department of Biomedical Informatics, University of Utah, 421 Wakara Way, Salt Lake City, UT 84108,
USA and 3 Ionis Pharmaceuticals, 2855 Gazelle Court, Carlsbad, CA 92010, USA

*To whom correspondence should be addressed. Tel: +801-585-0694; Email: daniel.scoles@hsc.utah.edu

Abstract
The spinocerebellar ataxia type 2 (SCA2) gene ATXN2 has a prominent role in the pathogenesis and treatment of
amyotrophic lateral sclerosis (ALS). In addition to cerebellar ataxia, motor neuron disease is often seen in SCA2, and ATXN2
CAG repeat expansions in the long normal range increase ALS risk. Also, lowering ATXN2 expression in TDP-43 ALS mice
prolongs their survival. Here we investigated the ATXN2 relationship with motor neuron dysfunction in vivo by comparing
spinal cord (SC) transcriptomes reported from TDP-43 and SOD1 ALS mice and ALS patients with those from SCA2 mice. SC
transcriptomes were determined using an SCA2 bacterial artificial chromosome mouse model expressing polyglutamine
expanded ATXN2. SCA2 cerebellar transcriptomes were also determined, and we also investigated the modification of gene
expression following treatment of SCA2 mice with an antisense oligonucleotide (ASO) lowering ATXN2 expression.
Differentially expressed genes (DEGs) defined three interconnected pathways (innate immunity, fatty acid biosynthesis and
cholesterol biosynthesis) in separate modules identified by weighted gene co-expression network analysis. Other key
pathways included the complement system and lysosome/phagosome pathways. Of all DEGs in SC, 12.6% were also
dysregulated in the cerebellum. Treatment of mice with an ATXN2 ASO also modified innate immunity, the complement
system and lysosome/phagosome pathways. This study provides new insights into the underlying molecular basis of SCA2
SC phenotypes and demonstrates annotated pathways shared with TDP-43 and SOD1 ALS mice and ALS patients. It also
emphasizes the importance of ATXN2 in motor neuron degeneration and confirms ATXN2 as a therapeutic target.

Introduction                                                                  therapeutic targets or determinative biomarkers. A systems bio-
Modeling of human neurological diseases in animals has revo-                  logical approach allows comparisons between new models and
lutionized our understanding of pathogenesis and altered path-                strengthens predictions for therapeutic pathways. The principal
ways. RNA transcriptomes from amyotrophic lateral sclerosis                   objective of this study was to examine the effects of mutant
(ALS) models are powerful predictive tools for determining new                ATXN2 on genome-wide expression of spinal cord (SC) genes

Received: February 2, 2020. Revised: April 7, 2020. Accepted: April 9, 2020
© The Author(s) 2020. Published by Oxford University Press.
This is an Open Access article distributed under the terms of the Creative Commons Attribution License (http://creativecommons.org/licenses/by/4.0/),
which permits unrestricted reuse, distribution, and reproduction in any medium, provided the original work is properly cited.

                                                                                                                                               1658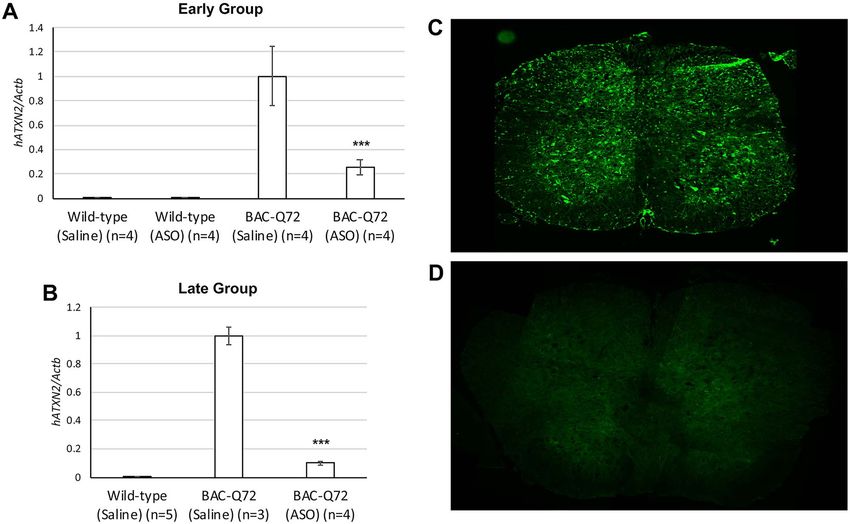
Human Molecular Genetics, 2020, Vol. 29, No. 10          1659

and integrate changes into a framework of previously described           performed using two mouse age groups, designated ‘early’ and
transcriptomic changes in ALS models.                                    ‘late’, referring to age at treatment. Doses averaged 7 g ASO7
    Spinocerebellar ataxia type 2 (SCA2) is a dominantly inher-          per gram of mouse weight (7 mg/kg) in both treatment groups.
ited rare polyglutamine disease caused by a CAG repeat expan-            For the early treatment group, BAC-Q72 or wild-type littermate
sion in the ataxin-2 (ATXN2) gene (1). The SCA2 phenotype                mice were treated ICV at 8 weeks of age with 175 g of ATXN2
includes slow saccadic eye movements and ataxic gait, resulting          ASO7 or normal saline, and cerebellar and SC transcriptomes
from progressive failure of cerebellar Purkinje cells, and atrophy       were determined at 19 weeks of age. Mice in the early treatment
of other neuronal structures including the pons. SCA2 is charac-         group were the same as used in our previous study (7). For the
terized by anticipation where the length of the ATXN2 repeat is          late treatment group, BAC-Q72 or wild-type littermate mice were
closely tied to disease onset and severity. Unaffected individuals       treated ICV at 29 weeks of age with 210 g of ATXN2 ASO7
typically have 22 CAGs in ATXN2, while repeat lengths ≥33 cause          or normal saline, and cerebellar and SC transcriptomes were
SCA2. Earlier age of onset and greater disease severity are associ-      determined at 35 weeks of age. A summary of all mice used
ated with longer CAG repeat expansions which can increase gen-           in the study, treatment doses and times and group n values is

                                                                                                                                                  Downloaded from https://academic.oup.com/hmg/article-abstract/29/10/1658/5822587 by guest on 01 July 2020
erationally (2). In addition to Mendelian alleles, alleles at the long   provided in Table 1.
normal range (>30 repeats) are associated with an increased risk
for ALS (3–5). The molecular and genetic association between
                                                                         SCA2 mouse SC transcriptome analyses
ATXN2 and ALS may explain the phenotypic overlap observed
in SCA2 patients with motor phenotypes characteristically seen           Initial analyses characterized DEGs between BAC-Q72 and wild-
in ALS (6).                                                              type SCs from untreated (no saline injection) 19-week-old
    While there are no disease-modifying treatments for SCA2,            mice, then in early and late treated mice groups separately
preclinical data using ATXN2 antisense oligonucleotide (ASO)             and in the pooled group (early pooled with late) of treated
therapeutics are promising. SCA2 is characterized by a gain              mice. Throughout the study, DEGs were defined as those with
of toxic function for the polyglutamine expanded ATXN2 pro-              AdjP < 0.05 and a |log2(FC)| ≥ 0.585 (1.5-fold change) (trans-
tein. We showed that lowering the overall expression of ATXN2            genic versus wild-type or transgenic ASO versus transgenic
restored phenotypes in two SCA2 mouse models (7). SCA2 mice              saline). Some DEGs, however, are falling outside of the fold
treated at 8 weeks of age by intracerebroventricular (ICV) injec-        change cutoff but with significant biological relevance are also
tion of an ASO targeting ATXN2 expression had improved motor,            discussed.
molecular and neurophysiological phenotypes (7).                             Transcriptome analysis revealed 389 DEGs in SC of the
    The importance of ATXN2, however, extends beyond SCA2                untreated BAC-Q72 mice versus wild-type, 468 DEGs in the early
and cerebellar neurons. ATXN2 interacts in an RNA-dependent              treated group (BAC-Q72 versus wild-type treated with saline)
manner with TDP-43, a protein mutated or misfolded in ALS                and 692 DEGs in the late group (BAC-Q72 versus wild-type
patients. The Gitler Lab showed that the reduction of wild-type          treated with saline) (Fig. 1A). Of the 389 DEGs in the untreated
Atxn2 expression in TDP-43 ALS mice either genetically or by an          group (BAC-Q72 versus wild-type), 64% (289) were also found
ASO significantly improved mouse survival (8). ATXN2 interme-            in the early and/or the late treatment groups, and 41% (161)
diate CAG repeat expansions also increase cytoplasmic protein            were shared with the early and late groups when analyzed
aggregates and motor neuron (MN) dysfunction and death in                as a single pooled group (Fig. 1B). Ranked by AdjP, the top
C9ORF72 ALS patients (9), and frontotemporal dementia (FTD)              10 DEGs in the early group (Il33, Ndrg2, Glul, Car2, Lrig1, Agt,
phenotypes in C9ORF72 ALS patients are modified by intermedi-            Serpinb1a, Col9a2, Tthy1, Atp1a2) were also among the top 19
ated expansions in ATXN2 (10). These observations place ATXN2            DEGs of the late group; all were reduced in expression except
centrally in focus as a potential therapeutic target for ALS as well     Col9a2 (Supplementary Material, Tables S1–S3). Among the top
as FTD.                                                                  10 saline-treated early group genes, 5 were among the top 10
    Despite presence of an ALS-like phenotype in some SCA2               DEGs in the untreated mouse group (Il33, Col9a2, Serpinb1a, Agt,
patients, little is known about ATXN2 function in the SC apart           Car2). The 286 DEGs shared between both the early and late
from mutant ATXN2 mislocalization in motor neurons in TDP-               treatment groups represented 61% of the early group DEGs and
43 mice (3). Likewise, there have been few studies describing            41% of the late group DEGs (Fig. 1A and B).
the expression of genes in the ALS SC (11,12). We therefore per-             The substantial similarity between the top DEGs in the early
formed transcriptomic analyses using SCA2 bacterial artificial           and late groups supported pooling the datasets. After pool-
chromosome (BAC) mice expressing ATXN2 with 72 glutamines                ing, we observed a total of 979 DEGs in SC using the criterion
driven by a native human ATXN2 promoter. Analyses included               of AdjP < 0.05, |log2(FC)| ≥ 0.585, and 161 were shared with the
comparisons before and after treatment with ATXN2 ASO and                untreated group (Fig. 1A and B). The top 10 DEGs in the pooled
between SC and cerebellum (CB). Differentially expressed genes           group had considerable overlap with the top DEGs in each of
(DEGs) in SCA2 SCs included abnormally expressed genes in SCs            the untreated group, early group and late group, including Il33,
of ALS patients that may represent therapeutic targets for ALS           Agt, Glul, Ndrg2, Lrig1, Ttyh1, Atp1a2, Car2, Serpinb1a and S1pr1, all
and some that have potential as ALS or SCA2 biomarkers.                  reduced in expression (Supplementary Material, Table S4).

                                                                         SCA2 SC genes analyzed by weighted gene
Results                                                                  co-expression network analysis
SCA2 mice                                                                We performed weighted gene co-expression network analysis
Both untreated and ATXN2 ASO7-treated BAC-Q72 mice and                   (WGCNA) to identify relevant gene clusters (co-expression mod-
wild-type littermates were used in the study. BAC-Q72 mice               ules) with associated functional pathways, represented by hub
and ASO7 were described previously (7). The untreated group              gene functional drivers (13). Because of the similarity of the top
for which no surgery was performed included 19-week-old                  DEGs between the early and late SC groups, we chose to perform
BAC-Q72 mice and wild-type littermates. ASO7 treatments were             a WGCNA analysis using only the dataset resulting from pooling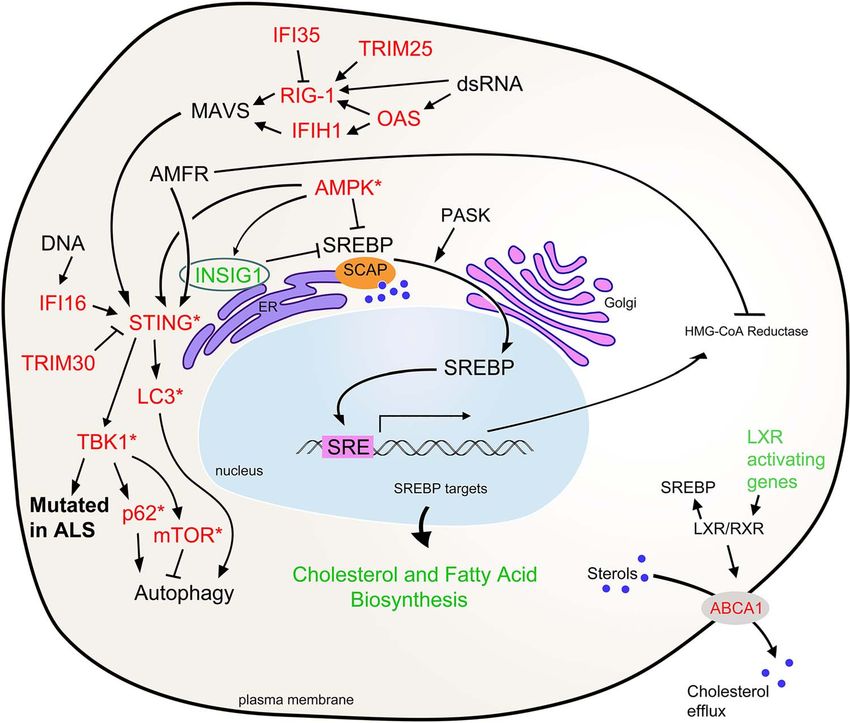
1660 Human Molecular Genetics, 2020, Vol. 29, No. 10
Table 1. BAC-ATXN2-Q72 mouse groups, ASO treatments and group n
Name ASO dose Treatment Age at Treatment Untreated mice Treated mice
(7 mg/kg) start sacrifice time
WT TG WT-SAL WT-ASO TG-SAL TG-ASO
Untreated − − 19 weeks − 4 4 − − − −
Early 175 μg 8 weeks 19 weeks 10 weeks − − 4 4 4 4
Late 210 μg 29 weeks 34 weeks 5 weeks − − 5 0 3 4
Pooled 175–210 μg 8–29 weeks 19–34 5–10 − − 9 4 7 8
weeks weeks
Downloaded from https://academic.oup.com/hmg/article-abstract/29/10/1658/5822587 by guest on 01 July 2020
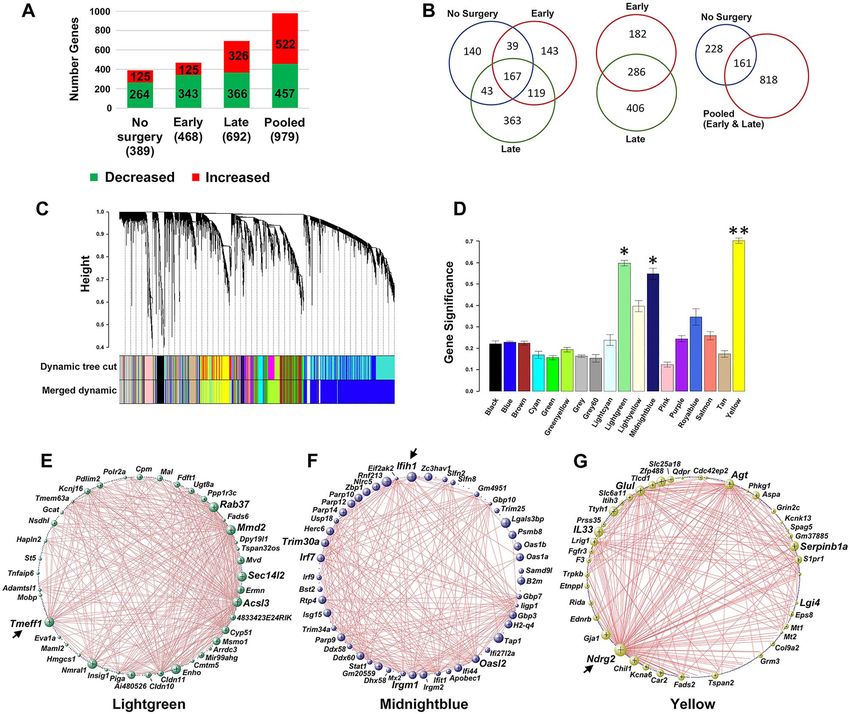
Figure 1. BAC-Q72 SC expression profiles and gene co-expression modules for the pooled dataset. (A) Numbers of upregulated or downregulated DEGs in each group
and in the pooled set of genes. (B) Number of shared DEGs for the untreated group (no surgery), early and late groups. Of all the DEGs in the untreated group, 64% were
shared with the combined set of early and late group DEGs, and of all the early and late group DEGs, 32.7% were shared. (C) Identification of co-expression modules.
Dynamic tree cut analysis gave rise to 18 modules. (D) GS per module. The lightgreen, midnightblue and yellow modules were significant (∗ ,P < 0.05; ∗∗ , P < 0.01). (EG)
Topological representations of the co-expression networks for the significant modules. The top 40–48 hub genes are shown. Bubble size is proportional to the number
of connections. Arrows indicate the top hub gene in each module.
the early and late groups. Application of hierarchical clustering list of gene module membership is in Supplementary Material,
and dynamic tree cut analysis to the pooled dataset produced Table S5. Network topology analyses for the top 40–48 hub genes
18 modules with 3 that were significant including lightgreen are provided illustrating intramodule connectivity (Fig. 1E–G).
(P < 0.05, 488 genes), midnightblue (P < 0.05, 148 genes) and yel- Validations determined by qPCR were made for the top 2 or 3
low (P < 0.01, 795 genes) (Fig. 1C and D). Table 2 presents the top genes in the lightgreen, midnightblue and yellow modules and
10 DEGs in each of these significant modules. The complete other selected DEGs (Fig. 2).Human Molecular Genetics, 2020, Vol. 29, No. 10 1661
Table 2. Top 10 SC hub genes for the significant modules for BAC-ATXN2-Q72 versus wild-type and Log2 (FC), ranked by scaled-within values
starting with the most interconnected gene (scaled-within = 1)
Lightgreen Midnightblue Yellow
Gene Log2(FC) Gene Log2(FC) Gene Log2(FC)
Tmeff1 −0.99 Ifih1 0.78 Ndrg2 −1.3
Rab37 −1.5 Trim30a 0.53 Glul −1.4
Acsl3 −1.01 Oasl2 0.60 Il33 −2.3
Mmd2 −1.1 Irf7 0.77 Serpinb1a −2.3
Sec14l2 −0.70 Irgm1 0.64 Agt −2.8
Nmral1 −0.99 Rtp4 1.1 S1pr1 −1.1
Enho −1.1 Parp9 0.81 Chil1 −1.6
Ermn −0.99 Herc6 0.56 Gja1 −1.3
Downloaded from https://academic.oup.com/hmg/article-abstract/29/10/1658/5822587 by guest on 01 July 2020
Cyp51 −1.3 Ifit1 0.60 Lrig1 −1.1
Mvd −0.93 Gbp3 0.82 Zfp488 2.1
Figure 2. Validation of expression between BAC-Q72 mice and wild-type littermates for the top 2–4 hub genes identified in the lightgreen (A), midnightblue (B) and
yellow (C) modules and selected other DEGs determined by qPCR. (D) Validation for Pcp4, an ALS-related gene, which was not assigned to a module by WGCNA. Values
shown are means and SD. All individual wild-type versus BAC-Q72 comparisons were significant at P < 0.01. n = 5 and 3 mice for the wild-type and BAC-Q72 groups,
respectively (A). n = 5 and 3 mice for all wild-type and BAC-Q72 groups, respectively, except for Ddx58 for which n = 6 mice per group (B). n = 6 mice per group (C and D).
Probabilities were determined from unpaired two-tailed Student’s t-tests: ∗∗ , P < 0.01; ∗∗∗ , P < 0.001.
Pathway analyses Several significant pathways were annotated for the
untreated mouse group (BAC-Q72 versus wild-type). The top
We performed pathway analyses by three different methods,
including Gene Ontology Enrichment Analysis (GO), Kyoto Ency- pathways and their DEGs included glial cell growth, neuron
clopedia of Genes and Genomes (KEGG) analysis and Ingenu- ensheathment, fatty acid synthesis, cholesterol metabolism,
ity Pathway Analysis (IPA). For each of the analyses, the three herpes simplex, interferon signaling, hepatic stellate cell
approaches are largely agreed. The top pathways for untreated activation, LXR/RXR signaling and Th1/Th2 immune response
mice, treated mice in the pooled dataset and the three significant signaling. Transgenic mice in the pooled group that were treated
modules are shown in Table 3, with complete lists in Supple- with saline had pathways in lipid metabolic processes and
mentary Material, Table S6 and a short list in Supplementary steroid/cholesterol biosynthesis most significant and hepatic
Material, Table S7. stellate cell activation like for the untreated mouse group.Table 3. Top annotated GO, KEGG and IPA pathways in the SC of BAC-ATXN2-Q72 mice versus wild-type and −log10 (P-value) for the indicated comparisons. Benjamini probabilities corrected for
1662
multiple pairwise comparisons were calculated for GO and KEGG terms (if significance was not achieved, uncorrected probabilities are shown, indicated by asterisks)
GO KEGG IPA
TG versus WT (untreated)
Glial cell development 5.41 Cholesterol metabolism 3.16 Hepatic fibrosis/hepatic stellate cell activation 5.19
Glial cell differentiation 5.19 Herpes simplex infection 1.65 Interferon signaling 4.74
Ensheathment of neurons 4.57 LXR/RXR activation 4.68
Axon ensheathment 4.57 Th2 pathway 3.99
Gliogenesis 4.57 Th1 and Th2 activation pathway 3.88
Fatty acid biosynthetic process 4.57
TG-SAL versus WT-SAL
Lipid metabolic process 9.02 Steroid biosynthesis 2.07 Superpathway of cholesterol biosynthesis 9.19
Fatty acid biosynthetic process 5.97 Fatty acid metabolism 1.98 Cholesterol biosynthesis I 7.20
Sterol biosynthetic process 4.82 Biosynthesis of unsaturated fatty acids 1.89 Cholesterol biosynthesis II (via 7.20
24,25-dihydrolanosterol)
Steroid metabolic process 3.63 Biosynthesis of antibiotics 1.85 Cholesterol biosynthesis III (via desmosterol) 7.20
Unsaturated fatty acid biosynthetic process 2.65 Hepatic fibrosis/hepatic stellate cell activation 4.93
Human Molecular Genetics, 2020, Vol. 29, No. 10
Yellow module
Ion transport 4.29∗ Biosynthesis of unsaturated fatty acids 3.12∗ Tryptophan degradation X (mammalian via 3.75
tryptamine)
Fatty acid biosynthetic process 3.94∗ Nitrogen metabolism 2.99∗ Putrescine degradation III 2.85
Aging 3.80∗ Chemical carcinogenesis 2.41∗ Th2 pathway 2.76
Adult locomotory behavior 3.42∗ Neuroactive ligand–receptor interaction 2.25∗ Oleate biosynthesis II (animals) 2.60
Unsaturated fatty acid biosynthetic process 3.33∗ Metabolism of xenobiotics by cytochrome 2.08∗ Hepatic fibrosis/hepatic stellate cell activation 2.56
P450
Lightgreen module
Sterol biosynthetic process 5.39 Steroid biosynthesis 3.07 Superpathway of cholesterol biosynthesis 10.50
Lipid metabolic process 2.74 Biosynthesis of antibiotics 1.92 Cholesterol biosynthesis I 8.31
Cholesterol biosynthetic process 2.73 Neuroactive ligand–receptor interaction 1.80 Cholesterol biosynthesis II (via 8.31
24,25-dihydrolanosterol)
Steroid metabolic process 2.63 Cholesterol biosynthesis III (via desmosterol) 8.31
Steroid biosynthetic process 2.18 Zymosterol biosynthesis 4.46
Midnightblue module
Defense response to virus 26.81 Herpes simplex infection 7.49 Interferon signaling 13.20
Immune system process 22.69 Inf luenza A 6.49 Activation of IRF by cytosolic pattern 12.40
recognition receptors
Innate immune response 19.78 Measles 6.51 Antigen presentation pathway 7.63
Response to virus 17.48 Hepatitis C 5.47 Role of RIG1-like receptors in antiviral innate 5.70
immunity
Cellular response to interferon-beta 17.16 RIG-I-like receptor signaling pathway 2.94 Role of pattern recognition receptors in 5.40
recognition of bacteria and viruses
Downloaded from https://academic.oup.com/hmg/article-abstract/29/10/1658/5822587 by guest on 01 July 2020Human Molecular Genetics, 2020, Vol. 29, No. 10 1663
Table 4. Significant DEGs in the SC of BAC-ATXN2-Q72 mice treated list of these DEGs including log2(FC) and AdjP values is pro-
with ASO7 versus saline, ranked by significance vided in Table 4. Pathway analysis showed that ASO7 treatment
Gene Log2(FC) AdjP Footnote modified innate immunity and defense pathways, LXR/RXR and
FXR/RXR activation and phagosome or lysosomal maturation
Ctss 0.74 0.0000075 2 (Table 5; Supplementary Material, Table S7). ASO7 treatment
Mmp12 1.4 0.000011 reversed the direction of dysregulation (different log2(FC) sign)
Gpnmb 1.3 0.000038 in 16 of 57 significantly different genes. These 16 genes are Fyco1,
C1qa 0.69 0.00012 1 D1Ertd622e, Tsc22d4, Gpt, Steap1, Lgmn, Tst, Pfdn4, C3, Gm6166,
Trem2 0.74 0.00018 1,3 Clic6, Pcdhga4, Tbcd, Wdr53, Slc8a3 and Arrdc3, ranked in order
Cd300c2 0.74 0.00018 of AdjP for the ASO7 versus saline comparison (Supplementary
Mpeg1 0.82 0.00024
Material, Table S8).
Hvcn1 0.79 0.00053
As ASO treatments may activate innate immunity pathways,
C4b 0.67 0.0013 1,3,4
we also compared wild-type mice treated with ASO7 versus wild-
Gm23969 1.1 0.0026
Downloaded from https://academic.oup.com/hmg/article-abstract/29/10/1658/5822587 by guest on 01 July 2020
type mice treated with saline and observed only six DEGs using
Tyrobp 0.60 0.0097 1
the criterion of AdjP1664 Human Molecular Genetics, 2020, Vol. 29, No. 10
Downloaded from https://academic.oup.com/hmg/article-abstract/29/10/1658/5822587 by guest on 01 July 2020
Figure 3. ASO7 uptake and reduction of ATXN2 in SCA2 mouse SC. (A and B) Validation of ASO7 inhibition of ATXN2 in SC of BAC-Q72 by qPCR for both the early (A)
and late (B) groups. Values shown are means ± SD. (C and D) Anti-ASO antibody labeling in SCA2 mouse thoracic SC following ASO7 injection (C) and saline injection
(D), determined by immunofluorescent labeling. Probabilities were determined from unpaired two-tailed Student’s t-tests between the BAC-Q72 saline groups and the
BAC-Q72 ASO groups: ∗∗∗ , P < 0.001.
Table 5. All significant GO, KEGG and IPA pathways in the SC of ASO7-treated BAC-ATXN2-Q72 mice versus saline and −log10 (P-value). Benjamini
probabilities corrected for multiple pairwise comparisons are shown for GO and KEGG terms
GO KEGG IPA
Innate immune 4.66 Staphylococcus aureus infection 1.87 Complement system 5.21
response
Tuberculosis 1.85 LXR/RXR activation 3.66
Complement and coagulation 1.73 FXR/RXR activation 3.61
cascades
Pertussis 1.66 Role of pattern recognition 3.50
receptors in recognition of
bacteria and viruses
Phagosome 1.56 Acute phase response 3.23
signaling
Lysosome 1.41 Dendritic cell maturation 3.07
Systemic lupus erythematosus 1.32 Crosstalk between dendritic 2.47
cells and natural killer cells
Phagosome maturation 2.04
annotations including genes functioning in innate immunity, Table S11). The relatively low overlap likely reflects a dispar-
while cholesterol biosynthesis, characterizing the SC lightgreen ity in mouse ages (8 weeks in the previous study), yet path-
module, was also represented by IPA (Table 6). A table of DEGs way analyses demonstrated shared annotations, including many
in the CB is provided in Supplementary Material, Table S10, and innate immunity genes at the top of the KEGG and GO lists
a list of overlapping genes with a graphic representation of the (Supplementary Material, Table S11).
AdjP values is provided in Supplementary Material, Figure S1.
The output from pathway analyses is provided in Supplementary
Material, Table S6. Of the cerebellar DEGs in our previous study
Novel biomarker predictions
(14) defined by the same criteria used in this study (AdjPHuman Molecular Genetics, 2020, Vol. 29, No. 10 1665
Downloaded from https://academic.oup.com/hmg/article-abstract/29/10/1658/5822587 by guest on 01 July 2020
Figure 4. Restoration of selected genes in SC of BAC-Q72 mice with ASO7 treatment. (A) Effect of ASO7 on Fyco1, C3 and Cyp51a1. Expression determined by qPCR
relative to Gapdh. Reduced expression of C3 is significantly increased by ASO7, while increased expression of FycoI is significantly decreased by ASO7. Reduced Cyp51a1
expression was not improved by ASO7. (B) Effect of ASO7 on the expression of Eaat2 (Slc1a2), Pcp4, Ifih1, Trim30, p-Ampk, Sting, Cyp51a1, Tbk1, mTor, p62 and Lc3
determined by western blotting. (C) Densitometric quantifications of western blots (n = 3–5 mice). Bonferroni corrected Student’s t-tests. NS, not significant; ∗ , P < 0.05;
∗∗ , P < 0.01; ∗∗∗ , P < 0.001.
www.proteinatlas.org) (15). A complete list is presented in Sup- and ALS and to reveal pathways and targets that might be
plementary Material, Table S12. exploited therapeutically.
Discussion ALS-associated genes
We developed a systems approach to understand the SC pathol- The SCA2 mouse SC transcriptome reflects the ALS transcrip-
ogy related to mutant ATXN2, enabled by ATXN2 expression in tome at multiple levels. Several DEGs found in two human ALS
the SC of SCA2 BAC-Q72 mice. In addition to cerebellar disease, SC transcriptome studies also appeared in this study (Supple-
lower motor neuron dysfunction is detected in 12% of SCA2 cases mentary Material, Fig. S1), including DEGs in innate immunity,
(16). The objective of this study was to use this mouse model LXR and lipid metabolism pathways (11,12). In a comprehensive
to understand genome-wide expression changes in the SC. review of ALS literature (17), 10 genes (Supplementary Material,
We also determined those networks responsive to ATXN2 ASO Table S7) were linked to the progression of ALS, among which
treatment to further delineate mechanisms underlying SCA2 were 3 (Slc14a1, Pcp4 and Aqp4) that were also DEGs in SCA21666 Human Molecular Genetics, 2020, Vol. 29, No. 10
Table 6. Top annotated GO, KEGG and IPA pathways in the CB of BAC-ATXN2-Q72 mice versus wild-type, and shared between CB and SC, and
-log10 (P-value). Benjamini probabilities corrected for multiple pairwise comparisons were calculated for GO and KEGG terms
GO KEGG IPA
CB: TG versus WT
Immune system process 11.83 Viral myocarditis 2.12 Interferon signaling 4.97
Defense response to virus 9.48 Measles 1.98 Antigen presentation pathway 4.79
Response to virus 5.75 Herpes simplex infection 1.97 Role of pattern recognition receptors in 4.68
recognition of bacteria and viruses
Cellular response to 5.44 Cell adhesion molecules (CAMs) 1.94 Virus entry via endocytic pathways 4.16
interferon-beta
Innate immune response 4.92 Inf luenza A 1.31 Glutamate receptor signaling 3.48
Negative regulation of viral 3.52 Th2 pathway 3.13
genome replication
Downloaded from https://academic.oup.com/hmg/article-abstract/29/10/1658/5822587 by guest on 01 July 2020
Cell adhesion 3.40 Complement system 3.07
Ion transport 2.32 Caveolar-mediated endocytosis signaling 2.83
SC CB shared
Defense response to virus 8.44 Measles 2.58 Role of pattern recognition receptors in 4.67
recognition of bacteria and viruses
Immune system process 4.45 Hepatitis C 2.34 Interferon signaling 3.63
Response to virus 4.38 Inf luenza A 2.28 Role of RIG1-like receptors in antiviral innate 3.29
immunity
Innate immune response 2.90 Herpes simplex infection 2.16 Neuroprotective role of THOP1 in Alzheimer’s 3.28
disease
Cellular response to 2.14 Hepatic fibrosis/hepatic stellate cell activation 2.97
interferon-beta
Superpathway of cholesterol biosynthesis 2.78
Retinoic acid mediated apoptosis signaling 2.73
Activation of IRF by cytosolic pattern 2.7
recognition receptors
Acute phase response signaling 2.49
LXR/RXR activation 2.44
Antigen presentation pathway 2.4
mouse SC. Mouse studies supported our findings as well: tran- in CB. Like PARP-1/PARP-2, PARP-12 and PARP-14 have roles in
scriptome analysis of SC tissues from TDP-43 transgenic mice stress granule (SG) assembly (23).
(18) identified 30 DEGs among which 5 (Serpina3n, Cst3, Nefl, Nefh,
Scd1) were also DEGs in SC of SCA2 mice. Despite that SOD1 mice
lack TDP-43 proteinopathy, we also compared DEGs in SCA2 and Three pathways converging at the endoplasmic
SOD1 mice. A total of 9 DEGs overlapped with the 52 found in reticulum
SC of presymptomatic SOD1 mice (19) and another subset of 9 An exciting finding in this study is the elevated expression
DEGs with the 126 genes in the ALS Online Database (ALSoD) of numerous genes in the innate immunity pathway regulated
(20) (Supplementary Material, Table S7). by STING and the mostly downregulated genes controlled by
Since glutamate toxicity is a hallmark of ALS, we found SREBP in SCA2 mouse SC that regulate cholesterol and fatty
it notable that various glutamate transporters and receptors acid biosynthesis. Consistent with this, we found that Ampk
were significantly reduced in SCA2 mouse SC. Genes included which is an activator of STING and inhibitor of SREBP was
Grm3 encoding metabotropic glutamate receptor 3, Grin2c encod- highly activated in SCA2 SC. Many genes in these interconnected
ing glutamate ionotropic receptor NMDA type subunit 2C, Glul pathways were observed previously in human ALS SC, discussed
encoding glutamine synthetase and Slc1a2 encoding the glial in the following paragraphs. An illustration of these pathways
excitatory amino acid transporter 2 (EAAT2) required for synap- with indication of the relevant DEGs and proteins is provided in
tic glutamate reuptake. Also, the regulator of G protein signaling Figure 5.
8 gene Rgs8 was abnormally reduced in SCA2 mouse CB (this Innate Immunity. The midnightblue module was characterized
study and previously (14)), consistent with our observation of by upregulated DEGs functioning in innate immunity, many
enhanced mGluR1-mediated excitatory postsynaptic currents of which are shared with human ALS (11,12). Among these
(EPSCs) and elevated calcium in SCA2 Purkinje neurons (21). were the retinoic acid-inducible gene 1 (RIG-1)-like receptors
Rgs1, Rgs4 and Rgs16 were also differentially expressed in SCA2 (RLRs) Ddx58 and Ifih1. Ddx58 encodes RIG-1 and Ifih1 encodes
mouse SC. melanoma differentiation-associated protein 5 (MDA5) and
Poly(ADP-ribose) polymerases (PARPs) are associated with was the top midnightblue hub gene. RIG-1 and MDA5 function
ALS-related accumulation of TDP-43, and targeting PARP- together with mammalian 2 -5 -oligoadenylate synthase (OAS)
1/PARP-2 with small molecules resulted in normalization of TDP- genes, of which we observed four upregulated in SC and seven
43 aggregates in a fly model of ALS (22). We found multiple PARPs in CB (Supplementary Material, Table S7). RLRs and OASs are
significantly increased in the SCA2 mouse transcriptomes, activated by dsRNAs that can originate by various causes (24–26)
including PARPs 4, 8, 9, 12 and 14 in SC and 9, 10, 12 and 14 including activation of regulated IRE1-dependent decay (RIDD)Human Molecular Genetics, 2020, Vol. 29, No. 10 1667
Downloaded from https://academic.oup.com/hmg/article-abstract/29/10/1658/5822587 by guest on 01 July 2020
Figure 5. Highly interconnected pathways altered in SCA2 mouse SC transcriptome converge at the ER. Regulation of the innate immunity pathway by STING and
the cholesterol and fatty acid biosynthesis pathways by SREBP is dependent on INSIG1 and polyubiquitination by AMFR anchoring STING to the ER membrane. Innate
immunity can be activated by dsRNAs produced by ER stress and activation of the RIDD pathway or DNAs from damaged mitochondria. STING activation can directly
modify LC3 and can activate TBK1, p62 and mTOR to regulate autophagy. INSIG1 anchors SCAP and SREBP to the ER when sterols are abundant. When sterols are
low, SCAP and SERBP translocate to the Golgi via COPII vesicles in a PASK-dependent manner where SREBP is processed and then its bHLH domain fragment is
translocated to the nucleus to activate cholesterol and fatty acid biosynthesis genes. Among these are HMG-CoA reductase which catalyzes the rate limiting step
in cholesterol biosynthesis, is the target of statins and is inhibited by AMFR polyubiquitination. We also observed genes activating LXR pathways reduced in SCA2
mouse SC transcriptomes. Finally, Ampk is activated in SCA2 mouse SC, which inhibits SREBP and activates STING. Green represents genes downregulated and red
upregulated in SCA2. Asterisks indicate upregulated proteins from nonsignificant DEGs.
following endoplasmic reticulum (ER) stress (27,28). Down- of autophagy following innate immunity activation has been
stream, RLRs and MDA5 activate MAVS on the mitochondrial observed previously and involves STING-LC3 direct interaction
membrane, leading to STING activation at the ER (29,30). The but can also be TBK1-dependent (38–40) (Fig. 5). In addition, the
activation of STING requires it to be polyubiquitinated by AMFR most downregulated DEG, Il33, in our analysis is neuroprotective
(GP78) to anchor it on the ER membrane and is dependent against disease-related autophagy (41,42).
on INSIG1 (31) that was downregulated in SCA2 mouse Fatty acid biosynthesis: Fatty acid synthesis was an annotated
SC. STING activation leads to TBK1 activation of interferon pathway of our yellow module, including nine DEGs (Supplemen-
regulatory factors (IRFs) (32,33), including Irf7 that was a top tary Material, Table S7). Acsl3 was also significantly reduced in
10 midnightblue hub gene. Trim30a, a major STING inhibitor the lightgreen module, encoding long-chain acyl-CoA synthetase
(34), was also among this top 10. Unexpectedly, none of the IRF- that directs acyl chains into lipid droplets (43). Altered fatty acid
responsive genes, those with the interferon-stimulated response synthesis in SCA2 mouse SC is likely explained by changes in
element (ISRE), were observed in SCA2 mouse transcriptomes. mTOR abundance downstream of ataxin-2: MEFs deficient for
Innate immunity and a link to autophagy. Once we determined ataxin-2 had elevated mTOR (44), which promotes fatty acid
that pathways leading to STING activation were upregulated in synthesis by activating SREBP (45). Insig1, which controls fatty
SCA2 mouse transcriptomes without activation of ISRE genes, acid and cholesterol synthesis, was also abnormally expressed
we investigated Tbk1 and autophagy downstream. We had pre- in Atxn2 knockout mice (46). Consistent with this, abnormal fatty
viously observed abnormal autophagosome production associ- acid synthesis was observed in the liver of Atxn2 knockout mice
ated with increased abundance of the SG protein Staufen1 with and SC of ATXN2-CAG100 mice (47,48), cellular fat content was
ATXN2 mutation (35), and TBK1 supports autophagosome for- increased in Caenorhabditis elegans null for Atxn2 (49), and Atxn2
mation (36). Also, TBK1 loss of function mutations are observed knockout mice develop obesity (44,50).
in ALS and FTD (37). We investigated both Tbk1 and its sub- Cholesterol biosynthesis. Cholesterol cannot pass the blood–
strates mTor and p62/Sqstm1, and the autophagy marker Lc3-II, brain barrier; thus the brain must synthesize its own which
finding that the protein abundances of each were increased in is done in astrocytes, and when cholesterol synthesis is lost,
SCA2 mice but restored by ASO7 (Fig. 4B and C). STING regulation neuronal dysfunction is the result (51). The lightgreen module1668 Human Molecular Genetics, 2020, Vol. 29, No. 10
was characterized by 12 DEGs in the cholesterol biosynthesis ALS SC (11) and SCA2 mouse SC. Previous studies showed that
pathway, a significant annotated pathway in human ALS (11). both NEFL and NEFH are promising CSF or serum biomarkers
A key regulator of this pathway is SREBP that in times of high that are elevated as motor neurons are lost (65,66).
cholesterol is sequestered to the ER by INSIG1 and the SREBP
cleavage activating protein SCAP. When cholesterol is reduced,
INSIG1 and SCAP uncouple allowing SREBP processing mediated Conclusions
by SCAP and translocation to the nucleus where it activates Our study establishes the importance of ATXN2 in motor neuron
cholesterol synthesis genes (52). SREBP nuclear translocation is disease and SCA2 mouse models. Expression of mutant ATXN2
also dependent on PAS kinase (PASK) (53), which phosphory- in the SC produced a set of DEGs that was shared with previous
lates the ATXN2 homolog Pbp1 in yeast (54). Described above, transcriptome analyses of human ALS SC, TDP-43 mouse SC and
INSIG1 also regulates STING in innate immunity. Innate immu- SOD1 mouse SC and a set of DEGs that were altered by ATXN2
nity is coupled to cholesterol synthesis whereby low choles- ASO therapy. While relatively few individual DEGs were shared
terol is associated with elevated innate immunity signaling and among the different models, there was significant overlap in
Downloaded from https://academic.oup.com/hmg/article-abstract/29/10/1658/5822587 by guest on 01 July 2020
vice versa (55,56). Genes activating LXR/RXR signaling were also dysregulated pathways characterizing SCA2, TDP-43 and SOD1
reduced in SCA2 mouse SC as well as in human ALS (11); LXR mice. This observation also extended to dysregulated pathways
variants are associated with increased ALS risk (57). LXRs also in SC of ALS patients. DEGs revealed in this study may represent
regulate cellular efflux of cholesterol, which when restored in therapeutic targets for ALS or lead to biomarkers useful for
SCA2 or SCA3 mice improved autophagy and protein aggregation characterizing ALS therapeutics. The similarity of pathways in
phenotypes (58). SCA2 mouse SC compared with human ALS SC indicates that
the SCA2 mouse may be valuable for evaluating experimental
ASO treatment therapeutics for ALS.
Improved pathology of TDP-43 and SCA2 mice after lowering
Atxn2 expression (7,8) was a motivation for our characterizing Materials and Methods
genes in SCA2 mice altered by ATXN2 ASO7 treatment. Many
SCA2 mice
of the genes altered by ASO7 treatment function in the same
pathways that characterize SCA2 mouse SC (Table 4). Among BAC-ATXN2-Q72 (BAC-Q72) mice were previously described
these, it is notable that Lgals3bp was increased in SCA2 mouse SC (7,14). BAC-Q72 are transgenic for the complete human ATXN2
while the gene for its binding partner Lgals3 (encoding galectin- gene with all introns and exons, including 16 kb upstream
3) was increased in SC by ASO7 treatment. Both have innate sequence driving ATXN2 expression and the complete 3’-UTR.
immunity functions. Differentially expressed complement com- The mice used in this study were maintained on a mixed B6;D2
ponent genes C4b and C3 function in innate immunity, LXR/RXR background with backcrossing to wild-type vendor-purchased
signaling and lipid and cholesterol metabolism (59). For some (Jackson Laboratories) mice every five generations. Mouse
abnormally expressed DEGs in SCA2 mouse SC, ASO7 treatment husbandry and surgical procedures were in accordance to the
could partially or fully restore expression. For C3, its expression Institutional Animal Care and Use Committee (IACUC)-approved
in SCA2 mouse SC was partially restored by ASO7 treatment protocols.
(Fig. 4A). The most significant DEG in ASO7-treated SCA2 SC was
Ctss, encoding cathepsin S, whose expression is also stimulated
ASO treatment of SCA2 mice
by innate immunity activation (60), and promotes autophagy
(61). Another DEG upregulated by ASO7 was Clec7a, encoding Mice were treated with ASO7 or normal saline in two separate
Dectin-1, that traffics autophagic vesicles with its interacting experiments. In the first experiment (early treatment group),
partner Fyco1 (62), which was altered in SCA2 SC and restored BAC-Q72 mice or wild-type littermates were treated at 8 weeks of
by ASO7 treatment (Fig. 4A). Pcp4 which is ALS-associated was age and sacrificed at 19 weeks of age (10 weeks treatment time)
significantly reduced in SCA2 mouse SC and restored by ASO7 and are a subset of the same mice that appear in Figure 1B of
treatment (Fig. 4B and C). ASO7 also partially restored EAAT2 lev- our previous study (14). In the second experiment (late treatment
els (Fig. 4B and C). IFIH1 and TRIM30 were also restored by ASO group), BAC-Q72 mice or wild-type littermates were treated at
treatment (Fig. 4B and C). Notably, there were only six DEGs in SC 29 weeks of age and were sacrificed at 34 weeks of age (5 weeks
of wild-type mice treated with ASO7, supporting that lowering treatment time). Treatments were made by ICV injection of
ATXN2 expression therapeutically would be well tolerated with mice anesthetized with a mixture of oxygen and isoflurane
little off-target effects or inflammation. using a Hamilton 26-s gauge needle and a Stoelting stereotaxic
frame. Injections consisted of 6 μL of 35 μg/μl ASO7 diluted
in normal saline for a total of 210 μg. Control mice received
Biomarkers the same volume of normal saline. Anesthesia was initiated
Some DEGs observed in SCA2 mouse SC encoding small or using 3% isoflurane for 5 min, and the isoflurane mixture was
circulated peptides or processed proteins merit investigation as lowered to 2% during injections. Stereotaxic bregma coordinates
biomarkers for ALS. Il33 was the most highly downregulated were −0.46 mm anteroposterior, −1.0 mm lateral (right side)
gene in SCA2 mouse SC, consistent with a study that found and −2.5 mm dorsoventral. Needles were removed 4 min after
reduced IL33 in cerebrospinal fluid (CSF) from ALS patients ASO delivery. Mice were maintained on a 39◦ C isothermal pad
(63). Recently, three chitinases were reported upregulated in while anaesthetized and during recovery. After treatment, mice
ALS patient CSF suggesting their use as biomarkers (64). Two were sacrificed and SCs were removed and split lengthwise with
chitinase genes were differentially expressed in SCA2 mouse SC, half used for RNA preparations for RNA-seq and quantitative
including Chil1 (downregulated) and Chia1 (upregulated). Lastly, real-time PCR (qPCR) and the remaining half used for western
NEFL and NEFH were both significantly downregulated in human blotting.Human Molecular Genetics, 2020, Vol. 29, No. 10 1669
RNA preparation Power SYBR Green PCR master mix (Applied Biosystems Inc.) or
FastLane Cell SYBR Green Kit reagents. PCR amplification was
Total RNA was extracted from tissues using the RNaeasy Mini-Kit
carried out for 45 cycles. Cycling parameters were denaturation
(Qiagen Inc.) according to the manufacturer’s protocol. DNAse
(95◦ C for 10 s), annealing (60◦ C for 10 s) and extension (72◦ C
I-treated RNAs were used to synthesize cDNA using the Pro-
for 40 s). The threshold cycle for each sample was chosen
toScript cDNA First Strand cDNA Synthesis Kit (New England
from the linear range and converted to a starting quantity by
Biolabs Inc.). RNA quality was determined using the Bioana-
interpolation from a standard curve run on the same plate for
lyzer2100 Pico Chip (Agilent). Samples with an RNA integrity
each set of primers. All primers used in the study are presented
number (RIN) > 8 were considered with acceptable quality. Pre-
in Supplementary Material, Table S13.
pared RNAs were used for RNA-seq and qPCR as described below.
RNA-seq Western blot assays
Library preparation was performed using the Illumina TruSeq SC protein extracts were prepared by homogenization of mouse
Downloaded from https://academic.oup.com/hmg/article-abstract/29/10/1658/5822587 by guest on 01 July 2020
Stranded Total RNA Sample Prep and Ribo-Zero rRNA Removal SC in extraction buffer [25 mM Tris-HCl pH 7.6, 300 mM NaCl,
Kit for mouse. Single-end 50-bp reads were generated on a 0.5% Nonidet P-40, 2 mM EDTA, 2 mM MgCl2 , 0.5 M urea and
Hiseq 2000 sequencing instrument at the University of Utah protease inhibitors (Sigma-Aldrich, P8340)] followed by centrifu-
Microarray and Genomic Analysis Shared Resource using Illu- gation at 4◦ C for 20 min at 14 000 RPM. Supernatants only were
mina Version 4 flow cells. Reads were then aligned to the mouse used for western blotting. Protein extracts were resolved by SDS–
reference genome (mm10) by Novoalign (http://www.novocraft. PAGE and transferred to Hybond (Amersham) followed by detec-
com). Quality of RNA sequencing was considered acceptable tion with ECL reagent (Amersham). Antibodies included IFIH1
with an average of 22 million reads. After read alignment, DEGs rabbit polyclonal antibody (1:3000, Proteintech Cat# 21775–1-AP),
were identified using the DRDS application (version 1.3.0) in the TRIM30 antibody (1:3000, Novus Biologicals, NBP2-41087), Anti-
USeq software package (http://useq.sourceforge.net/). PCP4 antibody (1:5000, Abcam, ab197377), SQSTM1/p62 antibody
(1:4000, Cell Signaling, Cat# 5114), mTOR antibody (1:4000, Cell
Signaling, Cat# 2972), LC3B antibody (1:7000, Novus Biologicals,
Co-expression network NB100-2220), GLT-1/SLC1A2/EAAT2 antibody (9 HCLC), ABfinityTM
RNA-seq data were first filtered by FPKM (≥1.0 in 90% of samples) Rabbit Oligoclonal (1:3000, Thermo Fisher Scientific, Cat#:
to reduce noise. Genes were ranked by coefficient of variation 711020) and monoclonal anti-β-Actin−peroxidase antibody,
(≥0.15) and the top 10 000 most variable genes were used for clone AC-15 (1:20 000, Sigma-Aldrich, A3854). The secondary
the analysis. The unsigned WGCNA was conducted as previ- antibody was peroxidase-conjugated AffiniPure Goat Anti-
ously described using the R package WGCNA (67). Briefly, a Rabbit IgG (H + L) antibody (1:5000) (Jackson ImmunoResearch
similarity matrix was constructed using the Pearson correlation Laboratories, Cat# 111–035-144).
coefficients created between the FPKM normalized expression
levels of the input transcripts. Raising the absolute value of
Immunofluorescent labeling
the Pearson correlation coefficients to a power of 10 produced
a scale-free topology index above 0.9, resulting in a network SC tissue was excised and processed in 4% paraformaldehyde
with few, large correlations at the expense of lowly correlated for 72 h and then sequentially treated in 10, 20 and then 30%
transcripts. This allows for the fewer, highly connected and sucrose/phosphate-buffered saline (PBS), 24 hours each. The
biologically relevant hub genes. An adjacency network was then tissue was then frozen mounted in OCT and 18 m sectioned
created using topological overlap measure (TOM), a measure of coronally on a cryostat. Sections were permeablized in PBS, 0.5%
neighborhood connectivity. To create modules, the adjacency Triton X-100, for 10 min and then washed in wash buffer (PBS,
network was converted into a dissimilarity measure (1 − TOM) 0.05% Triton X-100). Sections were blocked in diluent buffer (PBS,
and clustered using flashClust, a hierarchical clustering func- 0.05% Triton X-100, 3% normal goat serum) for 5 h. Primary rabbit
tion. Cluster branches were cut to identify modules. Module size anti-ASO antibody (1:10 000, provided by Ionis Pharmaceuticals)
was set to a minimum of 50 transcripts, and modules with a 5% in diluent buffer was incubated on tissues overnight at 4◦ C.
similarity were merged using dynamic tree cutting. To identify Cells were washed then incubated with secondary goat anti-
significant modules, gene significance (GS) was calculated as rabbit Alexa Fluor 488 (Jackson ImmunoResearch 111-545-003) in
the absolute value of the correlation between gene expression diluent buffer for 2 h at room temperature. Cells were washed
and transgenic status. Overall significance for each module was and mounted using Fluoro-Gel (Electron Microscopy Sciences).
calculated by averaging all GS within each module. Statistical Fluorescent images were collected using a Nikon C1 fluorescent
significance was determined by using a t-test for correlation. microscope with a 488 nm filter and a 408/488/561 dichroic
mirror.
Functional enrichment analysis
Gene Ontology Enrichment Analysis (GO), and Kyoto Ency-
Supplementary Material
clopedia of Genes and Genomes (KEGG) analysis was conducted
using the functional annotation tool DAVID (https://david.nci Supplementary Material is available at HMG online.
fcrf.gov/). Ingenuity pathway analysis (IPA) was performed using
the IPA software package (Qiagen). Enriched ontological terms
and pathways with P-values less than 0.05 were selected. Acknowledgements
We thank Tim Mosbruger and Chris Stubben for assisting with
Quantitative real-time PCR (qPCR) the analysis of RNA-seq data and pathway analyses.
Quantitative real-time PCR (qPCR) was performed using the
QuantStudio 12K PCR System (Life Technologies, Inc.) with the Conflict of Interest statement. None declared.1670 Human Molecular Genetics, 2020, Vol. 29, No. 10
Funding mediated amyotrophic lateral sclerosis and frontotemporal
dementia. Am. J. Med. Genet. B Neuropsychiatr. Genet., 177,
National Institutes of Health (NIH)/National Institute of Neu-
75–85.
rological Disorders and Stroke (NINDS) (grants R21NS081182,
11. D’Erchia, A.M., Gallo, A., Manzari, C., Raho, S., Horner, D.S.,
R01NS097903, R56NS033123, R37NS033123 and U01NS103883).
Chiara, M., Valletti, A., Aiello, I., Mastropasqua, F., Ciaccia,
L. et al. (2017) Massive transcriptome sequencing of human
spinal cord tissues provides new insights into motor neuron
Author Contributions
degeneration in ALS. Sci. Rep., 7, 10046.
D.R.S. and S.M.P. conceived and designed the experiments. Exper- 12. Andres-Benito, P., Moreno, J., Aso, E., Povedano, M. and Ferrer,
iments were performed by W.D., L.T.P., M.G., K.P.F. and S.P. Data I. (2017) Amyotrophic lateral sclerosis, gene deregulation in
analyses were performed by D.R.S., L.T.P., W.D., M.G. and S.P. the anterior horn of the spinal cord and frontal cortex area
Figures were produced by D.R.S., L.T.P., W.D. and S.P. F.R. and C.F.B. 8: implications in frontotemporal lobar degeneration. Aging
provided ATXN2 ASO and anti-ASO antibody. D.R.S. wrote the (Albany NY), 9, 823–851.
Downloaded from https://academic.oup.com/hmg/article-abstract/29/10/1658/5822587 by guest on 01 July 2020
manuscript, which was critically reviewed by S.M.P., L.T.P., M.G., 13. Langfelder, P., Mischel, P.S. and Horvath, S. (2013) When is
F.R., C.F.B. and S.P. hub gene selection better than standard meta-analysis? PLoS
One, 8, e61505.
14. Dansithong, W., Paul, S., Figueroa, K.P., Rinehart, M.D., Wiest,
References S., Pflieger, L.T., Scoles, D.R. and Pulst, S.M. (2015) Ataxin-2
1. Pulst, S.M., Nechiporuk, A., Nechiporuk, T., Gispert, S., Chen, regulates RGS8 translation in a new BAC-SCA2 transgenic
X.N., Lopes-Cendes, I., Pearlman, S., Starkman, S., Orozco- mouse model. PLoS Genet., 11, e1005182.
Diaz, G., Lunkes, A. et al. (1996) Moderate expansion of a nor- 15. Uhlen, M., Fagerberg, L., Hallstrom, B.M., Lindskog, C.,
mally biallelic trinucleotide repeat in spinocerebellar ataxia Oksvold, P., Mardinoglu, A., Sivertsson, A., Kampf, C., Sjost-
type 2. Nat. Genet., 14, 269–276. edt, E., Asplund, A. et al. (2015) Proteomics. Tissue-based map
2. Fernandez, M., McClain, M.E., Martinez, R.A., Snow, K., Lipe, of the human proteome. Science, 347, 1260419.
H., Ravits, J., Bird, T.D. and La Spada, A.R. (2000) Late-onset 16. Stezin, A., Venkatesh, S.D., Thennarasu, K., Purushottam, M.,
SCA2: 33 CAG repeats are sufficient to cause disease. Neurol- Jain, S., Yadav, R. and Pal, P.K. (2018) Non-ataxic manifes-
ogy, 55, 569–572. tations of Spinocerebellar ataxia-2, their determinants and
3. Elden, A.C., Kim, H.J., Hart, M.P., Chen-Plotkin, A.S., Johnson, predictors. J. Neurol. Sci., 394, 14–18.
B.S., Fang, X., Armakola, M., Geser, F., Greene, R., Lu, M.M. et al. 17. Recabarren-Leiva, D. and Alarcon, M. (2018) New insights
(2010) Ataxin-2 intermediate-length polyglutamine expan- into the gene expression associated to amyotrophic lateral
sions are associated with increased risk for ALS. Nature, 466, sclerosis. Life Sci., 193, 110–123.
1069–1075. 18. Shan, X., Chiang, P.M., Price, D.L. and Wong, P.C. (2010) Altered
4. Neuenschwander, A.G., Thai, K.K., Figueroa, K.P. and Pulst, distributions of Gemini of coiled bodies and mitochondria in
S.M. (2014) Amyotrophic lateral sclerosis risk for spinocere- motor neurons of TDP-43 transgenic mice. Proc. Natl. Acad.
bellar ataxia type 2 ATXN2 CAG repeat alleles: a meta- Sci. U. S. A., 107, 16325–16330.
analysis. JAMA Neurol., 71, 1529–1534. 19. Bandyopadhyay, U., Cotney, J., Nagy, M., Oh, S., Leng, J., Maha-
5. Sproviero, W., Shatunov, A., Stahl, D., Shoai, M., van Rheenen, jan, M., Mane, S., Fenton, W.A., Noonan, J.P. and Horwich, A.L.
W., Jones, A.R., Al-Sarraj, S., Andersen, P.M., Bonini, N.M., (2013) RNA-Seq profiling of spinal cord motor neurons from
Conforti, F.L. et al. (2017) ATXN2 trinucleotide repeat length a presymptomatic SOD1 ALS mouse. PLoS One, 8, e53575.
correlates with risk of ALS. Neurobiol. Aging, 51, –178 e171, 20. Wroe, R., Wai-Ling Butler, A., Andersen, P.M., Powell, J.F.
178 e179. and Al-Chalabi, A. (2008) ALSOD: the amyotrophic lateral
6. Van Damme, P., Veldink, J.H., van Blitterswijk, M., Corveleyn, sclerosis online database. Amyotroph. Lateral Scler., 9, 249–250.
A., van Vught, P.W., Thijs, V., Dubois, B., Matthijs, G., van den 21. Meera, P., Pulst, S. and Otis, T. (2017) A positive feedback
Berg, L.H. and Robberecht, W. (2011) Expanded ATXN2 CAG loop linking enhanced mGluR function and basal calcium in
repeat size in ALS identifies genetic overlap between ALS spinocerebellar ataxia type 2. elife, 6, e26377.
and SCA2. Neurology, 76, 2066–2072. 22. Barnes, J.A., Ebner, B.A., Duvick, L.A., Gao, W., Chen, G., Orr,
7. Scoles, D.R., Meera, P., Schneider, M.D., Paul, S., Dansithong, H.T. and Ebner, T.J. (2011) Abnormalities in the climbing
W., Figueroa, K.P., Hung, G., Rigo, F., Bennett, C.F., Otis, T.S. et al. fiber-Purkinje cell circuitry contribute to neuronal dysfunc-
(2017) Antisense oligonucleotide therapy for spinocerebellar tion in ATXN1[82Q] mice. J. Neurosci., 31, 12778–12789.
ataxia type 2. Nature, 544, 362–366. 23. Vyas, S. and Chang, P. (2014) New PARP targets for cancer
8. Becker, L.A., Huang, B., Bieri, G., Ma, R., Knowles, D.A., Jafar- therapy. Nat. Rev. Cancer, 14, 502–509.
Nejad, P., Messing, J., Kim, H.J., Soriano, A., Auburger, G. 24. West, A.P., Khoury-Hanold, W., Staron, M., Tal, M.C., Pineda,
et al. (2017) Therapeutic reduction of ataxin-2 extends lifes- C.M., Lang, S.M., Bestwick, M., Duguay, B.A., Raimundo,
pan and reduces pathology in TDP-43 mice. Nature, 544, N., MacDuff, D.A. et al. (2015) Mitochondrial DNA stress
367–371. primes the antiviral innate immune response. Nature, 520,
9. Sellier, C., Campanari, M.L., Julie Corbier, C., Gaucherot, A., 553–557.
Kolb-Cheynel, I., Oulad-Abdelghani, M., Ruffenach, F., Page, 25. Samaraweera, S.E., O’Keefe, L.V., Price, G.R., Venter, D.J. and
A., Ciura, S., Kabashi, E. et al. (2016) Loss of C9ORF72 impairs Richards, R.I. (2013) Distinct roles for toll and autophagy
autophagy and synergizes with polyQ Ataxin-2 to induce pathways in double-stranded RNA toxicity in a drosophila
motor neuron dysfunction and cell death. EMBO J., 35, model of expanded repeat neurodegenerative diseases. Hum.
1276–1297. Mol. Genet., 22, 2811–2819.
10. Farhan, S.M.K., Gendron, T.F., Petrucelli, L., Hegele, R.A. and 26. Rhodes, J.D., Lott, M.C., Russell, S.L., Moulton, V., Sanderson,
Strong, M.J. (2018) OPTN p.Met468Arg and ATXN2 inter- J., Wormstone, I.M. and Broadway, D.C. (2012) Activation of
mediate length polyQ extension in families with C9orf72 the innate immune response and interferon signalling inHuman Molecular Genetics, 2020, Vol. 29, No. 10 1671
myotonic dystrophy type 1 and type 2 cataracts. Hum. Mol. the localization on lipid droplets and the function in fatty
Genet., 21, 852–862. acid uptake. J. Lipid Res., 53, 888–900.
27. Lencer, W.I., DeLuca, H., Grey, M.J. and Cho, J.A. (2015) Innate 44. Lastres-Becker, I., Nonis, D., Eich, F., Klinkenberg, M., Gorospe,
immunity at mucosal surfaces: the IRE1-RIDD-RIG-I path- M., Kotter, P., Klein, F.A., Kedersha, N. and Auburger, G. (2016)
way. Trends Immunol., 36, 401–409. Mammalian ataxin-2 modulates translation control at the
28. Bhattacharyya, S. (2014) Can’t RIDD off viruses. Front. Micro- pre-initiation complex via PI3K/mTOR and is induced by
biol., 5, 292. starvation. Biochim. Biophys. Acta, 1862, 1558–1569.
29. Wu, B. and Hur, S. (2015) How RIG-I like receptors activate 45. Shimano, H. and Sato, R. (2017) SREBP-regulated lipid
MAVS. Curr. Opin. Virol., 12, 91–98. metabolism: convergent physiology - divergent pathophysi-
30. Ishikawa, H. and Barber, G.N. (2008) STING is an endoplasmic ology. Nat. Rev. Endocrinol., 13, 710–730.
reticulum adaptor that facilitates innate immune signalling. 46. Lastres-Becker, I., Brodesser, S., Lutjohann, D., Azizov, M.,
Nature, 455, 674–678. Buchmann, J., Hintermann, E., Sandhoff, K., Schurmann, A.,
31. Wang, Q., Liu, X., Cui, Y., Tang, Y., Chen, W., Li, S., Yu, H., Pan, Nowock, J. and Auburger, G. (2008) Insulin receptor and lipid
Downloaded from https://academic.oup.com/hmg/article-abstract/29/10/1658/5822587 by guest on 01 July 2020
Y. and Wang, C. (2014) The E3 ubiquitin ligase AMFR and metabolism pathology in ataxin-2 knock-out mice. Hum. Mol.
INSIG1 bridge the activation of TBK1 kinase by modifying Genet., 17, 1465–1481.
the adaptor STING. Immunity, 41, 919–933. 47. Meierhofer, D., Halbach, M., Sen, N.E., Gispert, S. and
32. Tanaka, Y. and Chen, Z.J. (2012) STING specifies IRF3 phos- Auburger, G. (2016) Ataxin-2 (Atxn2)-knock-out mice show
phorylation by TBK1 in the cytosolic DNA signaling pathway. branched chain amino acids and fatty acids pathway alter-
Sci. Signal., 5, ra20. ations. Mol. Cell. Proteomics, 15, 1728–1739.
33. Suschak, J.J., Wang, S., Fitzgerald, K.A. and Lu, S. (2016) 48. Sen, N.E., Arsovic, A., Meierhofer, D., Brodesser, S., Ober-
A cGAS-independent STING/IRF7 pathway mediates the schmidt, C., Canet-Pons, J., Kaya, Z.E., Halbach, M.V., Gispert,
immunogenicity of DNA vaccines. J. Immunol., 196, 310–316. S., Sandhoff, K. et al. (2019) In human and mouse Spino-
34. Wang, Y., Lian, Q., Yang, B., Yan, S., Zhou, H., He, L., Lin, cerebellar tissue, Ataxin-2 expansion affects Ceramide-
G., Lian, Z., Jiang, Z. and Sun, B. (2015) TRIM30alpha is a Sphingomyelin metabolism. Int. J. Mol. Sci., 20, 5854.
negative-feedback regulator of the intracellular DNA and 49. Bar, D.Z., Charar, C., Dorfman, J., Yadid, T., Tafforeau, L.,
DNA virus-triggered response by targeting STING. PLoS Lafontaine, D.L. and Gruenbaum, Y. (2016) Cell size and
Pathog., 11, e1005012. fat content of dietary-restricted Caenorhabditis elegans are
35. Paul, S., Dansithong, W., Figueroa, K.P., Scoles, D.R. and regulated by ATX-2, an mTOR repressor. Proc. Natl. Acad. Sci.
Pulst, S.M. (2018) Staufen1 links RNA stress granules and U. S. A., 113, E4620–E4629.
autophagy in a model of neurodegeneration. Nat. Commun., 50. Kiehl, T.R., Nechiporuk, A., Figueroa, K.P., Keating, M.T.,
9, 3648. Huynh, D.P. and Pulst, S.M. (2006) Generation and characteri-
36. Oakes, J.A., Davies, M.C. and Collins, M.O. (2017) TBK1: a new zation of Sca2 (ataxin-2) knockout mice. Biochem. Biophys. Res.
player in ALS linking autophagy and neuroinflammation. Commun., 339, 17–24.
Mol. Brain, 10, 5. 51. Ferris, H.A., Perry, R.J., Moreira, G.V., Shulman, G.I., Horton,
37. Freischmidt, A., Muller, K., Ludolph, A.C., Weishaupt, J.H. J.D. and Kahn, C.R. (2017) Loss of astrocyte cholesterol syn-
and Andersen, P.M. (2017) Association of Mutations in TBK1 thesis disrupts neuronal function and alters whole-body
with sporadic and familial amyotrophic lateral sclerosis and metabolism. Proc. Natl. Acad. Sci. U. S. A., 114, 1189–1194.
Frontotemporal dementia. JAMA Neurol., 74, 110–113. 52. Sun, L.P., Seemann, J., Goldstein, J.L. and Brown, M.S. (2007)
38. Liu, D., Wu, H., Wang, C., Li, Y., Tian, H., Siraj, S., Sehgal, Sterol-regulated transport of SREBPs from endoplasmic
S.A., Wang, X., Wang, J., Shang, Y. et al. (2019) STING directly reticulum to Golgi: Insig renders sorting signal in Scap inac-
activates autophagy to tune the innate immune response. cessible to COPII proteins. Proc. Natl. Acad. Sci. U. S. A., 104,
Cell Death Differ., 26, 1735–1749. 6519–6526.
39. Gui, X., Yang, H., Li, T., Tan, X., Shi, P., Li, M., Du, F. and 53. Wu, X., Romero, D., Swiatek, W.I., Dorweiler, I., Kikani, C.K.,
Chen, Z.J. (2019) Autophagy induction via STING trafficking Sabic, H., Zweifel, B.S., McKearn, J., Blitzer, J.T., Nickols, G.A.
is a primordial function of the cGAS pathway. Nature, 567, et al. (2014) PAS kinase drives lipogenesis through SREBP-1
262–266. maturation. Cell Rep., 8, 242–255.
40. Prabakaran, T., Bodda, C., Krapp, C., Zhang, B.C., Christensen, 54. DeMille, D., Badal, B.D., Evans, J.B., Mathis, A.D., Anderson,
M.H., Sun, C., Reinert, L., Cai, Y., Jensen, S.B., Skouboe, M.K. J.F. and Grose, J.H. (2015) PAS kinase is activated by direct
et al. (2018) Attenuation of cGAS-STING signaling is mediated SNF1-dependent phosphorylation and mediates inhibition
by a p62/SQSTM1-dependent autophagy pathway activated of TORC1 through the phosphorylation and activation of
by TBK1. EMBO J., 37, e97858. Pbp1. Mol. Biol. Cell, 26, 569–582.
41. Gadani, S.P., Walsh, J.T., Smirnov, I., Zheng, J. and Kipnis, 55. Fessler, M.B. (2016) The intracellular cholesterol land-
J. (2015) The glia-derived alarmin IL-33 orchestrates the scape: dynamic integrator of the immune response. Trends
immune response and promotes recovery following CNS Immunol., 37, 819–830.
injury. Neuron, 85, 703–709. 56. York, A.G., Williams, K.J., Argus, J.P., Zhou, Q.D., Brar, G.,
42. Gao, Y., Luo, C.L., Li, L.L., Ye, G.H., Gao, C., Wang, H.C., Vergnes, L., Gray, E.E., Zhen, A., Wu, N.C., Yamada, D.H. et al.
Huang, W.W., Wang, T., Wang, Z.F., Ni, H. et al. (2017) IL- (2015) Limiting cholesterol biosynthetic flux spontaneously
33 provides Neuroprotection through suppressing apoptotic, engages type I IFN signaling. Cell, 163, 1716–1729.
Autophagic and NF-kappaB-mediated inflammatory path- 57. Mouzat, K., Molinari, N., Kantar, J., Polge, A., Corcia, P.,
ways in a rat model of recurrent neonatal seizure. Front. Mol. Couratier, P., Clavelou, P., Juntas-Morales, R., Pageot, N.,
Neurosci., 10, 423. Lobaccaro, J.A. et al. (2018) Liver X receptor genes variants
43. Poppelreuther, M., Rudolph, B., Du, C., Grossmann, R., Becker, modulate ALS phenotype. Mol. Neurobiol., 55, 1959–1965.
M., Thiele, C., Ehehalt, R. and Fullekrug, J. (2012) The N- 58. Nobrega, C., Mendonca, L., Marcelo, A., Lamaziere, A., Tome,
terminal region of acyl-CoA synthetase 3 is essential for both S., Despres, G., Matos, C.A., Mechmet, F., Langui, D., denYou can also read