Mapping Calcium Dynamics in the Heart of Zebrafish Embryos with Ratiometric Genetically Encoded Calcium Indicators - MDPI

Page created by Benjamin Wise
 
CONTINUE READING
Mapping Calcium Dynamics in the Heart of Zebrafish Embryos with Ratiometric Genetically Encoded Calcium Indicators - MDPI
International Journal of
            Molecular Sciences

Article
Mapping Calcium Dynamics in the Heart of Zebrafish
Embryos with Ratiometric Genetically Encoded
Calcium Indicators
Jussep Salgado-Almario 1 , Manuel Vicente 1 , Pierre Vincent 2, * , Beatriz Domingo 1, *              and
Juan Llopis 1, *
 1    Physiology and Cell Dynamics, Centro Regional de Investigaciones Biomédicas (CRIB),
      Facultad de Medicina de Albacete, Departamento de Ciencias Médicas, Universidad de Castilla-La Mancha,
      C/Almansa 14, 02006 Albacete, Spain; Jussep.Salgado@uclm.es (J.S.-A.); Manuel.Vicente@uclm.es (M.V.)
 2    UMR8256, Biological Adaptation and Ageing, CNRS, Sorbonne Université, F-75005 Paris, France
 *    Correspondence: pierre.vincent@sorbonne-universite.fr (P.V.); beatriz.domingo@uclm.es (B.D.);
      juan.llopis@uclm.es (J.L.)
                                                                                                    
 Received: 4 September 2020; Accepted: 8 September 2020; Published: 10 September 2020               

 Abstract: Zebrafish embryos have been proposed as a cost-effective vertebrate model to study heart
 function. Many fluorescent genetically encoded Ca2+ indicators (GECIs) have been developed, but
 those with ratiometric readout seem more appropriate to image a moving organ such as the heart.
 Four ratiometric GECIs based on troponin C, TN-XXL, Twitch-1, Twitch-2B, and Twitch-4 were
 expressed transiently in the heart of zebrafish embryos. Their emission ratio reported the Ca2+
 levels in both the atrium and the ventricle. We measured several kinetic parameters of the Ca2+
 transients: systolic and diastolic ratio, the amplitude of the systolic Ca2+ rise, the heart rate, as well
 as the rise and decay times and slopes. The systolic ratio change decreased in cells expressing high
 biosensor concentration, possibly caused by Ca2+ buffering. The GECIs were able to report the effect
 of nifedipine and propranolol on the heart, which resulted in changes in heart rate, diastolic and
 systolic Ca2+ levels, and Ca2+ kinetics. As a result, Twitch-1 and Twitch-4 (Kd 0.25 and 2.8 µM,
 respectively) seem the most promising GECIs for generating transgenic zebrafish lines, which could
 be used for modeling heart disorders, for drug screening, and for cardiotoxicity assessment during
 drug development.

 Keywords: calcium; genetically encoded calcium indicator (GECI); biosensor; zebrafish; embryo;
 heart; imaging

1. Introduction
      Many genetic and acquired heart diseases are believed to involve a dysregulation of the Ca2+
signaling [1–3]. Since the Ca2+ ion is central in excitation–contraction coupling in the heart, genetically
encoded Ca2+ indicators (GECIs) have been used in animal models to image the physiological and
pathophysiological mechanisms and to characterize the actions of drugs on the heart [4]. Compared
with studies in isolated cardiomyocytes, animal studies have the advantage of keeping the relationship
between the heart and other organs. The heart is monitored while performing mechanical work
and driving blood flow in a physiological environment. Thus, molecular or cellular changes can be
correlated to important functional outcomes, such as cardiac output or ejection fraction.
      The zebrafish embryo is emerging as a cost-effective, relatively easy-to-study specimen, because
of its high genetic manipulability, transparency, ex-utero embryonic development, and large number
of offspring. The zebrafish heart is composed of an atrium and a ventricle, with many anatomical
differences with the mammalian heart. However, it has been argued that the zebrafish heart physiology,

Int. J. Mol. Sci. 2020, 21, 6610; doi:10.3390/ijms21186610                         www.mdpi.com/journal/ijms
Mapping Calcium Dynamics in the Heart of Zebrafish Embryos with Ratiometric Genetically Encoded Calcium Indicators - MDPI
Int. J. Mol. Sci. 2020, 21, 6610                                                                     2 of 22

heart rate (HR), and action potential, while showing some channel expression differences, are more
similar to those of the human than other animal models, such as the mouse [5–11]. For all these reasons,
the zebrafish is increasingly considered a model in cardiovascular research in phenotype-based drug
and genetic screenings [12–15]. However, some concerns have been pointed out regarding their use
as models for human heart disease [16,17]. Reported differences with the mammalian heart are a
small contribution of the sarcoplasmic reticulum to the Ca2+ transient, lack of T-tubules and lower
expression of ryanodine receptors [11,16], or a larger density of Ca2+ current through the L-type Ca2+
channels (LTCC) and Ca2+ entry through the Na–Ca exchanger (NCX, at membrane potentials above
+10 mV) [11,17]. These have led some authors to caution about the extrapolation of the functional
impact of mutations studied in zebrafish to the human [11,17]. We believe that further studies are
needed to characterize the Ca2+ handling in embryonic, larval, and adult zebrafish cardiomyocytes,
to find out which channel isoforms and transporters are common or differ from neonates and adults
in the human [11] and, thus, which diseases can be modeled in the zebrafish. This emphasizes the
importance of electrophysiological and imaging studies like this one. Moreover, molecular techniques
like CRISPR/Cas9 will allow removal or introduction of wild type or mutated genes to generate
zebrafish models more similar to the human heart [11].
      Numerous GECIs have been developed and improved in recent years. They can be broadly classed
as single-fluorophore GECIs, like the widely used GCaMPs [18–21], and ratiometric GECIs, bearing
two fluorophores [22–24]. Imaging the former is technically simpler and allows the collection of all
photons, whereas in ratiometric emission GECIs some photons are lost by using bandpass filters and
beamsplitters. GCaMPs are frequently used in neuroscience and in cardiovascular research [18,23,25,26].
Recent papers have successfully used GCaMP6f [25] or GCaMP5G [26] in the heart of zebrafish embryos.
These biosensors worked fine, and the authors measured the effect of channel blockers and adrenergic
modulators on the embryo heart. We chose ratiometric GECIs to image Ca2+ in the heart of zebrafish
embryos because the ratio should, in principle, largely cancel out motion artifacts, correct for differences
in expression levels, specimen thickness, tissue growth, and illumination inhomogeneities [22,23,27,28].
In addition, ratiometric probes are usually brighter than many single fluorophore biosensors at resting
Ca2+ levels.
      Chemical and gene-encoded Ca2+ indicators aim to measure the free Ca2+ concentration because
it represents its propensity to drive Ca2+ -binding reactions, its chemical potential [29]. To do
so, Ca2+ indicators react with that same Ca2+ , acting as exogenous buffers and altering the Ca2+
dynamics and possibly Ca2+ function as well, depending on the biosensor mobility, affinity, and
concentration [23,29–31]. Biosensor expression levels should be as low as possible while providing an
adequate optical signal-to-noise ratio (SNR). At higher expression levels, buffering by the biosensor
might unnecessarily interfere with the biological effects. A consequence of Ca2+ buffering is blunting of
the transient increases, which is worse the higher the concentration of the exogenous buffer, the closer
the intracellular Ca2+ to the Kd of the biosensor, and the shorter the Ca2+ transients [29]. A second
consequence is blurring of the spatial gradients, depending on the size and mobility of the Ca2+ -bound
biosensor compared to the endogenous buffers. Depression of the resting Ca2+ levels is not usually a
concern in the presence of extracellular Ca2+ because low levels increase the Ca2+ entry mechanisms
and slow down the Ca2+ efflux [29,32].
      We chose the fluorescence resonance energy transfer (FRET)-based GECIs TN-XXL, Twitch-1,
Twitch-2B, and Twitch-4, with in vitro properties, which a priori seemed adequate to work well in the
embryo heart. The Twitch series of biosensors possess minimal Ca2+ -binding domains and respond
with a Hill slope close to 1, which improves the linearity of the fluorescence response with Ca2+ [23,24].
In turn, TN-XXL [33] has already been shown to monitor the Ca2+ changes in the mouse heart ex
vivo [34]. The biosensors should be expressed at sufficient levels to be imaged at a high speed and,
since in vitro conditions differ considerably from the intracellular milieu, their performance in vivo
should be investigated empirically. This is important to fill a gap between the “proof-of-principle”
demonstration of the performance of GECIs and their practical implementation as scientific tools,
Mapping Calcium Dynamics in the Heart of Zebrafish Embryos with Ratiometric Genetically Encoded Calcium Indicators - MDPI
Int. J. Mol. Sci. 2020, 21, 6610                                                                     3 of 22

particularly in vivo. The Twitch biosensors we employed have been characterized mostly in the brain
but to our knowledge they have never been used in the heart of any vertebrate in vivo. There are
striking differences between the applications in the brain an in the heart. For use in the zebrafish heart,
a major problem is the constant cycling between diastolic and systolic Ca2+ levels at a rate of about
200 bpm (more than 3 beats/s).
      The TN-XXL and Twitch GECIs, composed of chicken or Opsanus troponin C as their Ca2+ -sensing
element, respectively, were found to interfere less with the cellular regulatory elements than the
calmodulin-based biosensors (cameleon, GCaMPs) in the neurons [35]. However, in addition to Ca2+
buffering, the expression of biosensors containing troponin C could have deleterious effects on zebrafish
heart physiology. They might hamper the excitation–contraction coupling in the myofibrils or affect
the parameters such as the force of contraction. We investigated these aspects, sometimes overlooked
in studies employing genetically encoded indicators. Direnberger et al. examined the off-target effects
of TN-XXL expression in a transgenic mouse model [34].
      The four GECI mentioned above were compared in 3 days post-fertilization (dpf) embryos
transiently expressing the biosensors, to identify their particular advantages and limitations in the
zebrafish heart. They were bright enough to be imaged at 50 or even 100 Hz, which was needed to
resolve the Ca2+ changes in the heart occurring at >200 beats per minute (bpm). The GECIs were
found to reliably report the Ca2+ changes during systole and diastole and to correct for motion artifacts
and photobleaching. The biosensors showed a decrease in the Ca2+ levels and HR induced by a Ca2+
channel antagonist and an adrenergic blocker. In addition, this work allowed us to assess which GECIs
would perform better in transgenic models. While Twitch-4 could be a good candidate for various
applications because of its sensitivity and faster fluorescence response kinetics, the higher affinity
Twitch-1 might be preferred to measure the diastolic or decreased Ca2+ levels associated with drugs or
disease. Several recent papers have already demonstrated that zebrafish can be used for screening [13]
and for detecting the deleterious effects of drugs on the heart in zebrafish embryos [14,15]. These
studies were performed with transmitted light or in zebrafish lines expressing GFP in the heart, which
allowed localization and measurement of the heart rate and other parameters. By expressing a Ca2+
biosensor, our approach provides both localization of the heart (by fluorescence) and a readout of an
important second messenger (Ca2+ ).

2. Results

2.1. Transient Expression of TN-XXL and Twitch Ca2+ Biosensors in the Heart of Zebrafish Embryos
      We selected four ratiometric GECIs to measure the in vivo Ca2+ changes in the heart of 3 dpf
zebrafish embryos. The probes TN-XXL, Twitch-1, Twitch-2B, and Twitch-4, with different Ca2+
affinities and response kinetics, were chosen to characterize and compare their usefulness as Ca2+
reporters in the beating heart; Table 1 summarizes their in vitro properties. TN-XXL belongs to a family
of GECIs with chicken troponin C as the Ca2+ -binding domain [33]. It contains the C-terminal domain
of the chicken skeletal muscle troponin C and was engineered to increase Ca2+ affinity (0.8 µM Kd)
and to block Mg2+ binding. Although it has been superseded by more recent biosensors, TN-XXL was
chosen because it has been shown to report Ca2+ transients in beating sinoatrial node explants and
dissected hearts from transgenic mice [34].
      The Twitch biosensors are improved versions of TN-XXL with a reduced number of Ca2+ -binding
sites per biosensor and are based on the C-terminal domain of the toadfish Opsanus tau troponin C [24].
Twitch-1 and Twitch-2B have a high Ca2+ affinity (0.25 and 0.2 µM Kd, respectively) and decay times
of 0.8 s and 2.8 s. The biosensor with the lowest Ca2+ affinity, Twitch-4 (2.8 µM Kd), possesses only
one functional EF hand (Hill slope of 1.04) and has the fastest decay time constant of the employed
GECIs (0.5 s) (Table 1). All biosensors contain the fluorescent proteins (FP) CFP as the FRET donor at
the N-terminal end, and cpCitrine174, a YFP, as the FRET acceptor at the C-terminal end, except for
Twitch-2B, which incorporates mCerulean3 as the donor and cpVenusCD as the acceptor.
Mapping Calcium Dynamics in the Heart of Zebrafish Embryos with Ratiometric Genetically Encoded Calcium Indicators - MDPI
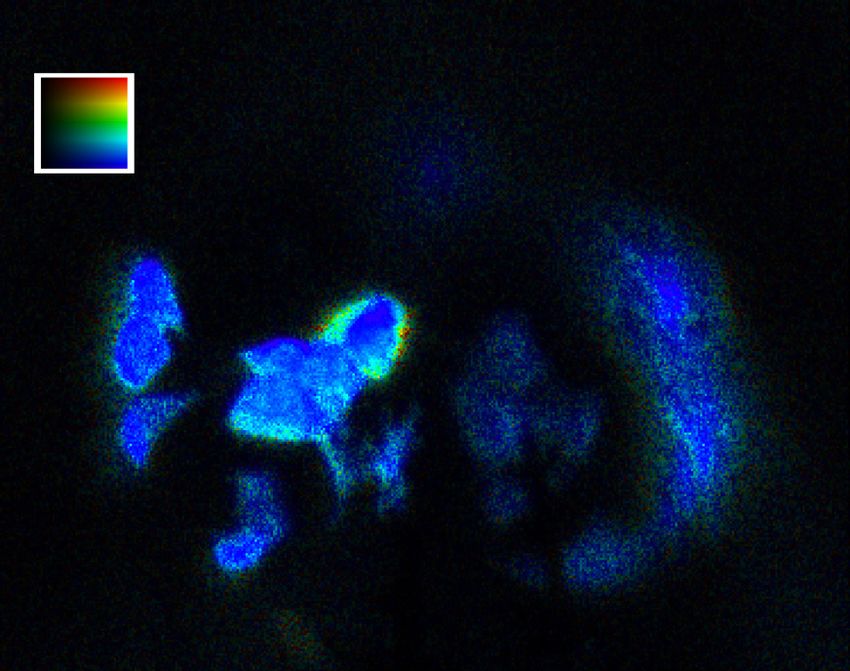
Int. J. Mol. Sci. 2020, 21, 6610                                                                                           4 of 22

                                   Table 1. In vitro properties of the selected biosensors.

                                                                     ∆R/R In       ∆R/R Ex       Kd       Decay        Hill
    Biosensor       FRET Pair         Troponin C         Linkers
                                                                     Vitro (%)     Vivo (%)     (µM)     Time (s)     Slope
                                   Opsanus tau swim
                      ECFP
     Twitch-1                      bladder and white       P, P          400                    0.25        0.8         1.18
                     cpCit174
                                        muscle
                                   Opsanus tau swim
                   mCerulean3                             VADA,
    Twitch-2B                      bladder and white                     800        26.5 †       0.2        2.8         1.31
                   cpVenusCD                               PIYP
                                        muscle
                                   Opsanus tau swim
                      ECFP
     Twitch-4                      bladder and white     DA, PIY         600                     2.8        0.5        1.04
                     cpCit174
                                        muscle
                      ECFP          Chicken skeletal
    TN-XXL *                                             RML, EL         260         10 ‡        0.8       0.88         1.5
                     cpCit174           muscle
      * TN-XXL data from [33]. The Kd was obtained in vitro and the decay time in a preparation of neuromuscular
      junction of Drosophila melanogaster. † Twitch-2B during a single action potential in mouse acute cortical slices [24].
      ‡ TN-XXL during systole in heart explants from a transgenic mouse [34].

      The coding sequences of TN-XXL, Twitch-1, Twitch-2B, and Twitch-4 were subcloned into the
pTol expression vector [36,37] under the cmlc2 (myl7) promoter [38], which drives expression of the
probes in the atrium and ventricle of the zebrafish heart. To obtain embryos with transient expression,
fertilized zebrafish eggs were microinjected with the cDNA of each biosensor and transposase mRNA.
Embryos showed fluorescence in the forming cardiac tube at 24 h post-fertilization (hpf) and, by 3 dpf,
all biosensors were expressed specifically in the atrium and ventricle (Figure 1A). Embryos were
embedded in agarose on a 96-well plate and placed on the stage of a widefield fluorescence microscope
fitted with an emission splitter, which projected CFP and YFP emission simultaneously on the sCMOS
camera in order to obtain perfect time registration of the donor and FRET fluorescence (Figure 1A). As
the HR was found to be very temperature-sensitive, embryos were imaged in a thermostatic chamber
at 28 ◦ C.
      As expected, mosaic expression of the biosensors was seen in the heart and no other organ
appeared fluorescent, except for autofluorescence of the yolk. Some cells were brightly fluorescent
in both the CFP and FRET channels and the ventricles were more stained than the atria, as shown
in Figure 1B for Twitch-4, owing in part to their thickness. A custom written program was used
to compute the pseudo color ratio images of the FRET acceptor to donor fluorescence, where the
hue coded for the ratio and brightness was proportional to the fluorescence intensity, so that no
arbitrary thresholding of intensity was needed to identify the cells [28,39]. Since the HR of the 3 dpf
embryos was above 200 bpm, they were imaged at 50 Hz with continuous illumination during 5–10 s
to record the ratio changes in the beating hearts over time. To minimize the motion artifacts, the
embryos were incubated with the non-fluorescent myosin inhibitor para-amino blebbistatin (PAB) [40],
which decreased but did not completely abolish the heart contractions (compare Videos S1 and S2 in
transmitted light and Videos S3–S5 for emission ratio of the different GECIs). Because of their small
size, embryos at this stage can survive without heart contraction due to oxygen diffusion through the
tissues [41]. Regions of interest (ROI) were manually drawn on the atrium and ventricle and their
spatially averaged ratio values (related to Ca2+ ) were computed over time (Figure 1B).
      Ratio levels were seen to oscillate synchronously with the heart contractions and the ratio rise
started in the atrium and was propagated to the ventricle with a delay (Figure 1B; Videos S3 and S4).
Zebrafish are known to have a functional pacemaker in the sinoatrial node, similarly to mammals.
Although the existence of an atrioventricular node has not been established, there is a delay in the
electrical conduction in the atrioventricular canal, and thus the ventricle contracts after filling with
blood from the atrium.
      We wrote routines in Igor Pro 8 (WaveMetrics) to analyze the ratio recordings (see Materials and
Methods for details). A smoothing algorithm was applied to the raw ratio data (see Methods and
Mapping Calcium Dynamics in the Heart of Zebrafish Embryos with Ratiometric Genetically Encoded Calcium Indicators - MDPI
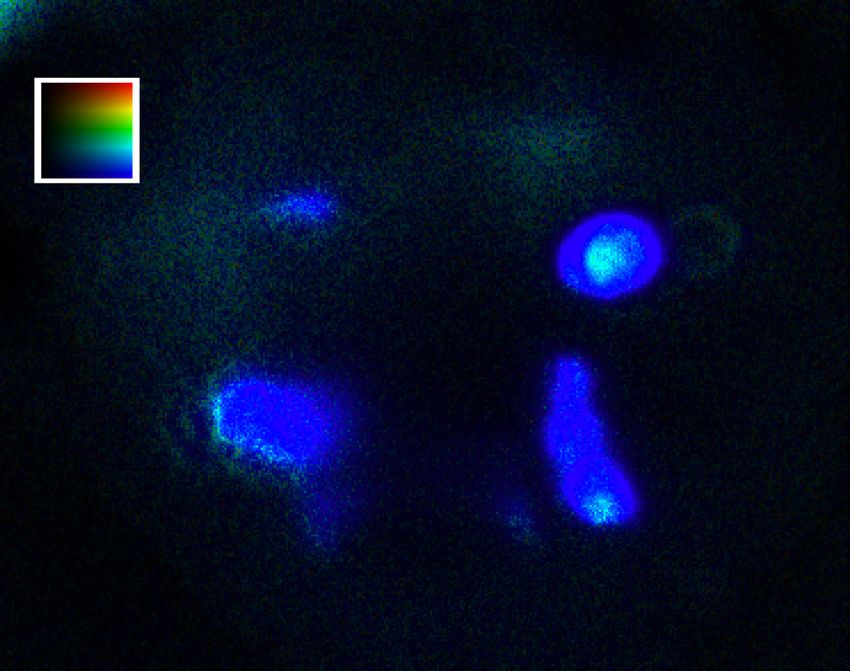
Int. J. Mol. Sci. 2020, 21, 6610                                                                                                     5 of 22

Table S3). The routines automatically identified the peak and lowest ratio (Rsystole and Rdiastole ) in each
cardiac cycle and calculated the following parameters: the Ca2+ transient amplitude ∆R (systolic minus
diastolic ratio), the rate of Ca2+ rise and decrease (ratio rise slope from 10 to 90% and decay slope from
90 to 10% of the amplitude), the rise time 10–90%, and the decay time 90–10% of the Ca2+ transients
(Figure 1C). From the time between systolic peaks, the instantaneous HR was also calculated.

   A
                     Thermostatic
                                                           Wide-field
                   chamber incubator
                                                         fluorescence
                                                                                                  Mounting
                                                          microscope

                                                                                                        Treatment
                                                                                                        0.3% Agarose + PAB

                                                                                              Transm + Fluo

                       LED                                                                   Atrium                   Yolk
                      source

                                                                                    Eye               Ventricle

                                      Image
               sCMOS                  splitter
               camera

   B                                                                                         C
                                                                                                 Systolic
           Donor               FRET              Ratio                                            ratio
                                                                        Atrium   Ventricle

                                                                                                                                 Dec -10%
                                                                                                             10- lope
                                                                                                                 90%

                                                                                                                                   90
                                                                                                                                    ay
                                                                                                                 es
                                                                                                   ΔR

                                                                                                                                       slop
                                                                                                             Ris

                                                                                                                                            e
                                                                                                 Diastolic
                                                                                                   ratio
                                                                                                                  Rise time   Decay time
                                                                                                                  10-90%       90-10%

       Figure 1. Zebrafish embryo mounting for microscopy, image acquisition and processing, and parameters
       extracted from Ca2+ transients. (A) Embryos expressing the biosensors in the heart were embedded in
       agarose and mounted in glass-bottom 96-well plates. An overlay of transmitted light and fluorescence
       of the heart is shown in an embryo expressing Twitch-4. The fluorescence from the widefield microscope
       passed through an image splitter that separated the FRET and donor emission onto the sCMOS sensor.
       (B) The two emission images were divided off-line and the ratio images (FRET/donor channels) were
       computed. Regions-of-interest (ROI) were manually drawn on the atrium (red line) and ventricle (white
       line) and analyzed in Igor Pro (WaveMetrics). (C) Various parameters were automatically extracted
       from the ratio time course data.

      Figure 2A shows the fluorescence of TN-XXL, Twitch-1, Twitch-2B, and Twitch-4 overlaid with the
transmitted light in the representative experiments, as well as the donor and FRET fluorescence images
and their ratio (in pseudo color with the same scaling). The high Ca2+ affinity biosensors Twitch-1 and
Twitch-2B showed the highest ratio values in both the atrium and ventricle, whereas lower affinity
TN-XXL and Twitch-4 exhibited lower ratio values. Figure 2B shows the average ratios over time of the
representative embryos of Figure 2A in the atrium and ventricle. The traces of Twitch-4 were less noisy
than those of the other biosensors. Thus, Twitch-4 required less smoothing than the other GECIs for
the ratio analysis and extraction of the parameters (Table S3). In addition, Twitch-4 showed the largest
relative ratio change between systole and diastole (∆R/Rdiastole = 4.8%) (Figure 2C and Table S1).
Mapping Calcium Dynamics in the Heart of Zebrafish Embryos with Ratiometric Genetically Encoded Calcium Indicators - MDPI
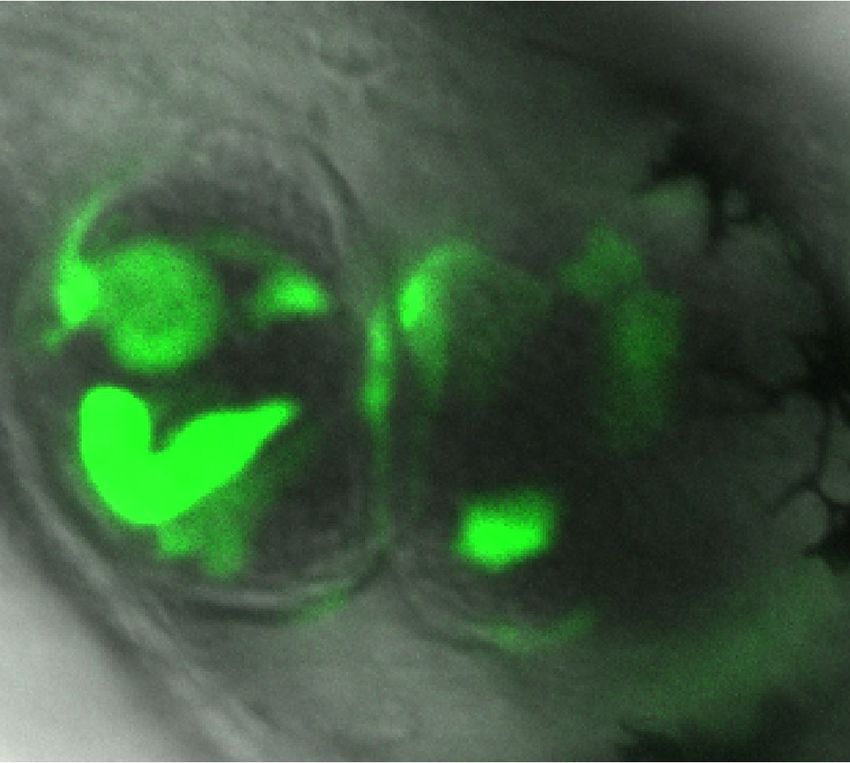
Int. J. Mol. Sci. 2020, 21, 6610                                                                                                                          6 of 22

          A                                                                                                B                 Atrium       Ventricle
                      Trans + Fluo   Donor                               FRET                      Ratio
                                                                                        30 µm                      4.4
                                                                                             6.0
                                                                                             1.0
                                                                                                                   4.3
          Twitch-1
                                                                                                                   4.2

                                                                                                           Ratio
                                                                                        0 30000
                                                                                                                   4.1
                                                                                                                   4.0
                                                                                                                   3.9

                                                                                                                         0      1              2      3
                                                                                                                                    Time (s)

                                                                                        30 µm
                                                                                             6.0
                                                                                             1.0
          Twitch-2B

                                                                                        0 10000

                                                                                        30 µm                  2.3
                                                                                             6.0
                                                                                             1.0               2.2
          Twitch-4

                                                                                        0 8000                 2.1

                                                                                                           Ratio
                                                                                                               2.0
                                                                                                               1.9
                                                                                                               1.8

                                                                                                                         0      1              2      3
                                                                                                                                    Time (s)

                                                                                        30 µm                      1.7
                                                                                             6.0
                                                                                             1.0                   1.6
          TN-XXL

                                                                                        0 10000                    1.5

                                                                                                           Ratio
                                                                                                                   1.4
                                                                                                                   1.3
                                                                                                                   1.2

                                                                                                                         0      1              2      3
                                                                                                                                    Time (s)

                                       C
                                                             12
                                             R/RDiast (%)

                                                             9

                                                             6

                                                             3

                                                             0
                                                                        -1     2B       h-4 -XXL
                                                                    itch itch-      itc
                                                                  Tw     Tw       Tw       TN

      Figure 2. Ratiometric imaging of zebrafish heart Ca2+ dynamics with TnC-based biosensors. (A) Images
      of 3 dpf embryos transiently expressing the indicated biosensors at various levels in different cells owing
      to mosaicism. The overlay of transmission and fluorescence images show the location of the atrium and
      the ventricle. Donor and FRET channel images correspond to the emission of the donor and acceptor FP,
      both excited at 440 nm. The ROIs outlined in red and white were used to quantify changes in the atrium
      and ventricle, respectively. The emission ratio image (FRET image/donor image) is shown in pseudo
      color with the same scaling applied to all biosensors to facilitate their comparison. The calibration
      squares show the distance in µm, whereas the hue codes for the emission ratio and intensity codes for
      the fluorescence intensity. Embryos were treated with PAB to decrease the heart motion. (B) The traces
      of the emission ratio over time (acquired at 50 images/s) of the embryos displayed in (A) is shown
      (unprocessed data). The ratios were seen to oscillate in synchrony with heart contractions in the atrium
      (red) and ventricle (black). (C) Percentage of ratio change between systole and diastole (%(∆R/Rdiastole ))
      obtained with each biosensor. The bars show the mean ± S.E.M, and each dot is one embryo, n = 14 to
      70 embryos of one or four independent experiments.

2.2. Ratiometric Imaging Reports Ca2+ Changes and Corrects for Motion Artifacts
     The motion during the cardiac cycle distinctly decreased by incubation with PAB, although in
most embryos the heart still showed some movement (compare Supplementary Materials Videos S1
and S2). To verify that the change in emission ratio of the biosensors was reporting Ca2+ and was
not an artifact caused by the remaining motion of the heart, we expressed a FRET construct with
no Ca2+ -binding domain, composed of ECFP and EYFP joined by a flexible linker of 16 amino acid
residues [42]. Thus, in ECFP-16aa-EYFP, all the fluorescence changes were entirely due to motion.
This construct, expressed under control of the cmlc2 promoter, also labelled heart cells in a mosaic
way (Figure 3, FRET Control). We applied the same imaging protocol as above, acquiring donor
Mapping Calcium Dynamics in the Heart of Zebrafish Embryos with Ratiometric Genetically Encoded Calcium Indicators - MDPI
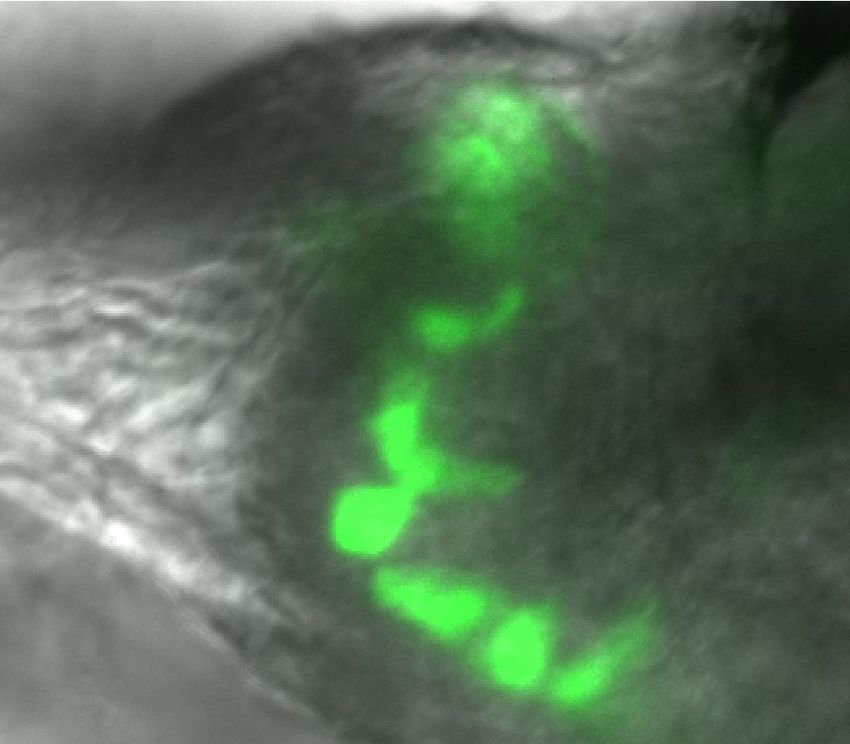
Int. J. Mol. Sci. 2020, 21, 6610                                                                                                                                                              7 of 22

and FRET images (both with donor excitation). The intensity of the donor and FRET channels of the
Ca2+ -insensitive construct was indeed altered by motion of the heart and changed in parallel during
beating, but this artifact was cancelled out in the ratio since the movement affected both emission
channels equally (Figure 3; Video S5). In contrast, Twitch-1 and Twitch-4 showed clear oscillations in
the ratio correlative with contractions in both the atrium and ventricle. The change in fluorescence
intensity of Twitch-1 and Twitch-4 in the donor and FRET channels had a motion artifact component
and a FRET change component, but the latter usually dominated over the former. Thus, the intensity
of the donor and acceptor channels changed in opposite directions in most embryos, a hallmark of
a change in FRET since the donor gets dim as energy is transferred to the acceptor. We concluded
that the ratio of Twitch biosensors, by removing the influence of motion, only left the changes in the
ratio that were Ca2+ dependent. Thus, the emission ratio changes observed with these GECIs indeed
reflected changes in free Ca2+ concentration.

                                                 Twitch-1                                             Twitch-4                                            FRET Control
                                              FRET              Ratio                          FRET                   Ratio                              FRET              Ratio

                                   1.06                                                 1.06                                                  1.06
                                                                                                                                                                        Donor      FRET
                                                                                        1.02                                                  1.02
                                                                            F/FDiast

                                                                                                                                  F/FDiast
                       F/FDiast

                                   1.02

                                   0.98                                                 0.98                                                  0.98

                                   0.94                                                 0.94                                                  0.94
           Atrium

                                          0          1              2   3                      0       1              2       3                      0          1              2          3
                                   1.10                                                 1.10                                                  1.10
                                                                            R/R Diast

                                                                                                                                  R/R Diast
                       R/R Diast

                                   1.06                                                 1.06                                                  1.06

                                   1.02                                                 1.02                                                  1.02

                                   0.98                                                 0.98                                                  0.98
                                          0          1              2   3                      0       1              2       3                      0          1              2          3
                                                         Time (s)                                          Time (s)                                                 Time (s)

                                   1.06                                                 1.06                                                  1.06
                                                                            F/FDiast

                                                                                                                                  F/FDiast
                       F/FDiast

                                   1.02                                                 1.02                                                  1.02

                                   0.98                                                 0.98                                                  0.98
           Ventricle

                                   0.94                                                 0.94                                                  0.94
                                          0          1              2   3                      0       1              2       3                      0          1              2          3
                                   1.10                                                 1.10                                                  1.10
                                                                            R/R Diast

                                                                                                                                  R/R Diast
                       R/R Diast

                                   1.06                                                 1.06                                                  1.06

                                   1.02                                                 1.02                                                  1.02

                                   0.98                                                 0.98                                                  0.98
                                          0          1              2   3                      0       1              2       3                      0          1              2          3
                                                         Time (s)                                          Time (s)                                                 Time (s)

      Figure 3. Ratiometric measurements with Twitch-1, Twitch-4, and a Ca2+ -insensitive FRET control.
      The genetically encoded Ca2+ indicators (GECIs) Twitch-1 and Twitch-4, or a FRET construct
      insensitive to Ca2+ (ECFP-16aa-EYFP), were transiently expressed in the heart of zebrafish embryos.
      Regions-of-interest (ROI) were manually drawn on the atrium (red line) and ventricle (white line).
      The normalized change in fluorescence in the donor and FRET channels (F/Fdiastole ) (upper graphs in
      atrium and ventricle) and ratio (R/Rdiastole ) (lower graphs in atrium and ventricle) over time are shown.
      Fdiastole and Rdiastole , used for normalization, were the fluorescence and ratio value of the first diastole.
      The embryos were treated with 75 µM PAB to decrease the contractions, but the hearts still retained
      some motion, which affected the intensity measurements. The FRET control showed that the emission
      ratio is largely indifferent to motion artifacts and corrected the photobleaching.

    Incidentally, ratioing also corrected the photobleaching observed in the individual fluorescence
channels of the Ca2+ -insensitive control, Twitch-1 and Twitch-4 (Figure 3). Table S2 shows the percent
photobleaching (~4.5%) of the various GECIs during 5 s of continuous illumination. Twitch-2B
Mapping Calcium Dynamics in the Heart of Zebrafish Embryos with Ratiometric Genetically Encoded Calcium Indicators - MDPI
Int. J. Mol. Sci. 2020, 21, 6610                                                                     8 of 22

showed less photobleaching than the other biosensors (~2.5%) because it is composed of different FPs
(Table 1) [24].

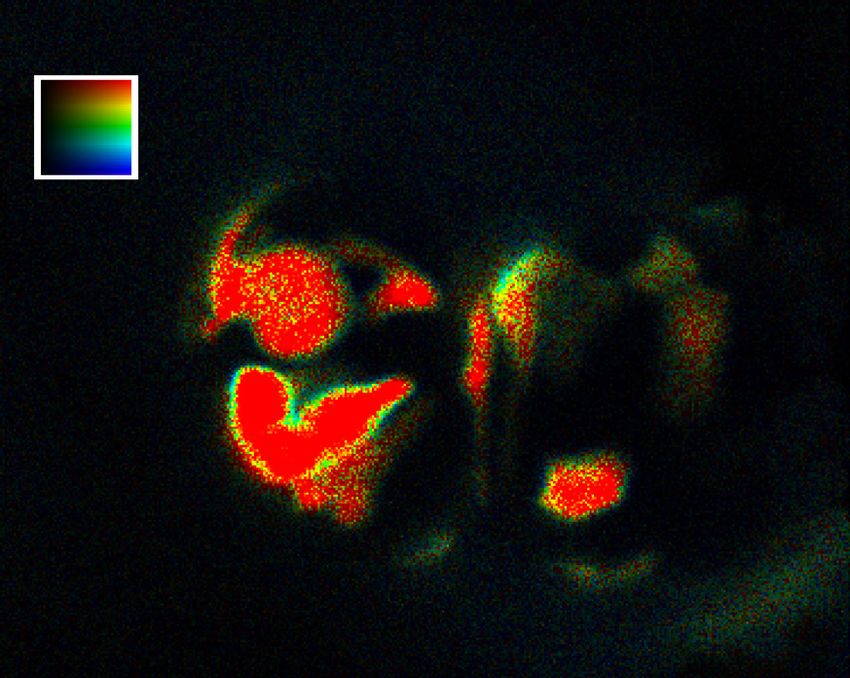
2.3. Basal Cardiac Ca2+ Kinetics Obtained with Each Biosensor
      In Figure 4 we show the parameters of the Ca2+ changes in the atrium and ventricle and the HR
extracted from the ratio time courses in embryos expressing each biosensor, as was shown in Figure 1C.
The systolic and diastolic ratio, the amplitude ∆R, and rise and decay slopes are factors that should vary
between GECIs. In contrast, the parameters which depend only on time and should be independent of
the probe are the HR, the rise time 10–90%, and the decay time 90–10% of the Ca2+ transients.
      The emission ratios were between 4 and 5 for the high Ca2+ affinity biosensors Twitch-1 and
Twitch-2B (0.25 and 0.2 µM Kd, respectively), whereas the lower affinity TN-XXL and Twitch-4 (0.8
and 2.8 µM Kd, respectively) showed ratios close to 1.4 and 2, respectively (Figure 4A and Table S5).
Whereas Twitch-2B displayed higher ratios in the ventricle than in the atrium (p = 0.027 and 0.019 for
systole and diastole, respectively), the opposite was true for Twitch-4 and TN-XXL. In Twitch-1, the
ratios in the atrium and ventricle were similar. Because of these differences between the biosensors, we
could not distinguish whether the Ca2+ levels were different in these chambers. We attempted an in
situ calibration of the ratio in terms of absolute Ca2+ concentration with a Ca2+ ionophore. Although
we observed changes in the ratios in the direction of saturation (with high extracellular Ca2+ ) and
desaturation (with EGTA), we were unable to obtain reliable Rmin and Rmax values, probably because
these compounds did not fully equilibrate the Ca2+ levels across the embryo skin and across the
plasma membrane of cardiomyocytes. The use of a Ca2+ -sensitive dye as a control does not seem
feasible either. With intensiometric dyes (like fluo-4) the heart contraction results in motion artifacts.
Furthermore, although labelling embryos might be possible with emission ratio dyes (like indo-1), we
do not envision a way to restrict labelling to the embryo heart.
      TN-XXL showed the smallest ∆R between systole and diastole, and Twitch-4 produced the largest
relative ratio change (∆R/Rdiastole ) of all the biosensors (5.5% ± 1.7 in atrium; 4.1% ± 1.3 in ventricle).
The ∆R was larger in the atrium than in the ventricle for all biosensors (Figure 4A and Table S5). While
this may indicate that the increase in free Ca2+ in the atrium was larger than that of the ventricle,
it could also have other causes. For instance, with the embryo orientation on the microscope stage
used in this study, autofluorescence of the yolk overlapped somewhat with the atrium, but not with
the ventricle, which could artifactually alter the ratio in the atrium. The autofluorescence peak was
about 550 nm, overlapping with YFP emission, as was shown in wavelength scans taken by confocal
microscopy (Figure S1A). Moreover, the fungicide methylene blue used in the E3 medium increased
the yolk autofluorescence by approximately 5–10-fold and displaced the emission peak about 20 nm,
as was shown in embryos maintained from Day 0 with or without methylene blue (Figure S1B).
      The HR was identical in the atrium and ventricle, as expected. The average HR was 216.6 ± 12.6 bpm
(n = 59 embryos with the four biosensors). Rise and decay times obtained with the various GECIs
were similar (Table S4). The shape of the Ca2+ transients differed in the atrium and ventricle, and all
GECIs showed qualitatively the same features (Figure 4B, representative traces). As described earlier
with intensiometric biosensors [25,26,43], the upstroke of the Ca2+ transient was faster in the atrium
than in the ventricle. The atrium showed a shorter rise time and longer decay time, whereas the Ca2+
transients in the ventricle were more symmetrical (rise and decay times were similar) (Figure 4A and
Table S5). Likewise, the rise slope 10–90% (in ratio units/s) was larger in the atrium than in the ventricle
for all biosensors. Zhang et al. [17] showed in patch-clamped cardiomyocytes from adult zebrafish
that Ca2+ (measured with Fluo-4) did not reach a steady value at a stimulation frequency of 1 Hz
during diastole, but it did at lower frequencies. Thus, there was an increase in diastolic Ca2+ levels at
higher stimulation frequencies. At the relatively fast HR that we observed in 3 dpf embryos, neither
the atrium nor the ventricle showed a stable Ca2+ baseline between heart beats (Figures 2 and 3).
Mapping Calcium Dynamics in the Heart of Zebrafish Embryos with Ratiometric Genetically Encoded Calcium Indicators - MDPI
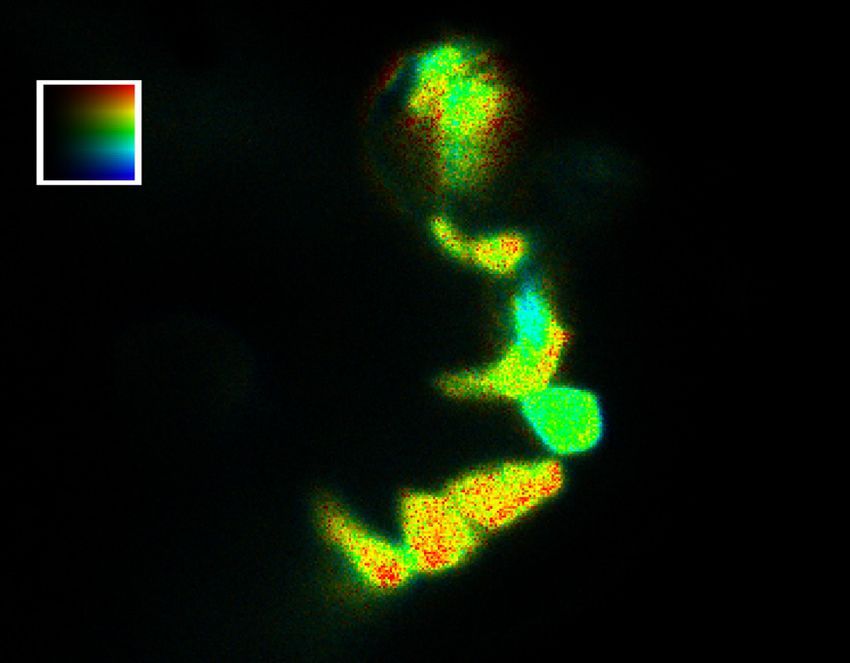
Int. J. Mol. Sci. 2020, 21, 6610                                                                                                                                                                                                                                                  9 of 22

                             A                      Systolic       Diastolic                Amplitude               Heart rate              Rise time          Decay time                 Rise slope Decay slope   B                 Representative trace
                                                     ratio           ratio                 (RSyst-RDiast)                                   (10-90%)            (90-10%)                  (10-90%)    (90-10%)                            Atrium     Ventricle

                                                8              8                    0.30                      280                    0.20               0.20                          4             4                               3.8                     3.97
                                                                                    0.25         *                                                                                           ***
                                                6              6                                              240                    0.15               0.15                          3             3
                                                                                                                                                                   ***
                                                                                    0.20

                            Twitch-1

                                                                                                                                                                                                                                                                    Ratio (VT)
                                                                                                                                                                                                                    Ratio (AT)
                                                                                                              200                                                                                                                   3.7                     3.87

                                                                                                                                                                            Ratio/s
                                                                                                                                               ***

                                        Ratio

                                                                                                        BPM
                                                4              4                    0.15                                             0.10               0.10                          2             2

                                                                               ∆R

                                                                                                                                 s
                                                                                                              160
                                                                                    0.10
                                                2              2                                                                     0.05               0.05                          1             1                               3.6                     3.77
                                                                                    0.05                      120
                                                0              0                    0.00                       80                    0.00               0.00                          0             0
                                                                                                                                                                                                                                    3.5                      3.67
                                                                                                                                                                                                                                       0.0    0.1   0.2   0.3
                                                     AT VT          AT VT                     AT VT                   AT VT                   AT VT              AT VT                      AT VT       AT VT
                                                                                                                                                                                                                                              Time (s)

                                                8              8                    0.30                      280                    0.20               0.20                          4             4                               6.0                     7.0
                                                       *               *                                                                                                                      **
                                                                                    0.25                      240
                                                6              6                                 *                                   0.15               0.15       **                 3             3
                            Twitch-2B

                                                                                    0.20

                                                                                                                                                                                                                                                                    Ratio (VT)
                                                                                                                                                                                                                      Ratio (AT)
                                                                                                              200                                                                                                                   5.8                     6.8

                                                                                                                                                                            Ratio/s
                                                                                                                                                *
                                        Ratio

                                                                                                        BPM
                                                4              4                    0.15                                             0.10               0.10                          2             2

                                                                               ∆R

                                                                                                                                 s
                                                                                                              160
                                                                                    0.10                                                                                                                                            5.6                     6.6
                                                2              2                                              120                    0.05               0.05                          1             1
                                                                                    0.05
                                                0              0                    0.00                       80                    0.00               0.00                          0             0                               5.4                      6.4
                                                                                                                                                                                                                                       0.0    0.1   0.2   0.3
                                                     AT VT          AT VT                     AT VT                   AT VT                   AT VT              AT VT                      AT VT       AT VT                                 Time (s)

                                                8              8                    0.30                      280                    0.20               0.20                          4             4                              2.25                      2.19
                                                                                                                                                                                             ****
                                                                                    0.25                      240                                                 ****
                                                6              6                                ****                                 0.15               0.15                          3             3
                                                                                    0.20
                            Twitch-4

                                                                                                                                                                                                                                                                    Ratio (VT)
                                                                                                                                                                                                                   Ratio (AT)
                                                                                                              200                              ****                                                                                2.15                      2.09

                                                                                                                                                                            Ratio/s
                                        Ratio

                                                                                                        BPM
                                                4     ****     4     ****           0.15                                             0.10               0.10                          2             2
                                                                               ∆R

                                                                                                                                 s
                                                                                                              160
                                                                                    0.10
                                                2              2                                                                     0.05               0.05                          1             1                              2.05                      1.99
                                                                                    0.05                      120
                                                0              0                    0.00                       80                    0.00               0.00                          0             0
                                                                                                                                                                                                                                   1.95                      1.89
                                                                                                                                                                                                                                       0.0    0.1   0.2   0.3
                                                     AT VT          AT VT                     AT VT                   AT VT                   AT VT              AT VT                      AT VT       AT VT
                                                                                                                                                                                                                                              Time (s)

                                                8              8                    0.30                      280                    0.20               0.20                          4             4
                                                                                                                                                                                                                                   1.60                     1.37
                                                                                    0.25                      240
                                                6              6                                                                     0.15               0.15                          3             3                              1.58                     1.35
                                                                                    0.20                                                                                                      *
                            TN-XXL

                                                                                                              200

                                                                                                                                                                                                                                                                     Ratio (VT)
                                                                                                                                                                                                                   Ratio (AT)
                                                                                                                                                                            Ratio/s
                                        Ratio

                                                                                                        BPM

                                                4              4                    0.15         *                                   0.10               0.10                          2             2                              1.56                     1.33
                                                                               ∆R

                                                                                                                                 s
                                                                                                              160                                                                                         *
                                                        *              *            0.10                                                                                                                                           1.54                     1.31
                                                2              2                                              120                    0.05               0.05                          1             1
                                                                                    0.05
                                                                                                                                                                                                                                   1.52                     1.29
                                                0              0                    0.00                       80                    0.00               0.00                          0             0
                                                                                                                                                                                                                                   1.50                      1.27
                                                     AT VT          AT VT                     AT VT                   AT VT                   AT VT              AT VT                      AT VT       AT VT                          0.0    0.1   0.2   0.3
                                                                                                                                                                                                                                              Time (s)

      Figure 4. Basal cardiac Ca2+ kinetics obtained with each biosensor. (A) Several kinetic parameters of Ca2+ changes in the atrium (red) and the ventricle (gray) in 3 dpf
      zebrafish embryos were extracted with custom routines written in Igor Pro 8 software (see Methods and Figure 1 for definition of each parameter). The bars show the
      mean ± S.E.M and each dot represents one embryo, n = 7 to 35 embryos of one or four independent experiments. A paired Student’s t-test was used (* p < 0.05,
      ** p < 0.01, *** p < 0.001, **** p < 0.0001). (B) The shape of the Ca2+ transients in the atrium (red) and the ventricle (gray) during contractions of a representative embryo
      for each GECI is shown. The traces were aligned at the start of each peak in both the atrium and ventricle, thus the delay in ventricular versus atrial Ca2+ rise is not
      shown. Note the different ratio scales for the atrium (AT) and ventricle (VT).
Mapping Calcium Dynamics in the Heart of Zebrafish Embryos with Ratiometric Genetically Encoded Calcium Indicators - MDPI
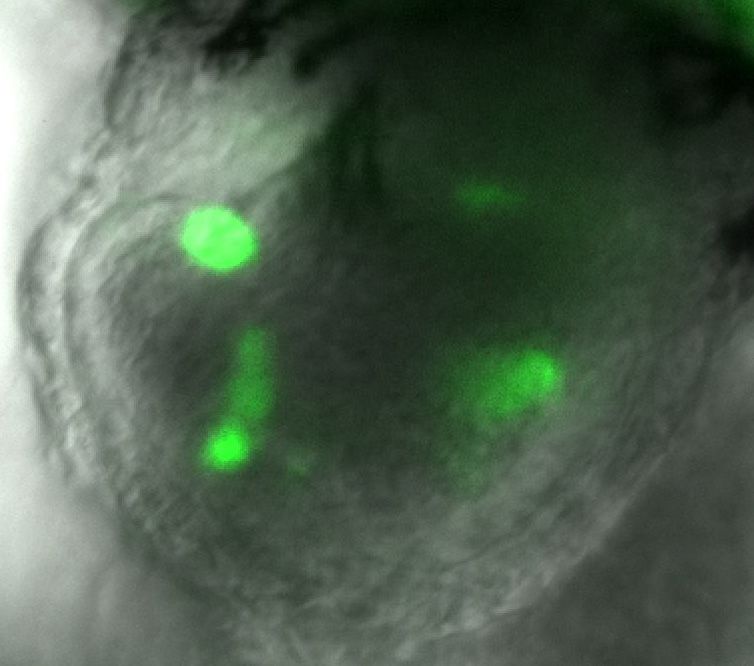
Int. J. Mol. Sci. 2020, 21, 6610                                                                     10 of 22

     To sum up, the measurements in Figure 4 provided a detailed characterization of the Ca2+
dynamics in the embryo heart and showed that the biological findings were reproducible with the
various probes, with some differences attributed to their dissimilar properties, such as Ca2+ affinity.
These experiments provided the control values to be compared with the effects of drugs affecting
heart function.

2.4. Influence of GECI Overexpression on Ca2+ Transients and on Functional Parameters of the Heart
      We tested whether expression of GECI caused Ca2+ buffering in heart cells, possibly blunting the
Ca2+ transients, or other deleterious effects. As Twitch-1 and Twitch-4 share the same fluorophores and
were expressed under the same promoter, their concentrations in the heart cells would be expected to
be similar in embryos injected with their respective cDNAs.
      The biosensor concentration differs between cells when they are expressed transiently, which
can be a source of ratio variability and might explain the dispersion in ∆R observed in Figure 4. We
deliberately chose embryos with large differences in expression levels between cells, as estimated by
YFP fluorescence (excited directly). Cells with higher Twitch-4 expression levels exhibited lower ratio
changes during systole than dimmer neighbors, particularly in the ventricle, where cells were more
fluorescent than in the atrium (Figure 5A, representative experiment). The dot plots in Figure 5B show
that there was an inverse relationship between the concentration of Twitch-1 and Twitch-4 in different
cells and their relative ratio change during systole (% ∆R/Rdiastole ): the higher the concentration of
biosensor, the lower the systolic ratio change. This suggested blunted Ca2+ transients caused by
buffering by the GECI (exogenous buffer) and/or less biosensor molecules exchanging Ca2+ ions in
cells with high expression of the probes [23]. Other options can give rise to the same phenomenon.
For example, overexpression could result in poorly folded proteins with Ca2+ -insensitive fluorescence,
or proteins that bind to intracellular components and lose sensitivity to Ca2+ . In either case, that would
result in a greater fluorescence background and less ∆R. It is difficult to distinguish between these two
causes. If it were buffering one would expect the heart contraction and the kinetics of the oscillations
to be altered and that did not seem to occur; if it were unfolded proteins, it should not.
      In addition, the emission ratio of Twitch-1 increased with the expression level of the biosensor,
an effect which was not observed in Twitch-4-expressing embryos (Figure 5C). This effect might be
explained by intermolecular FRET in embryos expressing high concentration of Twitch-1, but it is
nevertheless a puzzling observation, since the two GECIs are composed of the same FPs (Table 1) [24].
We consider that, in transgenic zebrafish expressing Twitch-1, the levels of the biosensor will be uniform
between cells and this effect will be of little practical importance.
      In conclusion, from the standpoint of the possible interference of GECI expression on the
physiological Ca2+ transients, the lower the biosensor concentration compared to that of the endogenous
buffers and the more homogeneous the level of expression, the better. However, a different aim would
be to adjust the GECI expression levels to maximize the SNR in Ca2+ imaging studies. Rose et al.
showed that the SNR of a biosensor is greatest at concentrations where the buffering capacities (k) of the
exogenous and endogenous buffers are equal (kendogenous = kbiosensor ) [23]. In practice, a compromise must
be reached between less interference with physiological Ca2+ signaling (Figure 5B) and optimization of
the SNR. The biosensor concentration of TN-XXL in the heart of a transgenic mouse was found to be
between 2.5 and 6 µM [34].
Int. J. Mol. Sci. 2020, 21, 6610                                                                                                   11 of 22

   A                                   Twitch-4
    FRET

                                          Ratio
   B                                                                   C
                10                                                             7
                                                                                       R 2 =0.438                             Tw1 Syst
                                                      Twitch-1                 6       R 2 =0.488                             Tw1 Diast
                       8                              Twitch-4
                                                                               5                                              Tw4 Syst
       ΔR/RDiast (%)

                                                                                                                              Tw4 Diast
                       6                                                       4

                                                                       Ratio
                       4                            R 2 =0.517                 3
                                                    R 2 =0.386                                                             R 2 =0.044
                                                                               2
                       2                                                                                                   R 2 =0.014
                                                                               1
                       0                                                       0
                           0    100           200                300               1                 10           100         1000
                               YFP Intensity x 1000                                                 YFP intensity x 1000

       Figure 5. Effect of the expression level of the biosensors on the emission ratio and on the systolic ratio
       change (∆R). (A) A representative experiment with variable expression of Twitch-4 between cells in
       the ventricle is shown (left, fluorescence intensity image of the FRET channel; right, ratio image in
       pseudo color). Regions-of-interest (ROI) were manually drawn on cells expressing increasing levels of
       biosensor (from yellow to green, blue and red). The color-coded traces in the graph correspond to the
       cells in the images. (B) Dependence of the relative ratio change (%[∆R/Rdiastole ]) on the expression level
       of Twitch-1 and Twitch-4 in the ventricle, estimated as the fluorescence intensity of directly excited YFP.
       Each dot represents one cell in 11 to 13 embryos of three independent experiments. Data were adjusted
       to an exponential model (for Twitch-1: r = −0.621, R2 = 0.386, p < 0.0001, n = 41; for Twitch-4: r = −0.719,
       R2 = 0.517, p < 0.0001, n = 56). (C) Effect of biosensor concentration (estimated by YFP fluorescence) on
       the emission ratio of Twitch-1 and Twitch-4, in systole and diastole (logarithmic scale). Data of Twitch-1
       were adjusted to a logarithmic model (for Rsystole : r = 0.662, R2 = 0.438, p < 0.0001, n = 77; for Rdiastole :
       r = 0.699, R2 = 0.488, p < 0.0001, n = 77); the Twitch-4 ratio data did not correlate with YFP intensity.

     As mentioned in the Introduction, expression of biosensors composed of troponin C might
potentially alter functional parameters such as the force of the cardiac contractions. To estimate the
strength of the ventricular beats, we measured the ventricular fractional area change, equivalent to
the clinically relevant ejection fraction. The HR and the fractional area change were estimated by
transmitted light in beating hearts not treated with PAB. They did not change significantly between
the control and Twitch-4-expressing embryos (Figure S2A). Thus, the expression of Twitch-4 in some
ventricular myocytes (mosaic expression, Figure 2) did not affect the HR and cardiac contractility.

2.5. Effect of an L-Type Ca2+ Channel Blocker on Ca2+ Transients in the Zebrafish Heart
     To determine whether these GECIs were useful to gauge the effect of drugs on heart Ca2+ , we
tested their response to well-known pharmacological agents acting on the heart, the LTCC blocker
nifedipine and the β-adrenergic antagonist propranolol.
     LTCCs are the major inward currents during the action potential plateau in human adult
cardiomyocytes. Activators of these channels prolong the action potential duration and the QT interval
of the electrocardiogram, whereas blockers have the opposite effect. In contrast to humans, various
Int. J. Mol. Sci. 2020, 21, 6610                                                                  12 of 22

Ca2+ influx routes have been described in the zebrafish heart: LTCCs (Cav1.2 and 1.3 channels), T-type
Ca2+ channels (TTCC, Cav3.1 and 3.2), and the NCX working in reverse mode [5,11,16,17].
      We used the channel blocker nifedipine in Twitch-4-expressing embryos to determine the
contribution of LTCC to Ca2+ changes in 3 dpf zebrafish embryos. As expected for a Ca2+ channel
blocker, the Ca2+ levels decreased dose-dependently by incubation with nifedipine in both the atrium
and ventricle (Figure 6A and Table S6, average ratio). The decrease in ∆R of the systolic Ca2+ rise
was very significant, particularly in the atrium. Likewise, the HR decreased dose-dependently with
nifedipine in both chambers. Atrial beating stopped altogether in embryos treated with 100 µM
nifedipine (Figure 6D). Because of the lower HR, the decay time 90–10% of the Ca2+ transients increased
in both chambers, but the rise time 10–90% did not change. Since ∆R decreased, the rise and decay
slopes also decreased dose-dependently. It is worth noting that the concentrations of drugs indicated
are those in the bath over the agarose layer embedding the embryos (Figure 1A). It takes time for
drugs to diffuse through the agarose and several cell layers and thus the final concentration of the drug
reaching the heart is not known. The solvent DMSO at the highest concentration used in his study
(1%) did not change the kinetic parameters of the Ca2+ transients (Table S10), except for the ventricle
rise slope.
      Since nifedipine, even at low concentrations, decreased the Ca2+ levels, it should influence the
force of contraction, which depends on the amount of Ca2+ bound to troponin. Nifedipine at 5
and 20 µM markedly decreased the HR and the ventricular fractional area change (Figure 6C and
Table S8). Thus, in this model there was a functional effect of the inhibition of the Ca2+ transients by
the channel blocker.
      Some embryos stopped atrial beating altogether with 100 µM nifedipine and Ca2+ levels stopped
oscillating. This provided an opportunity to estimate the SNR of the Ca2+ changes in the absence of
drugs, taking as background noise the S.D. of the stable reading in the atrium after nifedipine for each
biosensor (Figure 6D) (see Methods). Under these conditions, the SNR (∆R/S.D.background ) of Twitch-1
was found to be 28.6 ± 8.3 in the atrium and 18.4 ± 7.7 in the ventricle (mean ± S.D.). That of Twitch-2B
was 14.2 ± 5 in the atrium and 9.6 ± 1.2 in the ventricle. The SNR of Twitch-4 was 16.8 ± 5.5 in the
atrium and 11.4 ± 3.9 in the ventricle, whereas for TN-XXL it was 16.9 ± 13.3 in the atrium and 5.7 ± 4.1
in the ventricle. Thus, Twitch-1 provided the best SNR of the studied GECIs, followed by Twitch-4.

2.6. Effect of a β-Adrenergic Antagonist on Ca2+ Transients in the Zebrafish Heart
     Embryos at 3-5 dpf have been shown to respond to β adrenoreceptor ligands and demonstrate
an adrenergic tone at 5 dpf, whereas the vagal (cholinergic) input matures later during
development [25,44,45]. The stimulation of β1 adrenoreceptors has a positive chronotropic effect
on the zebrafish heart whereas cholinergic receptors slow down the HR. Thus, the HR of 3 dpf embryos
is about 210 bpm (this work) compared to 120–130 bpm in the adult [44].
     We tested the effect of the β-adrenergic antagonist propranolol in embryos transiently expressing
Twitch-4. Propranolol at 1 and 10 µM did not have a significant effect on any of the measured
parameters. At 100 µM (1 h), it decreased the HR by 14% and decreased the systolic and diastolic Ca2+
levels in both chambers but did not affect the ∆R (Figure 7 and Table S9). It also increased the rise
and decay time of the Ca2+ transients and decreased the rise and decay slopes in both the atrium and
ventricle. To find out whether biosensor expression could alter the effects of a drug such as propranolol
on the heart, the HR was measured in the control and Twitch-4-expressing embryos by transmitted
light. The effect of propranolol (100 µM) on the HR was similar in the uninjected control embryos and
in those expressing Twitch-4 (Figure S2B).
Int. J. Mol. Sci. 2020, 21, 6610                                                                                                                                                                                                                                                                                                                                                              13 of 22

                                                                                                                 Amplitude
                           A                                      Average ratio                                 (RSyst-RDiast)                                      Heart rate
                                                                                                                                                                                                              Rise time
                                                                                                                                                                                                              (10-90%)
                                                                                                                                                                                                                                                                           Decay time
                                                                                                                                                                                                                                                                            (90-10%)
                                                                                                                                                                                                                                                                                                                                           Rise slope
                                                                                                                                                                                                                                                                                                                                           (10-90%)
                                                                                                                                                                                                                                                                                                                                                                    Decay slope
                                                                                                                                                                                                                                                                                                                                                                     (90-10%)
                                                           3.0                                   0.25                                          280
                                                                                                                                                                          ***                  0.30                                        0.30                                                                 3.0                           ***            3.0
                                                                  *      ***     ****                                                                                                                                                                                                                                                  *
                                                           2.5                                   0.20
                                                                                                               *                               240            *                                0.25                                        0.25                            *                                    2.5                                          2.5
                                                                                                                     ****                                                                                                                                                          *

                                       Atrium
                                                           2.0                                                                                                                                 0.20                                        0.20                                                                 2.0                                          2.0
                                                                                                 0.15                                          200                                                                                                                                                                                                                  *      ****

                                                                                                                                                                                                                                                                                                      Ratio/s
                                                   Ratio

                                                                                                                                         BPM
                                                           1.5                                                                                                                                 0.15                                        0.15                                                                 1.5                                          1.5

                                                                                         ∆R

                                                                                                                                                                                         s
                                                                                                 0.10                                          160
                                                           1.0                                                                                                                                 0.10                                        0.10                                                                 1.0                                          1.0
                                                           0.5                                   0.05                                          120                                             0.05                                        0.05                                                                 0.5                                          0.5
                       Twitch-4                            0.0                                   0.00                                              80                                          0.00                                        0.00                                                                 0.0                                          0.0

                                                                 0h 1h   0h 1h   0h 1h                    0h 1h 0h 1h                                     0h 1h        0h 1h                               0h 1h    0h 1h                                              0h 1h     0h 1h                                               0h 1h   0h 1h                 0h 1h   0h 1h
                                                                  1μM    10μM    100μM                     1μM  10μM                                       1μM         10μM                                 1μM     10μM                                                1μM      10μM                                                 1μM    10μM                   1μM    10μM

                                                           3.0
                                                                          **
                                                                                                 0.25                                          280
                                                                                                                                                                *         **       **          0.30                                        0.30
                                                                                                                                                                                                                                                                                            *                   3.0                                          3.0
                                                           2.5    *               ***            0.20
                                                                                                                                               240                                             0.25                                        0.25                                                                 2.5
                                                                                                                                                                                                                                                                                                                                                       **
                                                                                                                                                                                                                                                                                                                                                             2.5
                                       Ventricle

                                                           2.0
                                                                                                 0.15
                                                                                                                                **             200                                             0.20                                        0.20                            *       **                           2.0                                          2.0
                                                                                                                                                                                                                                                                                                                                                                                      ***

                                                                                                                                                                                                                                                                                                      Ratio/s
                                                                                                                         *                     160
                                                                                                                                                                                                                                                                                                                                                                     *       **
                                                   Ratio

                                                                                                                                         BPM
                                                           1.5                                                                                                                                 0.15                                        0.15                                                                 1.5                            *             1.5

                                                                                         ∆R
                                                                                                                                               120

                                                                                                                                                                                         s
                                                                                                 0.10
                                                           1.0                                                                                  80                                             0.10                                        0.10                                                                 1.0                                          1.0
                                                           0.5                                   0.05                                                                                          0.05                                        0.05                                                                 0.5                                          0.5
                                                                                                                                                40
                                                           0.0                                   0.00                                            0                                             0.00                                        0.00                                                                 0.0                                          0.0

                                                                 0h 1h   0h 1h   0h 1h                    0h 1h 0h 1h 0h 1h                                0h 1h       0h 1h     0h 1h                     0h 1h    0h 1h   0h 1h                                     0h 1h      0h 1h    0h 1h                                      0h 1h   0h 1h   0h 1h         0h 1h   0h 1h     0h 1h
                                                                  1μM    10μM    100μM                     1μM  10μM 100μM                                  1μM        10μM      100μM                      1μM     10μM    100μM                                      1μM       10μM     100μM                                       1μM    10μM    100μM          1μM    10μM      100μM

                           B                                          Twitch-1                             Twitch-2B                                          TN-XXL                      C                                                                                                                     D
                                                             6
                                                                         ****                    8                                           2.0                     **                                                                                                                                                                     Twitch-4                Atrium        Ventricle
                                                             5
                                                                                  **             7                 ***                                    *
                                                                                                 6       ***                                 1.5                                                                   Control (E3)                            5 µM                20 µM
                                                             4
                                       Atrium

                                                                                                 5
                                                   Ratio

                                                                                         Ratio

                                                                                                                                     Ratio
                                                             3                                   4                                           1.0                                               280                                                               50

                                                                                                                                                                                                                                                                                                                  Baseline
                                                                                                 3                                                                                                                                                                    *
                                                             2
                                                                                                 2                                           0.5

                                                                                                                                                                                                                                    Fractional area change (%)
                                                                                                                                                                                                      ns
                                                             1                                   1                                                                                             240                                                               40
                       Average ratio

                                                             0                                   0                                           0.0
                                                                                                                                                                                                      ns
                                                                                                                                                                                               200                                                               30   ns
                                                                 0h 1h   0h 1h 0h 1h                    0h 1h      0h 1h     0h 1h                      0h 1h       0h 1h      0h 1h

                                                                                                                                                                                         BPM
                                                                                                                                                                                                                                                                                   **           **
                                                                  1μM    10μM 100μM                      1μM       10μM      100μM                       1μM        10μM       100μM                                         ****
                                                                                                                                                                                               160                 ****
                                                                                                                                                                                                                                                                 20

                                                             6
                                                                  *        *       *
                                                                                                 8                 ***        **             2.0
                                                                                                                                                                      *
                                                                                                                                                                                                                   ****

                                                                                                                                                                                                                                                                                                                  Nifedipine 100μM
                                                             5                                   7
                                                                                                         **                                               *                                    120                            ***                                10
                                                                                                                                                                                                                                                                                   **           ***
                                       Ventricle

                                                                                                 6                                           1.5
                                                             4                                   5
                                                                                                                                                                                                80                                                                0
                                                   Ratio

                                                                                         Ratio

                                                                                                                                     Ratio

                                                             3                                   4                                           1.0
                                                                                                                                                                                                      0             1         2                                       0            1            2
                                                             2                                   3
                                                                                                 2                                           0.5                                                              Time (h)                                                         Time (h)
                                                             1                                   1
                                                             0                                   0                                           0.0

                                                                 0h 1h   0h 1h 0h 1h                    0h 1h      0h 1h     0h 1h                      0h 1h       0h 1h      0h 1h
                                                                  1μM    10μM 100μM                      1μM       10μM      100μM                       1μM        10μM       100μM

      Figure 6. Effect of the L-type Ca2+ channel blocker nifedipine on heart Ca2+ levels measured with Twitch and TN-XXL biosensors. (A) Ca2+ kinetic parameters were
      measured in 3 dpf zebrafish embryos expressing Twitch-4 in the heart, before and after 1 h incubation with 1, 10, and 100 µM nifedipine. Different embryos were used
      for each nifedipine concentration. A paired Student’s t-test was used (* p < 0.05, ** p < 0.01, *** p < 0.001, **** p < 0.0001). (B) Average of the systolic and diastolic ratio
      values obtained in 3 dpf embryos expressing Twitch-1, Twitch-2, and TN-XXL, before and after 1 h incubation with 1, 10, and 100 µM nifedipine. Data are shown as the
      mean ± S.E.M., n = 3 to 6 embryos for each concentration, from one or two independent experiments. A paired Student’s t-test was used (* p < 0.05, ** p < 0.01,
      *** p < 0.001, **** p < 0.0001). (C) HR and fractional area change in uninjected embryos incubated with 5 and 20 µM nifedipine compared to control. These embryos
      were not incubated with PAB. Data are shown as the mean ± S.E.M., n = 3 to 4 embryos for each group, from one independent experiment. An unpaired Student’s
      t-test was used to compare each treatment with the control (* p < 0.05, ** p < 0.01, *** p < 0.001, **** p < 0.0001). (D) A representative embryo in which treatment with
Int. J. Mol. Sci. 2020, 21, 6610                                                                                                                                                                                                                   14 of 22

        100 µM nifedipine (bottom image and graph) decreased the Ca2+ levels and completely abrogated the contractions in the atrium. Regions-of-interest (ROI) were
        manually drawn on the atrium (red line) and ventricle (white line).The effect of nifedipine on the average ratio was more pronounced with the high affinity
        biosensors Twitch-1 and Twitch-2B than with the lower affinity Twitch-4 or TN-XXL, even at 1 and 10 µM nifedipine (Figure 6B and Table S7). At Ca2+ levels
        comparable to the Kd, the fractions of Ca2+ -bound and free biosensor are most sensitive to Ca2+ . Thus, despite Twitch-4 generally providing a more robust reading
        of Ca2+ (larger ∆R/Rdiastole , less smoothing), in some cases the higher affinity GECIs may be advantageous.

                                   A                                                                                                                                            Atrium                                     Ventricle
                                                Trans + Fluo                                Baseline                    Propranolol 100µM
                                                                                                                                                                     Baseline     Propranolol 100µM                Baseline    Propranolol 100µM

                                   B                              Systolic
                                                                   ratio
                                                                                   Diastolic
                                                                                     ratio
                                                                                                            Amplitude
                                                                                                           (RSyst-RDiast)
                                                                                                                                        Heart rate              Rise time
                                                                                                                                                                (10-90%)
                                                                                                                                                                                   Decay time
                                                                                                                                                                                    (90-10%)
                                                                                                                                                                                                                  Rise slope
                                                                                                                                                                                                                  (10-90%)
                                                                                                                                                                                                                                     Decay slope
                                                                                                                                                                                                                                      (90-10%)

                                                            3.0              3.0                    0.20                          280                    0.20               0.20                            3.0       *        3.0
                                                                                                                 ns
                                                                                                                                           ****                                          ****
                                                            2.5              2.5                                                  240                                                                       2.5                2.5
                                                                    ****             ****           0.15                                                 0.15               0.15
                                               1h

                                                            2.0              2.0                                                                                    *                                       2.0                2.0
                                   Atrium

                                                                                                                                  200

                                                                                                                                                                                                  Ratio/s
                                                    Ratio

                                                                                                                                                                                                                                         ****

                                                                                                                            BPM
                                                            1.5              1.5                    0.10                                                 0.10               0.10                            1.5                1.5
                                                                                               ∆R

                                                                                                                                                     s
                                                                                                                                  160
                                               0h

                                                            1.0              1.0                                                                                                                            1.0                1.0
                                                                                                    0.05                          120                    0.05               0.05
                                                            0.5              0.5                                                                                                                            0.5                0.5
                                                            0.0              0.0                    0.00                           80                    0.00               0.00                            0.0                0.0

                                                            3.0              3.0                    0.20                          280                    0.20               0.20                            3.0                3.0
                                                            2.5              2.5                                                           ****                                          ****               2.5                2.5
                                                                    ****                            0.15                          240                    0.15               0.15
                                                                                     ****
                                               1h

                                                                                                                                                                    **
                                   Ventricle

                                                            2.0              2.0                                 ns                                                                                         2.0       **       2.0
                                                                                                                                  200

                                                                                                                                                                                                  Ratio/s
                                                    Ratio

                                                                                                                            BPM

                                                            1.5              1.5                    0.10                                                 0.10               0.10                            1.5                1.5       ****
                                                                                               ∆R

                                                                                                                                                     s
                                                                                                                                  160
                                               0h

                                                            1.0              1.0                                                                                                                            1.0                1.0
                                                                                                    0.05                          120                    0.05               0.05
                                                            0.5              0.5                                                                                                                            0.5                0.5
                                                            0.0              0.0                    0.00                           80                    0.00               0.00                            0.0                0.0

      Figure 7. In vivo Ca2+ kinetics in the heart of Twitch-4-expressing embryos in response to propranolol. Imaging was performed before and after 1 h incubation with
      100 µM propranolol in 3 dpf zebrafish embryos expressing Twitch-4 in the heart. (A) Overlay of transmitted light and fluorescence in a representative experiment (left
      image). The corresponding emission ratio images are shown in pseudo color before (middle) and after (right) 1 h incubation with propranolol. ROIs were drawn to
      delimit fluorescent cells in the atrium (red) and ventricle (white). The graphs show the oscillations of Ca2+ in the atrium and ventricle before and after propranolol.
      (B) Effect of propranolol on the kinetic parameters of the cardiac Ca2+ transients. Data are shown as the mean ± S.E.M., n = 11 and 13 embryos for atrium and ventricle,
      respectively, from two independent experiments. A paired Student’s t-test was used (* p < 0.05, ** p < 0.01, **** p < 0.0001, n.s. not significant).
Int. J. Mol. Sci. 2020, 21, 6610                                                                 15 of 22

3. Discussion
     In this work, we evaluated the usefulness of TN-XXL and Twitch GECIs to measure the Ca2+
levels in the heart of zebrafish embryos. The study revealed the benefits and drawbacks of each probe
and served to assess which of them would be expected to perform better in a transgenic model for
applications such as drug screening and pathophysiological studies of the heart.
     We demonstrated that ratio measurements are well suited to correct for motion artifacts in a moving
organ like the developing zebrafish heart, unlike single wavelength GECIs, which require complete
blocking of the contractions, since the contribution of Ca2+ and motion to the fluorescence change
cannot be separated from one another. In previous studies with intensiometric biosensors, contraction
was prevented with morpholino oligomers targeted against tnnt2a (“silent heart” morpholino) or
by using the myosin inhibitors 2,3-butanedione monoxime, blebbistatin, or PAB [6,25,43]. Although
we used the non-fluorescent myosin inhibitor PAB to facilitate quantification in user-defined ROIs,
heart contraction was not completely blocked (compare Videos S1 and S2). We ruled out that the
observed changes in the emission ratio during contraction were caused by residual motion of the
heart by using a FRET construct insensitive to Ca2+ : while donor and FRET channel fluorescence
were affected by movement, the fluorescence ratio was not (Figure 3). Thus, TN-XXL and Twitch
GECIs reported fluctuating Ca2+ levels during the heart cycle, supporting the value of ratio imaging in
moving specimens [23,27]. Compared to intensiometric GECIs, ratiometric biosensors provide the
advantage of registering heart activity in a more physiological way. In a previous publication we
observed that the Ca2+ changes during skeletal muscle contractions in zebrafish embryos expressing
Twitch-4 were similar to those observed with the Ca2+ photoprotein GFP-aequorin [46]. In an earlier
report, ratiometric voltage biosensors adequately corrected the movement artifacts in zebrafish [47].
     The mosaicism caused by transient expression of the probes resulted in large differences in their
concentration among cells. This allowed us to examine whether the biosensors, as exogenous buffers
of Ca2+ , interfered with the Ca2+ signals. When their buffering power exceeds that of the endogenous
buffers, the Ca2+ biosensors may interfere with and slow down the physiological events triggered
by the Ca2+ [23,29–31]. The ratio changes were inversely related to the biosensor brightness of a cell,
taken as a proxy for the expression level. This could be caused by Ca2+ buffering in cells expressing
high levels of GECIs for both low and high affinity probes, particularly in the ventricle (Figure 5).
Alternatively, poorly folded proteins and/or Ca2+ -insensitive biosensors as a result of overexpression
could result in the same effect. Other potential deleterious off-target effects of biosensor expression
were searched for. The mosaic expression of Twitch-4 in some cardiomyocytes did not affect the
ventricular fractional area change during systole, an estimate of the force of contraction (Figure S2A).
However, this will have to be re-evaluated in a stable expression model in which all cells express the
biosensor. A gene profiling study in transgenic mice expressing TN-XXL demonstrated mild signatures
of biosensor expression, but did not result in a regulation of endogenous Ca2+ buffers [34]. Notably,
cardiomegaly was observed, an effect which should be investigated in transgenic zebrafish expressing
Twitch biosensors.
     We wrote routines in Igor Pro to automatically analyze the raw ratio values over time and extracted
quantitative parameters to characterize the kinetics of the Ca2+ changes (Figure 4). The GECIs examined
were able to detect changes in these parameters induced by an LTCC blocker and by a β-adrenergic
antagonist (Figures 6 and 7). As expected for an LTCC blocker, nifedipine decreased the HR, likely
reflecting an effect on the pacemaker, as well as the amplitude of the systolic Ca2+ rise (∆R). Since
the cytoplasmic Ca2+ levels are tightly linked with the force of contraction, nifedipine decreased the
fractional area change (Figure 6C).
     In nifedipine-treated embryos, ∆R and the HR decreased much more in the atrium than in the
ventricle (Figure 6A). Thus, 100 µM nifedipine caused arrest of the atrial Ca2+ changes and contraction,
while the ventricle continued to beat at a slower pace (Figure 6D). Presumably it was excited from the
sinoatrial node along the conduction system, or there could be a ventricular pace, since a pacemaker If
current has been observed in the ventricle when the atrial action potentials were inhibited or there was
Int. J. Mol. Sci. 2020, 21, 6610                                                                   16 of 22

an AV block [25,43]. The arrest of atrial contraction may be due to different expression or function
of the LTCCs in the atrium and ventricle, or to the presence of additional Ca2+ influx pathways in
the ventricle (like TTCCs and NCX in reverse mode). Thus, reverse mode NCX in adult zebrafish
cardiomyocytes has been shown to contribute to Ca2+ influx at membrane potentials more positive
than +10 mV [17]. Hou et al. showed that heart excitability matures differently in the atrium and
ventricle [43]. The upstroke of the action potential in 54 hpf embryos depended mostly on LTCCs in both
the atrium and ventricle, since action potentials were blocked by nifedipine but not by quinidine [43].
However, at 90–102 hpf, while the excitability of the atrium still depended largely on LTCCs, the
excitability of the ventricle rested on Na+ channels (complete block by quinidine). Furthermore,
Arnaout et al. [6] showed in 48 hpf embryos that the upstroke of the action potential in both the
atrium and ventricle depended on LTCCs (it was sensitive to nifedipine, but not to tetrodotoxin),
consistent with reports in early differentiated mammalian cardiomyocytes. Thus, there seems to be a
transition from immature Ca2+ -dependent excitation to a mature Na+ -dependent one during heart
development. In the zebrafish ventricle this transition occurs about 3 dpf and in the atrium about 4 dpf.
The dependence of atrial excitation on LTCCs in 3 dpf embryos may therefore explain its sensitivity to
nifedipine, compared to the ventricle.
      We confirmed that 3 dpf zebrafish embryos have a strong sympathetic input to the heart or a state
of activation of β1 adrenoreceptors, since the β-adrenergic blocker propranolol caused bradycardia
and a decrease in the Ca2+ levels in both heart chambers (Figure 7). In agreement with these results, in
3 dpf transgenic embryos expressing GCaMP6f, propranolol showed a 26% reduction in the HR and a
decrease in the diastolic Ca2+ levels [25].
      There was a striking difference between the small ratio change during systolic Ca2+ transients
(about 5% in Twitch-4) compared to the large ratio change of in vitro calibration (Table 1) [24]. Although
the in vitro dynamic range of many modern biosensors is impressive, reaching several-fold between
the zero and saturating Ca2+ concentrations, in cells, tissue slices, and in vivo, the fluorescence or
ratio changes are much more modest during physiological responses. For instance, TN-XXL showed
an in vitro ∆R/R of 260%, whereas the ratio increased only 1.6% during a single action potential in
hippocampal slices [33]. In heart explants of a transgenic mouse expressing TN-XXL the ratio increased
by 10% during systole [34]. Likewise, Twitch-2B showed an in vitro ∆R/R of 800%, whereas the
ratio changed by 26.5% during an action potential in acute cortical slices [24]. Similarly, GCaMP6f
fluorescence in vivo in the mouse visual cortex increased by only 19% during an action potential [19].
The ratio changes we observed during the cardiac cycle in embryo hearts with the TN-XXL and Twitch
biosensors were in a similar range to those in these in vivo results.
      The goal of the present study was to provide evidence to choose the best ratiometric biosensor(s)
for constructing transgenic zebrafish lines. In conclusion, Twitch-4 stood out as providing the largest
relative ∆R during the heart cycle, outperforming the other GECIs. As a result, smoothing of Twitch-4
raw data required a smaller number of points than the other biosensors (Table S3). This agrees with
the reported in vitro calibration data, which showed a very linear response of Twitch-4 with Ca2+
(Hill slope of 1.04) and a 6-fold ratio difference between the Ca2+ -free and Ca2+ -saturated probe, the
largest of these biosensors. Twitch-4 also has faster kinetics compared to the other GECIs (Table 1) [24].
However, the higher affinity Twitch-1 and Twitch-2b reported more sensitively the effects of nifedipine
on Ca2+ levels; thus, they may be preferred to detect diastolic or decreased Ca2+ levels. In addition,
Twitch-1 showed better SNR than Twitch-4. Twitch-2B might be problematic for use in the fast beating
embryo heart as it has the slowest decay of these GECIs (time constant of 2.8 s) (Table 1), but it could
still be useful to estimate the steady-state levels, for example, in models of heart failure. TN-XXL,
which belongs to an earlier family of biosensors, showed the smallest ∆R and SNR of all.
      The results on GECI overexpression suggested that the stable expression in a transgenic zebrafish
line should be adjusted to provide sufficient SNR with the least possible deleterious effects of the
added Ca2+ chelator [23]. In addition, stable or conditional expression should minimize the differences
in the expression levels between cells observed here, improving the data quality of the experiments.
You can also read