A Long-Range Transportation Plan for Greater Vancouver - TransLink
←
→
Page content transcription
If your browser does not render page correctly, please read the page content below
Copies of this Report
        and its companion
Medium-range Transportation Plan
 to the year 2006 can be obtained
               from:

  GVRD Communications and
    Education Department
        4330 Kingsway
    Burnaby, B.C., V5H 4G8
      Tel: (604) 432-6339
      Fax: (604) 432-6399

                                    A Long-Range
                                    Transportation Plan
                                    for Greater Vancouver

                                    September, 1993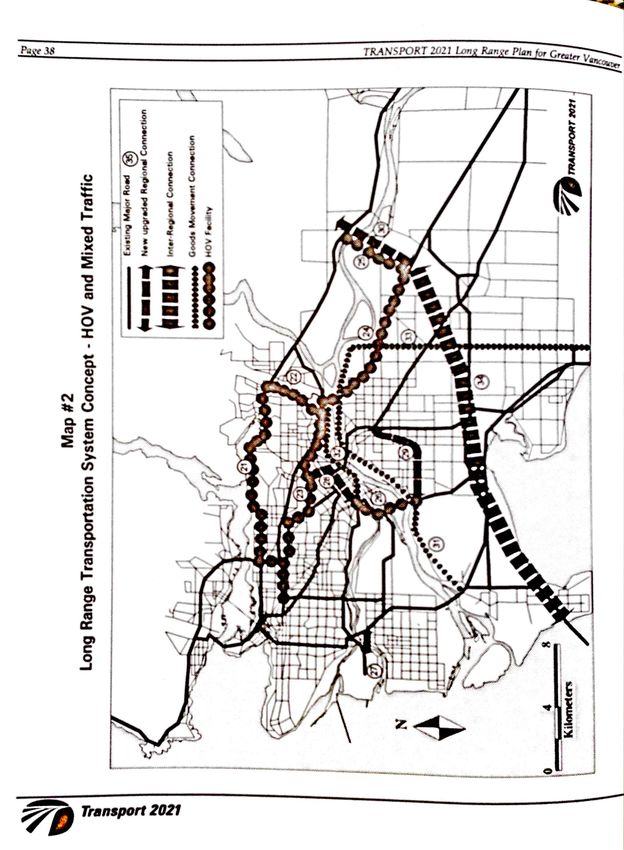
TRANSPORT 2021 Long Range Plan for Greater Vancouver
TRANSPORT 2021 Long Range Plan for Greater Vancouver

                                                       CONTENTS

                             Executive Summary                                     i
                            Preface                                                1
                            TRANSPORT 2021 and its Objectives and Related Plans    1
                            About This Report                                      1
                            Steering Committee and Acknowledgements                3
                         A. Where Are Current Trends Leading?                      5
                            Today's System                                         5
                            Expectations and Goals for the Transport System        6
                            "Business As Usual" Consequences                       7
                         B. How Can the Trends Be Changed?                        12
                             1. Control Land-use                                  13
                             Livable Region Strategy for Growth Management        14
                             Neighbourhood Land-use Strategy                      16
                             Land-use Policies Endorsed by TRANSPORT 2021         19
                             2. Apply Transport Demand Management                 20
                             Transportation Demand Management                     21
                             Recommended Policies                                 24
                             3. Adjust Transport Service Level                    26
                             Recommended Service Level Policies                   27
                             4. Supply Transport Capacity                         28
                             Transport Supply Strategies                          28
                             Transport Supply Policy Recommendations              32
                             Recommended Future System Maps                       34
                         C. What Will The Plan Achieve?                           39
                            A Numerical Assessment of the Plan's Performance      39
                            Capital Costs and Affordability                       45
                         D. Keeping Options Open                                  53
                            Surprises Since 1960                                  53
                            Sources of Uncertainty                                54
                            Coping With Uncertainty                               56
                         E. What Commitments Are Required—By Whom?                59
                         Appendix 1: Public Communications Programme              61
                         Appendix 2: Publications                                 64
                            Working Papers                                        65
TRANSPORT 2021 Long Range Plan for Greater Vancouver Page 1
Preface
TRANSPORT 2021 and its This Report is part of the output of TRANSPORT 2021, a joint,
Objectives two-year project funded equally by the Province of British Columbia
and the Greater Vancouver Regional District (GVRD).
The objective of the TRANSPORT 2021 project is:
"based on
the GVRD's Creating Our Future action plan,
its Regional Strategic Plan and
the mission statements of the Ministry of Transportation and
Highways and B.C. Transit,
to recommend,
by the end of 1993,
a long-range transportation plan for Greater Vancouver,
with associated policies, demand management measures
and priorities for transportation investment."
The project is guided by a Steering Committee of senior staff offi-
cials from provincial and local governments, with observers from the
federal government and neighbouring regions.
Related Strategic Plans The GVRD's Regional Strategic Plan for managing growth is in-
corporating the TRANSPORT 2021 Long-range Plan as its trans-
portation component. The two plans are concurrent and interactive;
in particular they consider the interaction of land-use patterns and
transportation services. The two projects also conduct a joint public
communications programme.
A province-wide transport plan is being assembled by the
Government of B.C.; the TRANSPORT 2021 long-range plan con-
tributes to its B.C. Lower Mainland portion.
Also concurrent is the GVRD's Air Quality Management Plan,
which shares analysis and findings with TRANSPORT 2021.
About This Report This Report presents all the elements of a 30-year transportation
plan for Greater Vancouver. It contains the principal findings and
long-range recommendations of its authors, the TRANSPORT 2021
Steering Committee.
Addressed to the GVRD and the Province of B. C. as the project's
joint sponsors, this Report is also a public document intended for allPage 2 TRANSPORT 2021 Long Range Plan for Greater Vancouver
groups interested in the future of the transportation in the B.C.
Lower Mainland.
Contents First, the Report provides a snapshot of the region's transporta-
tion system as it exists today. It explains why action is necessary. It
finds that the system is following undesirable trends—i.e. increasing
dependence on the automobile coupled with sprawling urban
growth— which lead away from the region's declared values and
aspirations. Next, the Report outlines in detail how an alternative
future can be achieved. It presents methods for governments to
swing the current trends around to a more desirable direction. It
recommends a strategy, in the form of transportation policies and
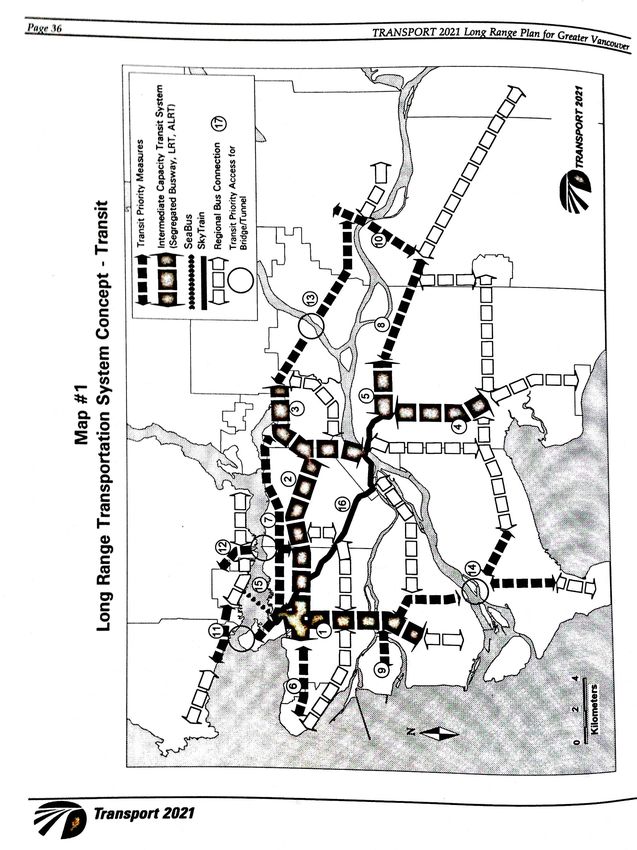
capital improvements (such as transitways, high-occupancy vehicle
lanes and new road links) expected to be needed within 30 years.
The Report then describes what would be the result of such a
strategy over the next 30 years—i.e. as measured by transport ser-
vice, cost and livability parameters, and demonstrates that the plan is
a preferable direction. The analysis is based on the project's research
program guided by regional and provincial goals. The result is
presented both as a transportation vision and as a target for the year
2021.
Note that the Report does not identify when actions should be
taken. This report describes an "end state" and makes no comment
on priority or timing. Investment priorities and phasing
recommendations are presented in the project's medium-range plan.
[18]1
Nor does the Report detail changes in the institutional frame-
work which would be required to make the plan function effec-
tively—though it does indicate areas where improved coordination
will be essential; it concludes by identifying who will have to act; it
lists the commitments required from partner agencies in order to
bring the Long-range Plan to reality.
Finally, the Report does not present a financial plan, although it
does estimate capital costs and indicates the affordability of its
recommended future transport system.
Public communications
Public communications activities undertaken in the course of the
project are described in Appendix 1. Appendix 2 contains a list of
publications, including a series of technical papers and research
documents.
1Square brackets [ ] contain the number of a TRANSPORT 2021 Working Paper which
contains more details. Working Papers are listed at the end of Appendix 2.TRANSPORT 2021 Long Range Plan for Greater Vancouver Page 3
Steering Committee Members B. E. (Ben) Marr, GVRD Regional Manager and
Chair, TRANSPORT 2021 Steering Committee
J. D. (Doug) Allan, Municipal Manager,
District of West Vancouver
R. W. (Bob) Collier, Municipal Administrator,
Corporation of Delta
N. A. (Norm) Cook, Municipal Manager, District of Coquitlam
J. C. (John) Dyble, Regional Director, Ministry of Regional
Economic Development, Small Business & Trade
B. R. (Bruce) McKeown, Assistant Deputy Minister, MoTH2
L. R. (Len) Roueche, Manager, Planning and Research,
B.C. Ferry Corporation
G. (Glen) Leicester, Acting Vice-President, Marketing and Transit
Planning, B.C. Transit
D. H. (David) Rudberg, City Engineer, City of Vancouver
Steering Committee Observers P. W. (Peter) Cave, Director, Planning,
Regional District of Fraser-Cheam
P. J. (John) Gairns, Administrator,
Dewdney Alouette Regional District
E. (Erik) Karlsen, Director, Planning Branch,
Ministry of Municipal Affairs, Recreation and Housing
G. H. (Gerry) Kingston, Secretary-Treasurer,
Central Fraser Valley Regional District
P. R. (Paul) Moritz, Manager, Long-range Planning,
District of Matsqui (Alternate to Mr. Kingston)
B. A. (Boris) Pavlov, Regional Director, Policy and Coordination,
Transport Canada
Project Team M. L. (Martin) Crilly, TRANSPORT 2021 Project Director
P. C. (Paul) Lee, GVRD Strategic Planning and
TRANSPORT 2021 Technical Director
J. (Jim) Chim, GVRD Strategic Planning
S. (Stephen) Gardner, BC Transit Transportation Engineering
R. M. (Rob) Hodgins, City of Vancouver Engineering
G. L. (Lynn) Kimmins, TRANSPORT 2021 Administrative Assistant
K. W. (Karoly) Krajczar, GVRD Strategic Planning
R. A. (Ross) Long, IBI Group and
TRANSPORT 2021 Team Member
D. G. (David) Marr, MoTH South Coast Region
S. M. (Susan) O'Connor, MoTH Headquarters
C. G. (Chris) Voigt, GVRD Air Quality and Source Control
The Steering Committee acknowledges and thanks the following people for
their support and advice to the project and its activities.
2B.C. Ministry of Transportation and HighwaysPage 4 TRANSPORT 2021 Long Range Plan for Greater Vancouver
Academic Advisor R. G. (Ron) Rice, School of Urban Planning, University of McGill
GVRD Management and Staff K. D. (Ken) Cameron, GVRD Strategic Planning
H. (Hugh) Kellas, GVRD Strategic Planning
D. (Delia) Laglagaron , GVRD Strategic Planning
D. E. (David) Baxter, Consultant to GVRD Strategic Planning
J. M. (Judy) Kirk, GVRD Communications and Education
D. B. (David) Cadman, GVRD Communications and Education
M. W. (Marilyn) Assaf, GVRD Communications and Education
J. B. (Barrie) Mills, GVRD Air Quality and Source Control
M. (Morris) Mennell, GVRD Air Quality and Source Control
TRANSPORT 2021 Engineering D. R. (Derek) Parkes, MoTH South Coast Region and
Liaison Committee Chair, TRANSPORT 2021 Engineering Liaison Committee
I. (Ian) Adam, City of Vancouver
N. (Neil) Atchison, City of Surrey
C. (Carl) Berg, District of Mission
D. (Don) Bridgman, City of North Vancouver
G. (Gordon) Chan, BC Transit
J. (Joseph) Dioszeghy, Corporation of Delta
R. (Renate) Ehm, City of New Westminster
T. (Tom) Gardner, District of Maple Ridge
R. (Bob) Glover, City of Burnaby
G. (Gavin) Joyce, District of North Vancouver
M. (Mike) Lai, City of Surrey
P. (Peeter) Liivamaagi, City of Burnaby
G. (Gordon) Lovegrove, Township of Langley
K. (Ken) Low, City of White Rock
J. (Jim) Lowrie, District of Pitt Meadows
G. (Gordon) MacKay, District of West Vancouver
H. (Herb) Mueckel, Village of Anmore
T. (Tim) Murphy, City of Coquitlam
N. (Neil) Nyberg, City of Coquitlam
R. (Richard) Page, Village of Belcarra
J. (John) Paul, City of Port Moody
H. (Henry) Pelzer, City of Richmond
M. (Matt) Pongracz, City of Langley
C. (Clive) Rock, City of Richmond
I. (Igor) Zahynacz, City of Port CoquitlamTRANSPORT 2021 Long Range Plan for Greater Vancouver Page 5
A. Where Are Current
Trends Leading?
Today's System Today 1.6 million people and 1 million motor vehicles—cars,
buses, trucks, trains and vessels—circulate over Greater Vancouver's
10,000 km network of roads, trackage, and ferry lanes.
A Day's Travel
The system permits people to reach work, school, shopping,
Currently, on a typical day
the people of Greater Vancouver recreational, cultural and sports events, and to visit friends and
journey family; employers to access a supply of labour; and goods to be sent
and received in the course of domestic and international trade.
3 1/2 million times (or 83%)
by PRIVATE CAR , A transport system is basic to any urban area. Along with the
telephone system and other means of communication, it makes pos-
1/3 million times (or 9%) sible constant exchanges of goods, services, and information among
by PUBLIC TRANSIT people—planned and unplanned—which are the essence of a city.
The benefit and very purpose of a transport system is to make such
and nearly
1/3 million times (or 8%) exchanges possible.
by FOOT or BICYCLE. The benefit is very large and hard to measure. However, it comes
———
at a cost, at least part of which can be measured.
Travel is uneven throughout the For instance, in the B.C. Lower Mainland, the current cost to ve-
day, with the
hicle owners of owning and operating the 1 million vehicles is about
morning peak period $4.3 billion per year.
(6 to 9 a.m.) The additional cost of providing "free"parking for them at resi-
and the
dences, work places and other locations is about $600 million per
afternoon peak period
(3 to 6 p.m.) year; roads cost some $600 million annually to build and maintain;
and the "external" costs of accidents, air and other pollution have
together accounting for been estimated at a further $2 billion per year. This excludes the
over 40% value of land occupied by the roads and other rights-of-way and the
of all vehicle trips. value of the personal time that people spend in travelling about.
One estimate [11]3 places the full annual cost of transporting
people within the B.C. Lower Mainland at nearly $14 billion (of
which $5 billion is the value of personal time), a figure which in-
cludes tangible and intangible costs borne by users and non-users.
Most of this is accounted for by the car and other private motor-
ized transport. Public transit accounts for about $1 billion of the total
3Square brackets [ ] contain the number of a TRANSPORT 2021 Working Paper which
contains more details. Working Papers are listed at the end of Appendix 2.Page 6 TRANSPORT 2021 Long Range Plan for Greater Vancouver
annual economic costs. Non-motorized transport (by cyclists,
pedestrians and telecommuters) represents a tiny proportion of the
total.
In addition, the cost of moving goods within the region—primar-
ily by truck—is about $2 billion annually. [7]
Trade Gateway Function The region is B.C.'s main provincial distribution centre and is
home to Canada's primary airports and seaports for Pacific Rim
trade. Other regions in the Province and other areas of Canada de-
pend on parts of Greater Vancouver's transportation system for their
livelihood. Effectively, the region sells transport as a service to
customers outside its boundaries.
This gateway function directly employs 30,000 people; when in-
direct and induced employment are added in, it generates some
60,000 to 90,000 jobs in the region, or roughly 8% to 12% of total re-
gional employment. [8]
The region's role as a gateway therefore represents both an obli-
gation and an opportunity for its economy.
Expectations and Goals for the As one of the vital organs of the region, the transport system is
Transport System expected to help achieve the region's values and aspirations. [1]4
For instance, it is expected to provide the required mobility and
accessibility for the economy, while simultaneously reducing its
negative impacts on livability and the environment. It is asked to:
• support the regional economy by providing a wide range of
effective, efficient, safe and reliable transportation services
for goods and people; and, in particular,
• serve a rapidly growing and diverse population which is
spreading south and east up the Fraser Valley away from the
metropolitan core; and
• limit disruption of neighbourhoods caused by through-traffic;
minimize intrusion of new roads into agricultural land and
other green spaces; and cut down polluting emissions into the
atmosphere.
Further goals and objectives for the transport system are to:
• help contain urban sprawl, shape urban structure and con-
serve the land resource;
• offer equitable service to all citizens in all geographic areas;
and
4The TRANSPORT 2021 Working Paper titled "Goals, Objectives and Criteria for Developing
a Long Range Transportation Plan for Greater Vancouver" contains a comprehensive
statement of these objectives, based on the GVRD's Creating Our Future statements and the
mission statements of the Ministry of Transportation and Highways and BC Transit.TRANSPORT 2021 Long Range Plan for Greater Vancouver Page 7
• generate public-sector revenues, reduce subsidies, live within
tight public-sector financial constraints, and ensure that lim-
ited capital resources are deployed most effectively.
The above goals and objectives represent what is at stake—why
transport policy makers pay attention to the transport system. This
Report recommends how it could be changed to achieve the goals.
"Business As Usual" Consequences But first, to place the current system in context, it is useful to ex-
The "Do Nothing" Option plore:
Projected Trend Population • what will happen if no changes are made, i.e. under current
Growth trends, policies, habits and practices;
1991-2021
and, in particular,
• whether the goals and objectives can be achieved without a
change in direction.
Population growth: basic force
One of the most basic forces propelling change in the B.C. Lower
Mainland is growth of population.
According to census data, in the 20 years between 1971 and 1991:
• the region's total population grew by nearly 50%, with slower
outer
inner municipalities growth in the City of Vancouver than in other parts of the
municipalities 90% region and
millions
40%
of people • families shrank in size: the average number of people per
1.0
City of household dropped by nearly 20%. That means that the
Vancouver number homes was growing faster than the number of people.
0.8 25%
South-eastward sprawl
0.6 In more recent times, heavy growth has been seen in outer
suburbs such as the North East Sector5, Surrey, Delta, White Rock,
Langley, and Fraser North6. In the 5 years through 1991, their
0.4
population grew at 2 to 4 times the rate of the inner areas such as
0.2
Vancouver City, the North Shore, Burnaby and New Westminster.7
1991 2001 2011 2021 In the 30 years ending in the year 2021, the population of the B.C.
Lower Mainland is expected to grow by a further 70% to reach
nearly 3 million. Unless current travel habits change, the number of
road vehicles will double to 2 million.
If trends continue, by 2021 the outer municipalities will see popu-
lation growth of over 90%, the more mature inner municipalities of
5In this Report, the term "North East Sector" means the municipalities of Coquitlam, Port
Coquitlam, Port Moody and the Villages of Anmore and Belcarra.
6"Fraser North" means that part of the B.C. Lower Mainland to the east of the Pitt River and
north of the Fraser—including Pitt Meadows, Maple Ridge and Mission.
71992 Greater Vancouver Travel Survey.Page 8 TRANSPORT 2021 Long Range Plan for Greater Vancouver
40% and the more densely-settled City of Vancouver by 25%—i.e. a
major decentralization of homes.8
Trends in employment In the 20 years between 1971 and 1991:
• the number of people available for paid work (i.e. the labour
force) grew by 72%—faster than the population in the same
period, due in part to the greater participation of women.
• the number of actual jobs (i.e. employment) grew even faster,
by 84%. That means that the demands on the transportation
system—from people travelling to work—also increased faster
than the population.
Suburbanization of jobs
More recently, the wave of employment growth is also spreading
south and east, but it is behind the wave of population growth. In
the five years through 1991:
• the fastest job growth was recorded in Richmond, the North
East Sector, Surrey, Delta and White Rock and Burnaby, all of
which saw 30% to 50% increases; while
• Vancouver City, the North Shore and Fraser North saw almost
no increase in jobs.
Common to other metropolitan areas
Greater Vancouver is not alone in experiencing suburban growth;
the pattern is well established in many similar-sized and larger
metropolitan regions in North America, being typically more ad-
vanced than in Greater Vancouver.
In some regions with lower regional growth pressures (e.g.
Montreal), the urban core and inner suburbs are actually de-popu-
lating in absolute terms even as the suburbs grow; this is partly
caused by the shrinking size of families, which therefore occupy a
larger number of homes.
Employment projection Under current trends, the number of jobs in the Lower Mainland
is expected to rise nearly 90% from 0.77 million in 1991 to 1.45
million in 2021.8
Service sector jobs are expected to grow fastest; for instance, fi-
nance, insurance and real estate and commercial services are forecast
to increase by 100% to 120%; primary industry and manufacturing
jobs are projected to grow more slowly, in the 30% to 60% range over
the 30-year period.
Recent travel patterns The GVRD conducted surveys on travel in the region in 1985 and
1992. There were notable changes in the critical morning peak pe-
8GVRD Strategic Planning Department. Population, Household, Labour Force and
Employment Projections for the Metropolitan Vancouver Region: 1991 to 2021.TRANSPORT 2021 Long Range Plan for Greater Vancouver Page 9
riod (6 a.m. to 9 a.m.), partly the result of the demographic trends
described above.
Changes in Key In the period 1985 to 1992:
Transportation Characteristics
• travel grew faster than population: although population grew
in the morning peak period in
Greater Vancouver by 21%, the number of trips made in the peak period grew by
1985-1992 37%;
• transit lost ground: transit's region-wide share of the travel
-30%-20%-10%0 +10%
+20%
+30%
+40%
declined by 1.3 percentage points (from 11.2% to 9.9% of the
Population
total number of peak period trips); for the portion of travel
Commuting autos ending in downtown Vancouver, where transit is traditionally
strongest, transit's share dropped proportionately more, by 2.2
Trips by car drivers
percentage points (from 35.3% to 31.2%);
Trips by transit
• automobile dependence increased: the share of all trips rep-
Total trips resented by automobile drivers increased by 2.3 percentage
points (from 54.3% to 56.6%), while the share of trips repre-
Trips per person
sented by automobile passengers fell by 0.2 points (to 16.7%).
1
Suburb-suburb share That means that the average number of people in a car went
down. The number of automobiles registered with the
Suburb-Vancouver 2
share
Insurance Corporation of B.C. for commuting to work grew by
3
Auto driver share 32%—or one-and-a-half times the rate of growth of the pop-
4 ulation;
Transit mode share
• suburb-to-suburb travel dominated further: trips with subur-
Trip distance
ban destinations gained 4 percentage points to 64.4% of total
Trip time trips in the region; trips with suburban origins to the City of
Trip speed Vancouver declined by 2.9 points, to 12.0% of the total trips in
the region; and
-30%-20%-10%0 +10% +20%+30% +40% • people travelled further and slower: the average trip distance
Relative Percentage Difference to work increased 12% to 14.0 km; the average trip speed
declined by 7% to 34.7 kph; and the average trip time increased
1. Change in the share of total trips which begin by 20% to 24 minutes.
in one suburb and end in another.
2. Change in share of total trips which end in Outlook for travel patterns
Vancouver City.
3. Change in the share of total trips which are • Based on survey results, the long-range pattern of suburban-
undertaken by car drivers. ization of homes continues to alter travel into a less-focussed
4. Change in the share of total trips which are travel pattern, which is more difficult to serve with conven-
undertaken by transit passengers. tional core-oriented transit services. Despite major trans-
Source: 1992 Greater Vancouver Travel Survey— portation infrastructure investments in the 1985-1991 period,
Comparisons of Travel Demand Characteristics, 1985- transit usage has not kept pace with automobile usage. The
1992.
region remains automobile-dependent, and that dependency
is growing.
• In 30 years, trends point to many more unfocussed suburb-to-
suburb trips which are difficult to serve well with conven-
tional public transit.
• Computer simulations of travel patterns reveal that current de-
mographic trends, land development and transportation
policies will further erode transit's market share, for a drop ofPage 10 TRANSPORT 2021 Long Range Plan for Greater Vancouver
several more percentage points over the next 30 years, with a
corresponding increase in the share of the automobile.
Feedback over time • To keep congestion at bay under trend conditions, a large road
building programme will be required. One measure of the
increase is the number of traffic lanes required on bridges and
tunnels to cross the region's major water bodies. Computer
Context simulations indicate this number would increase from the cur-
for Transport System rent 47 road lanes of capacity to a total of 85 lanes by 2021. [13]
e.g. Urban Form In reality, such trends are unlikely to continue unchecked. The
Instutional Framework people and the institutions of the region will adapt and intervene to
Socio-Economic cause changes in direction to occur.
Characteristics
This self-correcting process is illustrated on the left. The physical,
social, environmental and economic context within which the
transportation system operates is itself changed over time by the
Transport System external impacts of transportation.
Travel Demand This Long-range Plan is itself part of the feedback loop, identify-
Transport Infrastructure ing the conflicts with society's goals and proposing changes to the
system and the context in which it operates.
Conflict with Goals
External Impacts The goals of the region expressed in the GVRD's "Creating Our
of Transport System Future" programme call for more reliance on walking, cycling and
transit, and place the automobile lowest in priority.9
e.g. Land Use Impact
Air quality The loss of transit share, increase in auto dependence and impli-
Energy Consumption cations for major road building is contrary to those goals. The cur-
Socio-Economic Impacts rent trends were discussed and rejected at a public conference held
in May 1992.
Air pollution is one of the external impacts which TRANSPORT
Air quality trends 2021 is specifically asked to address in its terms of reference.
The GVRD "Creating Our Future" goals call for a reduction of 50%
in the emitted tonnage of five named atmospheric pollutants by the
year 2000 (compared with a base year of 1985). Based on emissions
calculation undertaken for TRANSPORT 2021, this goal is within
sight.
Motor vehicles currently account for 2/3 of total emissions of five
major local air pollutants (oxides of nitrogen, oxides of sulphur,
volatile organic compounds, carbon monoxide and particulate mat-
ter). Two of these—oxides of nitrogen and volatile organic com-
pounds—are precursors to the formation of smog. Motor vehicle
emissions of particulate matter and carbon monoxide are also of con-
cern to the region's air quality.
9GVRD. Creating Our Future, 1993 (adopted by the GVRD Board of Directors on 26th
February, 1993)TRANSPORT 2021 Long Range Plan for Greater Vancouver Page 11
Despite traffic growth, the offsetting effects of less-polluting and
more fuel-efficient new vehicles will cause a net decline in emissions;
in particular, the AirCare emission inspection and maintenance
program and cleaner fuels will cause total emissions to decline, even
under trend conditions—i.e. without the TRANSPORT 2021
recommendations being implemented (which, as shown later in this
Report, would reduce them further).
Technical breakthroughs (e.g. replacing gasoline engines with
electric batteries or fuel cells) will help further. [17]
Accordingly, the total tonnage of the five major local air pollu-
tants (mostly carbon monoxide, but including the smog-forming
compounds) from vehicles in 2021 will be lower than they are today.
10
In addition, vehicles contribute a share of global air pollutants
known as "greenhouse" gases, such as carbon dioxide (of which mo-
tor vehicles contribute a quarter of the total emitted, Canada-wide)
and chlorinated fluorocarbons. Carbon dioxide emissions from
vehicles will parallel total consumption of carbon-based ("fossil")
fuels such as gasoline, diesel fuel, natural gas, propane and others,
and is expected to see a net increase.
In summary Overall, the region is on a development path that carries it away
from, rather than towards, its own declared goals.
The trends are already established and have considerable mo-
mentum. They have been assisted by the existing transportation
system, which has increased the accessibility among the various
parts of the region over the past 30 years.
Changing direction will require significant changes in real estate
development and investment patterns, in the behaviour of people
and households, and in the priorities for public infrastructure.
10Estimates provided by GVRD Air Quality and Source Control Department based on traffic
projections provided by TRANSPORT 2021.Page 12 TRANSPORT 2021 Long Range Plan for Greater Vancouver
B. How Can the Trends Be
Changed?
The Transport Policy Levers Four transport policy levers are available to steer the transport
system away from current trends onto a more desirable path.
1. 3.
control adjust They are:
land transport
use service level 1. Control Land-use through planning and zoning regulations,
which shape a compact urban form, resist urban sprawl, and
2. 4. foster pedestrian- and transit-friendly neighbourhood design.
apply supply
transport demand transport
2. Apply Transport Demand Management, which comprises a
management capacity variety of new techniques to make better use of the existing
transport system, encourages off-peak travel and discourages
single-occupant vehicles, and incorporates measures such as
tolls, gas taxes and parking management.
3. Adjust Transport Service Level, allowing more congestion for
single-occupant automobiles, but making improvements in the
speed and convenience of public transport and shared private
transport such as car- and van-pools.
4. Supply Transport Capacity, by investing capital with a bias
towards public transport and shared private transport, both in
construction and in continuing operation, and by locating it to
improve selectively the accessibility of growth centres.
The task of producing a long-range plan amounts to finding the
optimal setting of these four policy levers in order to meet best the
goals and objectives of the transport system.
There are trade-offs possible among these levers. For instance, if
more money is spent on transportation capacity (lever 4), congestion
could be reduced and service levels improved (lever 3). Or, if strong
intervention to reshape travel behaviour is used (e.g. in lever 2 by
road tolls), then investment in new capacity (lever 4) could be post-
poned or reduced.
This section describes the results of the TRANSPORT 2021 re-
search program to determine how the levers should be used to effect
a desirable shift away from adverse trends. The project has estab-
lished that all the levers must be used in a coordinated way to be
successful [14]. This Report deals with the four levers in turn.TRANSPORT 2021 Long Range Plan for Greater Vancouver Page 13
1. 3. 1. Control Land-use
control adjust
land transport
use service level
2. 4.
apply supply
transport demand transport
management capacity
Land-use Defined "Land-use" means "how the land is used" and in particular what
human activities, if any, are conducted in what location.
A "land-use plan" states what land is planned to be left undevel-
oped (e.g. in a "green zone") and what is planned to be developed or
re-developed.
Knowledge of the geographical settlement pattern of people and
economic activity is crucial to transport planning. It is one of the
most important drivers of the demand for travel—how much travel
is desired between any two points.
In turn, transportation investment is believed to influence land-
use, by directing growth to areas which become more accessible via
the new transport links. Transport shapes land-use by selectively
Land Use Transport
providing access—good access to some areas but not to others.
Pattern System
Transportation is properly only one consideration in the devel-
opment of the desired urban form. The land-use pattern is funda-
mental to achieving a wide range of regional objectives other than
transport. These include preservation of open space and the land's
physical characteristics such as slope and soil stability.
Relationship Between Urban A city's reliance on different modes of transport is related to its
Density and Mode of Transport population density. Less dense, sprawling cities (e.g. in the south
and western U.S.) are more on automobile-oriented, while compact
cities (e.g. in Asia and Europe) are more transit-oriented.
Compared with other areas in the world, Greater Vancouver is
not very densely populated. Today, the region has an average of 5
people per hectare. However, particular areas within the region
have higher density; for example, the City of Vancouver at 35 people
per hectare is as dense as some European cities.
Given its low density, Greater Vancouver has relatively high
transit usage, especially when compared with U.S. cities. However,
the chart below strongly suggests that greater transit usage (i.e.
moving up the chart)—which is one of the region's objectives—
requires greater density (i.e. moving to the right).
Source: Adapted from "Greenhouse, Oil and Cities",
Considering
Peter Newman, "Futures", its density,
May 1991, supplemented
Transit Usage and Urban Density
with data from TRANSPORT 2021
Greater and the Greater
Vancouver has high
Vancouver Livable Region Strategy, 1993.
levels of transit usage. for selected cities in developed countriesPage 14 TRANSPORT 2021 Long Range Plan for Greater Vancouver
Livable Region Strategy for During 1992 and 1993, the GVRD developed a land-use strategy
Growth Management to help manage growth in Greater Vancouver. During the evolution
of the strategy, the question of density came to the fore.
"Manhattan", "Bi-Polar", Initially, some seven options for urban structure were reviewed,
"Beads on String", and other
options for urban structure. each with very different transportation implications. For instance,
the "Manhattan" option featured a single, very powerful centre in
downtown Vancouver requiring much core-focussed travel.
Another called for a "bi-polar" region, with a strong Vancouver and
Surrey. A third featured a series of more equal centres, "beads on a
string" stretching along a southeasterly transportation corridor.
Another saw self-sufficient or complete communities with relatively
little interchange among them.
The list was pared to three options which were analyzed more
deeply: Current Trends and Development Policies; Fraser North
Corridor; and Compact Metropolitan Area11. These were discussed
at a public conference held in Richmond, B.C., in November, 1992.
While opinions were diverse, the Compact Metropolitan Area re-
ceived the greatest support. Current Trends was least favoured.
Proposed more compact region Following a series of refinements, cross-checks, and further con-
sultations, a proposal for a more compact region emerged.
11GVRD Strategic Planning Department. Vancouver Metropolitan Region: Options for
Growth Management, 1992.TRANSPORT 2021 Long Range Plan for Greater Vancouver Page 15
GVRD Livable Region Strategy Proposals, 1993
proposed population growth compared with trend
Legend
proposed growth
trend projected under
current development
policies
196119912021
Year
Population
('000)
700
North Vancouver Richmond Burnaby North East North Southern North South
600
Shore and Sector Delta Region Fraser Fraser
500 New and and Valley Valley
400 West- North Langleys
300 minster Surrey
200
100
0
Data source: GVRD Livable Region Strategy, July 1993
This structure has the following features12:
• population growth is close to the "business as usual" trend for
the North Shore and the City of Vancouver;
• growth is above trend in Burnaby and New Westminster, the
North East Sector and North Delta and North Surrey;
• growth is below trend in Richmond, South Delta, South
Surrey, the Langleys, the North Fraser Region, Abbotsford,
Matsqui and Chilliwack;
• in sub-areas (analyzed in finer detail than shown on the map),
population and jobs are clustered in higher densities than
under the current trend. They are sited near regional activity
centres of various sizes, and sited along transport corridors.
This concentration helps to make them more effectively
serviced by transit; and
• the land-use plan strives for a balance between work force
and jobs in each sub-region, to give people an opportunity to
live close to work so that the need for long-haul commuting
can be reduced.
TRANSPORT 2021 long- The long-range transport plan is intended to serve and support
range plan assumes proposed
Livable Region Strategy is this compact urban structure. It assumes that the proposed growth
implemented
12Greater Vancouver Regional District, Livable Region Strategy Proposals–A Strategy for
Growth Management and Environmental Protection, 1993.Page 16 TRANSPORT 2021 Long Range Plan for Greater Vancouver
pattern will be achieved through the combined effect of forces in-
cluding:
• physical constraints such as mountains and water-bodies;
• the operation of the marketplace in the land development
business;
• the availability of land for development, determined by co-
ordinated changes to Official Community Plans and attendant
zoning regulations of municipalities, with such coordination
being sustained over several decades; and
• coordinated transportation investments and policies, also over
a long period.
Neighbourhood Land-use Strategy Local urban form and street design are keys to encouraging
pedestrian and bicycle modes of travel and giving them an oppor-
tunity to take hold. [15]
Greater Vancouver's best example of pedestrian-friendly design is
the downtown peninsula, where 60% of the people who live and
work there actually walk to work and school. In contrast, in a typical
suburban municipality, fewer than 15% walk.
Making neighbourhoods more friendly requires new approaches
to neighbourhood planning. Three possible ideas are
"neotraditional" town planning in new areas, "intensification" of
existing urban areas and "calming" of traffic. These offer practical
methods of reducing the region's dependence on the automobile.
They would make transit, bicycle and pedestrian travel more at-
tractive, not only for commuting but also for recreation, shopping
and other journeys.
In addition, social and aesthetic benefits can follow from these
approaches. They help to create neighbourhoods which many con-
sider more pleasant, healthier and more "livable", with a keen sense
of community, and where non-drivers (notably the young and the
old) and those who do not own a car are not so disadvantaged as to
personal mobility. Typically in North America, about 1 in 8
households do not own a car, and some 30% of the population in all
countries is either too young or too old to drive.
Town planning Neotraditional town planning aims to place small-town land-
scapes in new suburban areas—a return to some of the human-scale
features of the pre-automobile era.
In this approach, residential areas are not widely separated from
stores and services, but surround them. There is a mixture of
housing forms with moderate but not high-density housing clustered
around a neighbourhood commercial core. Commercial buildings
are closely spaced and front directly onto streets and sidewalks, not
set back for parking.TRANSPORT 2021 Long Range Plan for Greater Vancouver Page 17
The goal is to maximize travel by foot for routine neighbourhood
trips, while downgrading priority for vehicles. Access to local
amenities is provided by a grid of relatively narrow streets, allowing
vehicle and foot traffic many route choices, and slowing autos.
Block faces are short; buffer zones between potentially compatible
land-uses and different housing densities are removed.
Examples of benefits reported for this urban form, which can have
a regional impact, are:
• 17-23% fewer vehicle trips generated than in current suburban
developments;
• lower auto use (64% of trips by auto versus 86% in typical sub-
urbs) and higher walking (17% vs. 8%) and transit shares (17%
vs. 3%); and
• shorter trips: 12% fewer vehicle miles travelled with the same
number of trips; 40% fewer with the reduced number of trips.
[15]
There are potential obstacles to success: plans may fail if not all
elements of the comprehensive package are present; suburbanites
may not adopt the new form of community; safety implications of
narrow streets and parked cars are not clear; existing suburban resi-
dents may oppose innovative forms of development; and housing
prices in such neighbourhoods may be relatively high.
Intensification Residential intensification aims for a moderate and marginal in-
crease in population density of existing low-density neighbour-
hoods.
Approaches include: lowering minimum lot sizes for detached
housing; allowing a second dwelling to be built (e.g. in a large back
yard with access onto a back lane); allowing building right up to lot
line; relaxing the forced segregation of housing types (e.g. single
family homes set apart from multiple family); allowing secondary
suites in single family districts; and main street intensification.
Potential regional benefits include fewer and shorter trips, and
lower (by 50%) vehicle costs for households.
Intensification also faces obstacles: in particular, single-purpose
suburban zoning prohibits diverse housing forms, and attempts to
change it often encounter opposition from existing residents.
Both intensification and neo-traditional planning take time to
have their impact. The opportunity for immediate change is limited.
The majority of housing and commercial structures in the region in
30 years' time is already on the ground today.Page 18 TRANSPORT 2021 Long Range Plan for Greater Vancouver
Traffic Calming Traffic calming is a technique is to modify the street and its reg-
ulations to slow down traffic13. Automobiles are not treated as the
primary and most important user of road space in urban residential
areas.
In Europe, road widths and clearances are reduced, obstacles are
sited to cut down the straight-line path, and speed limits are reduced
(e.g. by 50%). On-street parking is used as a buffer between moving
cars and pedestrians.
Among reported benefits of traffic calming are a greater sense of
community among residents, lower accident rates, education of
drivers to the needs of other road users, and more business for small-
scale local retail and public services.
Walking and Bicycling The range for comfortable cycling is 5-10 km; its potential to re-
place automobile trips is even greater than for walking, since most
shopping, social and recreational destinations are found within this
range.
Percentage of
Total Daily Trips By Bicycle When combined with public transit, cycling extends the catch-
ment areas of transit stations. Bike-and-ride services expand the
Groningen, Netherlands 50% potential market further, especially if bicycles are allowed on buses,
Delft, Netherlands 43% trains and ferries, when they can be ridden at both ends of a trip.
Erlangen, Germany 26% A major problem preventing improvements in cycling is a poorly
Davis, California, USA 25% adapted system: roads and bridges do not accommodate cyclists.
Many destinations have no secure bicycle storage, with no change
Odense, Denmark 25%
rooms, showers or lockers.
Copenhagen, Denmark 20%
While suburbs have quiet streets suitable for cycling, these are
Basel, Switzerland 20%
often not well connected. Bicycle path connectors to join these quiet
Hanover, Germany 14% streets to shops, jobs and transit stops could induce a larger portion
of the population to cycle.
Source: Lowe, M. The Bicycle: Vehicle for a Small
Planet (1989) Those modern western cities which have successfully adapted
their road systems to accommodate cycling have shown that bicycle
travel can become an important component of the transportation
system and may reduce the number of motor vehicles on the roads
(see table, left).
Several initiatives are underway by governments in Greater
Vancouver to promote cycling: for instance, the City of Vancouver
has opened the Adanac Bikeway. The B.C. Ministry of Highways has
produced an Interim Cycling Policy: cycling is to be integrated into
all stages of provincial road planning and alternative routes are to be
provided when bicycle use cannot safely be built in.
Requirements for the long- It is not the purpose of the regional long-range transport plan to
range transport plan
recommend the design of particular centres and neighbourhoods.
However, the TRANSPORT 2021 Steering Committee commends
13The West End in the City of Vancouver provides a local example of traffic calming.TRANSPORT 2021 Long Range Plan for Greater Vancouver Page 19
these principles of local urban design to local authorities in the
region. They can have significant regional benefits.
Accordingly, the long-range transport plan assumes that local
governments will act to ensure that (a) new urban development will
be designed to favour short trips by foot and bicycle, rather than by
automobile, and (b) existing urban areas are adapted to better ac-
commodate the non-motorized modes of travel.
Land-use Policies Endorsed by Without the coordinated control of land-use through government
TRANSPORT 2021 planning and zoning regulations, transport policies and initiatives
will be compromised and cannot be effective.
Because they are so central to achieving other transportation goals
and objectives, these policies are fully endorsed by the TRANSPORT
2021 Steering Committee:
GVRD's Livable Region 1.1 The GVRD should pursue the completion of its Livable
Strategy Region Strategy as a reference point for all public and pri-
vate sector agencies which have an influence over urban
development.
1.2 The Strategy should allocate growth and concentrate devel-
opment in multi-use activity centres and high-density devel-
opment corridors.
1.3 The Strategy should define areas of higher density which
will be targeted for intensive transit service by the transport
plan.
1.4 The Strategy should identify towns outside the urban area
which are (a) intended to become more complete and self-
sufficient and therefore (b) through transportation and other
policies, to be discouraged from becoming suburban
"bedroom communities" with easy commuting into the
metropolitan core.
1.5 Near and within all activity centres, the Strategy should
Local friendliness to walking,
cycling and transit propose a range of housing, within a pedestrian- and bicycle-
friendly urban design, both by construction of new centres
and by re-development of existing ones.
1.6 Municipalities should provide a transit-friendly local street
pattern allowing transit routes to pass within walking range
of a large proportion of dwellings, job sites, schools, shops
and other activity centres.
1.7 Municipalities should develop bylaws and guidelines to
help attain long-range transport goals at both regional and
local levels, including retrofitting neighbourhoods which
currently have street patterns which are difficult to serve by
transit.
1.8 Governments should provide a framework whereby munic-
Coordination of Official
Community Plans ipal land-use plans are effectively coordinated in a sustained
fashion over several decades, using the GVRD's Livable
Region Strategy as reference point; neighbouring regions
and their member municipalities should be included in this
process.Page 20 TRANSPORT 2021 Long Range Plan for Greater Vancouver
1. 3. 2. Apply Transport
control adjust
land
use
transport
service level
Demand Management
2. 4.
apply supply
transport demand transport
management capacity
Transportation demand management (or TDM) is the second
Layers of Travel Demand lever available to policy makers. It comprises a variety of techniques
to change the behaviour of travellers in order to make better use of
the existing transport system. It encourages off-peak travel and
discourages single-occupant vehicles, incorporating measures such
as tolls, gas taxes and parking management.
The project divides the travel demand in Greater Vancouver into
three layers, being:
Three Layers of Transport Demand In Greater Vancouver
TOTAL DEMAND FOR TRANSPORT
IN GREATER VANCOUVER
EQUALS:
Layer A: inter-regional
the movement of people and goods originating from
and/or destined to places outside the region (e.g.
goods from the U.S. into B.C.; air passengers travel-
ling to the airport; goods transferred at the water-
front from ship to truck; ferries to and from
Vancouver Island and the Sunshine Coast)
PLUS
Layer B: regional
the movement of people and goods internal to the
region (e.g. commuters from Surrey to Downtown;
goods from North Shore to New Westminster)
PLUS
Layer C: local
the neighbourhood movement of people and goods,
either accessing the regional and inter-regional sys-
tem or circulating entirely within a small area of the
region.TRANSPORT 2021 Long Range Plan for Greater Vancouver Page 21
Aimed at Peak Period Demand TDM is aimed primarily at peak period, regional passenger travel
(part of layer B). This is the demand component which tests the
overall passenger-moving capacity of the transport system most
severely.
Transportation Demand Research points to transportation demand management (TDM) as
Management a promising public policy lever to change travel behaviour and help
most promising public policy solve urban transport problems. Though no panacea, it can postpone
lever capital investment and reshape travel demand to boost transit and
carpool use. [2]
Changes which can be effected by TDM fall into three types:
Three Changes Effected through Demand Management
1. Change Amount of Travel
to cut the number of trips made, e.g. by promoting:
• telecommuting from home or remote work centres
• the "compressed work week" (e.g. nine day fortnight
with longer days)
2. Change Mode of Travel
to switch away from solo-commute trips to public
transit, car pools, van pools, bicycles and walking, by
• providing dedicated "diamond lanes" to allow high-
occupancy vehicles (HOVs) such as buses and
carpool vehicles to move faster than others
• giving buses priority over other traffic, e.g. at
bridges, congested intersections and traffic signals
• promoting car- or van- pools by putting carpoolers
in touch with each other, priority parking, or chang-
ing the way carpools are financed or regulated
• increasing the relative cost and inconvenience of
solo auto driving by limiting the supply or increas-
ing the cost of parking, increasing fuel taxes, or
charging tolls for the use of the road network.
3. Change Time of Travel
to travel during off-peak periods,e.g. by:
• further promoting flex-time working
• imposing peak hour tolls and structuring parking
rates to discourage peak travel.
By 2021, TDM and toll-financing will probably be commonplace
in the developed world, being regarded as cost-effective ways toPage 22 TRANSPORT 2021 Long Range Plan for Greater Vancouver
combat urban traffic congestion and pollution and support transport
investment.
TRANSPORT 2021's long-range plan is based on the assumption
that Greater Vancouver will be no exception to this.
The project has identified a package of measures aimed at man-
aging travel demand: [2] [6]
Impact of
Transportation Proposed Package: Transportation Demand Management
Demand Management Measures
in Greater Vancouver
"Carrots"
1. promotion of telecommuting;
2. steps to encourage medium-sized and large employers
to help cut vehicle trips to their worksites;
3. application of bus priority measures;
4. installation of high-occupancy vehicle lanes;
"Sticks"
5. higher and more broadly applied parking charges (e.g.
50% increase of average all-day parking charges in
the downtown core, and increases in all-day parking
at other major town centres to equal 3/4 of today's
downtown levels);
6. higher fuel prices, through higher fuel taxes (e.g. a 50%
increase in the real price of gasoline); plus
7. downtown cordon/bridge tolls (e.g. $2 peak hour toll on
all bridges leading into Burrard Peninsula).
Research shows that the most effective measures are not the
"carrot" but "stick" variety. To be successful, TDM requires a pack-
age of mutually supportive "carrot" and "stick" measures.TRANSPORT 2021 Long Range Plan for Greater Vancouver Page 23
10% vehicle reduction esti- A strategy combining "carrot" and "stick" in a significant package
mated of TDM measures could produce about a 10% reduction in the
number of peak hour vehicle trips in 2021, compared with the "base
case" trend forecast for 2021. It would shift some travellers from
solo-commute driving into carpools and transit, resulting in transit
ridership some 25% higher than it would otherwise be—provided
that transit services are available to receive the additional riders.
Depends on degree The actual traffic reduction achieved will depend on the degree of
intervention (e.g.: in the case of tolls, the dollar amount). An ag-
gressive, dramatic application of TDM might achieve an even higher
reduction in vehicle trips. [3]
Link to user pay Currently, urban transportation is underpriced, i.e. users pay less
than the economic cost of the facilities and services they use.
According to one estimate, travellers on all modes of transport com-
bined pay only 2/3 to 3/4 of the full costs14. [11]
In the long run the prices paid by users should approach the un-
derlying costs they impose, otherwise over-use tends to result.
Accordingly, research supports a policy of generally increasing
the price of transport by all modes, consistent with the use of in-
creases in prices as a TDM measure.
Implementation is the key For the long-range plan, exact TDM measures and settings do not
have to be specified in detail. This is because of the level of uncer-
tainty involved in long-range plans, and the probability that under-
lying attitudes and behaviours and the responsiveness of individuals
will change over time15. The actual effect of TDM may depend much
on how it is introduced, publicized and coordinated. [4] [5]
Link to financing and the TDM measures which raise revenue (e.g. parking fees, bridge
public purse
tolls, gas taxes) could support financing of capacity (e.g. build
bridges) and/or services and other travel options (e.g. by funding
transit revenue shortfall).
A prime reason for implementing TDM is economic efficiency.
TDM is cost effective because it helps to make better use of the exist-
ing system and postpones or reshapes growth in transport supply
(e.g. new roads) otherwise needed to alleviate congestion, and move
towards a more efficient allocation of resources and lower total costs.
However, public transit currently receives a higher financial sub-
sidy from government (in percentage terms) than does private vehi-
cle transportation. Private vehicles, in contrast, receive a higher
percentage subsidy in non-financial or hidden costs which they im-
pose on society as a whole.
14Depending on whether the value of personal time is included as a cost to the user.
15There are significant issues to be resolved as to how, when, and by whom TDM should be
implemented. To test its current acceptability to the public. TRANSPORT 2021 undertook a
region-wide opinion survey, which provides guidance for the project's medium-term plan
recommendations on the introduction of TDM.Page 24 TRANSPORT 2021 Long Range Plan for Greater Vancouver
This suggests that as TDM increases demand on transit, greater
demand on the public purse will follow if those services continue to
be subsidized financially as they have been in the past.
Unless revenues are captured from private transportation, and to
the extent that current financing and pricing policies are continued,
the net result of TDM could be a shift in financial responsibility away
from private sources to public sources.
Recommended Transport Demand
Management Policies 2.1 Governments should regard Transportation Demand
Management (TDM) strategies as an integral part of trans-
General demand manage-
ment policies port planning in the B.C. Lower Mainland.
2.2 Governments should use TDM as the primary public policy
instrument to restrain growth in travel by the single-
occupant automobile.
2.3 Governments should wherever possible exempt urban goods
movement, which has no practical choice other than truck,
from the policy of auto restraint.
2.4 Neighbouring local governments which feed traffic into
Greater Vancouver should be asked to respect and support
the TDM policy by encouraging transit and carpool traffic,
and discouraging single-occupant commuter traffic into/out
of Greater Vancouver.
2.5 Governments should generally use "carrot" measures
(persuasion and incentives) to achieve objectives before
using "sticks" (penalties and disincentives); however, since
"carrot" measures alone are not likely to effect significant
change, "stick" measures will be required.
2.6 Governments should encourage businesses to adopt telecom-
Telecommuting
muting by devising a framework of fiscal incentives, justi-
fied on the basis of saved or postponed infrastructure invest-
ments that would otherwise be required.
2.7 A regional agency, to be identified, should foster employer
Employer trip reduction
trip reduction programs, which look to medium and/or large-
scale employers to take action to reduce the number of com-
muter vehicles serving their worksites. The agency should
provide support by information and public awareness cam-
paigns, a regional ride-share match-up programme, and other
advisory services which encourage employers to participate.
2.8 Governments should leave voluntary the employers' partici-
pation in trip reduction programs, i.e. not require it by law,
to avoid regulatory imposition on employers and associated
public sector administrative costs (with the exception of pol-
icy 2.16 below).
2.9 Governments should recognize provision of HOV lanes and
HOV/Bus priorities
bus priority measures as necessary and mutually reinforcing
with TDM, to provide more time-competitive alternatives
over the single-occupant vehicle.
2.10 The Province should introduce road pricing measures or tolls
Road pricing, tolling and gas
tax structured to reduce congestion, provide clearer price signals
to users for the costs they incur and impose on others, and
raise revenue for transportation improvements.You can also read


