Healing a divided Britain: the need for a comprehensive race equality strategy - Equality and Human Rights
←
→
Page content transcription
If your browser does not render page correctly, please read the page content below

Healing a divided Britain: the need for a comprehensive race equality strategy
2

    About this publication
    What is the aim of this publication?
    ‘Healing a divided Britain’ is a review into race inequality in Great Britain, providing
    comprehensive analysis and evidence on whether our society lives up to its promise to be
    fair to all its citizens. It is based on the Equality and Human Rights Commission’s statutory
    five-yearly report on equality and human rights progress in England, Scotland and Wales,
    ‘Is Britain Fairer? The state of equality and human rights 2015.’

    The Equality and Human Rights Commission is calling on the UK, Scottish and Welsh
    Governments to address race inequality and discrimination experienced by people in
    Britain in a comprehensive and coordinated way.

    Who is it for?
    This report is intended for Government, policy makers and influencers across all sectors
    involved in work on race equality and discrimination.

    What is inside?
    Part 1 provides an overview of the key challenges to race equality in Britain and sets out
    our recommendations to the UK, Welsh and Scottish Governments.

    Part 2 details the evidence and key findings related to:
    • education and learning
    • work, income and the economy
    • health and care
    • justice, security and the right to life, and
    • the individual and society

    Why has the Commission produced this?
    The Equality and Human Rights Commission promotes and enforces the laws that protect
    our rights to fairness, dignity and respect. As part of its duties, the Commission provides
    Parliament and the nation with periodic reports on equality and human rights progress in
    England, Scotland and Wales.
3

                                                           4

Part 1: Working towards race equality in Britain           7

    A divided Britain                                      7
    The key challenges to race equality                    8
    Government activity on race equality                  11
    The need for a comprehensive approach                 12
    Recommendations                                       13
    Part 1 Endnotes                                       14

Part 2: ‘Is Britain Fairer?’ evidence for race            16

    1. Education and learning                             16
       1.1 Attainment                                     17
       1.2 Exclusion                                      18
       1.3 Bullying                                       19
       1.4 Higher education                               20
    2. Work, income and the economy                       21
       2.1 Employment                                     22
       2.2 Pay                                            25
       2.3 Apprenticeships                                25
       2.4 Migrant workers                                26
       2.5 Poverty and living standards                   27
    3. Health and care                                    30
       3.1 Mental health                                  31
       3.2 Physical health                                32
       3.3 Infant mortality                               33
       3.4 End of life care                               33
       3.5 Access to healthcare for marginalised groups   34
       3.6 Healthcare in detention                        36
    4. Justice, security and right to life                38
       4.1 Criminal justice system                        39
       4.2 Stop and search                                40
       4.3 Crime                                          41
       4.4 Detention                                      46
    5. The individual and society                         48
       5.1 Representation in decision making              49
       5.2 Media reporting, stigma and stereotyping       52

Bibliography                                              54

List of acronyms                                          71

Contacts                                                  73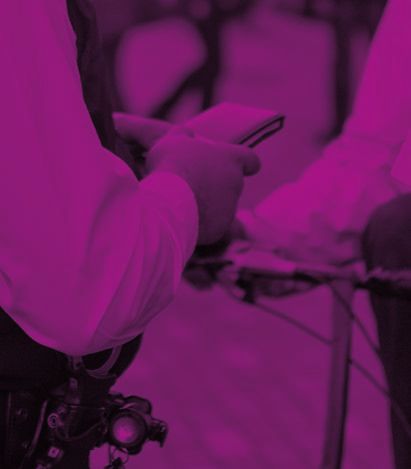
4 Healing a divided Britain
Foreword
from David Isaac CBE
This report represents the biggest ever review into race inequality in Great Britain, providing a
comprehensive analysis on whether our society lives up to its promise to be fair to all its citizens.
It looks across every area of people’s lives including education, employment, housing, pay and living
standards, health, criminal justice, and participation. It examines where we are making progress,
where we are stalling and where we are going backwards or falling short. It also examines the
relationship between race and socio-economic disadvantage.
And unfortunately it provides an alarming picture of the challenges to equality of opportunity that still
remain in modern 21st century Britain.
Our aim must be a society in which those born into families of a particular background are not
automatically condemned as second-class citizens. We need to create a fair society in which our
origins do not determine our destinies.
This is regrettably still a long way from our grasp.
There has been progress in some areas. For example, the 2015 General Election saw an increase in
the proportion of ethnic minority MPs from 4.2 per cent to 6.3 per cent; and also in 2015 the number
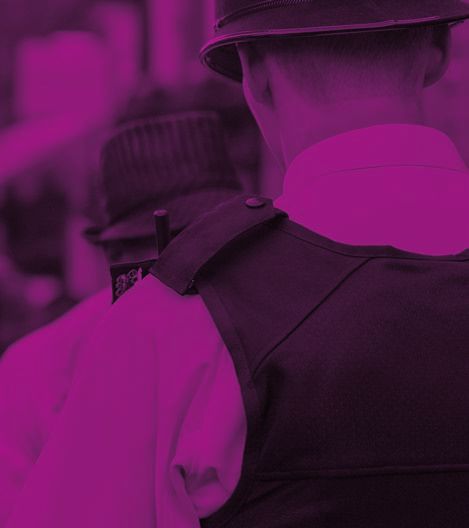
of ethnic minority police officers in England and Wales increased to 5.5 per cent from 3.6 per cent in
2006.
The new Prime Minister’s commitment to tackling race equality as a major priority for her
Government deserves a warm welcome. As Home Secretary, she delivered some important changes
to our criminal justice system and her early statements are encouraging, including announcements
on combatting modern slavery.
But, as she said recently: ‘Right now, if you’re born poor, you will die on average nine years earlier
than others. If you’re black, you’re treated more harshly by the criminal justice system than if you’re
white. If you’re a white, working-class boy, you’re less likely than anybody else to go to university’.
Today’s report underlines just how entrenched and far-reaching race inequality remains. Unfairness
is present in many areas of our society.
It is indefensible that in 21st century Britain, Black workers with degrees earn over 23 per cent
less on average than White workers with degrees; and if you are Black in England you are more
than three times more likely to be a victim of murder and four times more likely to be stopped and
searched by the police. Fear of crime is also much higher for many ethnic minorities, as is the
likelihood of living in poverty with poor housing and experiencing worse health outcomes.
Foreword
                                                                                                                 5

Young people from ethnic minority communities have also experienced the worst long-term
employment outcomes and suffered disproportionately from the tough economic climate in recent
years. In 2015, there were 41,000 16 to 24 year olds from ethnic minority communities in the UK who
were long-term unemployed, a rise of 49 per cent since 2010, compared with a fall of one per cent in
overall long-term youth unemployment and a two per cent decrease among young White people.
In Scotland, it is a stark fact that if you are born into an ethnic minority family today you are nearly
four times more likely to be in an overcrowded household and up to twice as likely to be living in
poverty and experiencing unemployment.
Moreover, we should be very concerned about how poor White boys are continuing to lag behind
with regard to educational attainment.
Our report also finds that race is the most commonly recorded motivation for hate crime in England
and Wales, at 82 per cent of recorded motivations. This is the same in Scotland, although there
racially motivated hate crime is at its lowest level since 2003/04.
Following the Brexit vote, these issues should be of even greater concern. Our nation’s hard-worn
reputation for tolerance is arguably facing its greatest threat for decades, as those who spread hate
use the leave result to legitimise their views.
The evidence demonstrates inequalities experienced by ethnic minority communities across many
areas of life in modern Britain, including education, employment and the criminal justice system.
Poorer White communities also face continuing disadvantage. The persistent nature of these issues
points to the existence of structural injustice and discrimination in our society. We must tackle this
with the utmost urgency if we are to heal the divisions in our society and prevent an escalation of
tensions between our communities.
It is vital that the UK Government now puts in place a race strategy which is coordinated and
comprehensive, with clear accountability and governance, and which includes stretching new targets
to improve opportunities and outcomes for our ethnic minority communities.
The approach in recent years has been patchy and stuttering, but we should be encouraged by the
new Prime Minister’s promise of a fresh start in recognition that we must lift our ambitions.
The UK Government’s economic plan since 2010 has not yet been paired with a race equality plan to
prevent cutting adrift some communities even further from equality of opportunity. If you are from an
ethnic minority community in modern Britain, it can often still feel like you’re living in a different world,
let alone being part of a one-nation society.
We are committed to working with the new Prime Minister and her Government, and the Scottish and
Welsh Governments. We must all redouble our efforts to build a fair society in which every one of us
is as free as possible to make the most of our talents, whatever our background.

David Isaac CBE,
Chair, Equality and Human Rights Commission
6   Healing a divided Britain

           82%
      Race remains the most
      commonly recorded
      motivation for hate crime
      in England and Wales, at
      82%.
Part 1: Working towards race equality in Britain
                                                                                                     7

Part 1: Working towards race
equality in Britain
1. A divided Britain
Our report ‘Is Britain Fairer?’1 (EHRC, 2015) brought together evidence on equality and
human rights across 10 domains – spheres of life which underpin and illustrate people’s
economic, social and personal well-being, and their life chances in Britain. It highlighted
a range of areas in which people from ethnic minority communities experience worse
treatment and outcomes.

These inequalities are of significant concern. Not only do they mean that individuals are
facing barriers in accessing jobs and services that impact on their ability to fulfil their
potential, they also indicate that some parts of our community are falling behind and can
expect poorer life chances than their neighbours. Multiple disadvantages result in social
and economic exclusion for some groups and create tensions between communities –
putting the ‘haves’ and the ‘have nots’ in conflict.

Britain is a very different place today compared to the 1960s, when casual racism and ‘no
blacks, no dogs, no Irish’ signs were commonplace. Race equality legislation and changes
in social attitudes have had an enormous impact. This is a cause for celebration. However,
the evidence shows that, 50 years after the Race Relations Act 1965, stark inequalities
remain. Divisions in our society have also been highlighted since the referendum on UK
membership of the European Union. A spike in racism and hate crime in England and
Wales2 following the vote suggests that, in some areas, a minority of people with racist
attitudes have used the result to legitimise racism and hate crime. In contrast, there were
far lower levels of post-referendum hate crime in Scotland.

The research also shows that the picture of race equality has changed in the last 10 years.
We see some sections of society advancing quickly while others are left behind, and
there are regional differences. In addition, immigration has brought changes to the ethnic
make-up of Britain. At the same time, fundamental issues, including persistent disparities
in employment and over-representation of ethnic minorities in the criminal justice system,
show that structural injustices, discrimination and racism continue to be part of our society
today. It is essential that as a society we recognise and address these structural problems
urgently and comprehensively, including the continuing disadvantage experienced in some
White communities.
8 Healing a divided Britain
2. The key challenges to race equality
Part 2 of this report builds on the evidence from ‘Is Britain Fairer?’ and draws on our
submission to the Committee on the Elimination of Racial Discrimination (CERD) (EHRC,
2016a) to present a fuller and more up-to-date analysis of the key challenges to race
equality in Britain. It sets out evidence-based findings in five major areas of life: education
and learning; work, income and the economy; health and care; justice, security and the
right to life; and the individual and society.
Challenges are wide-ranging, as the following examples show:
1. Permanent school exclusion for Black Caribbean and Mixed White/Black Caribbean
children in England is around three times the exclusion rate for all pupils.
2. In England and Wales, White boys receiving free school meals had the lowest
educational attainment at the age of 16 in 2015.
3. Over the last five years, the number of young ethnic minority people in the UK who
are long-term unemployed has almost doubled, whereas for young White people it fell
slightly.
4. People from ethnic minorities are twice as likely to live in poverty compared to White
people across Britain.
5. In Scotland, ethnic minority households are nearly four times more likely to experience
overcrowding.
6. In 2014, the probability of Black African women being detained under mental health
legislation in England was more than seven times higher than for White British women
(CAAPC, 2016).
Black British women are four
times more likely to be
detained under the mental health
legislation than White British
women, and mixed ethnicity women
almost seven times more likely.Part 1: Working towards race equality in Britain
9
In England and Wales, just 6% of
MPs are from an ethnic minority,
only 5.9% of judges and 5.5% of
police officers.
7. Rates of prosecution and sentencing for Black people in England and Wales are three
times higher than for White people.
8. Ethnic minorities in police custody in England and Wales are significantly more likely to
be physically restrained than White people.
9. Race hate on railway networks across Great Britain rose by 37 per cent between 2011
and 2015.
10. Ethnic minorities (along with women and disabled people) in the UK continue to be
underrepresented in higher positions in public life.
These challenges build on and complement those highlighted in the Equality and Human
Rights Commission’s submission to CERD.3 It highlights the following key issues:
1. Access to civil law justice
Restrictions in the scope of legal aid in England and Wales are having a significant impact
on people’s ability to access justice when their rights have been breached. Legal aid is no
longer available for most housing, immigration, social security, employment and education
cases.4 These changes have had particularly adverse impacts on access to justice for
people from ethnic minorities.
2. Criminal justice and immigration
As well as being more likely to be a victim of hate crime, ethnic minorities and migrants
are much more likely to experience disadvantage in the criminal justice system. The latest
Home Office figures on stop and search, for example, show that a Black man is still five
times more likely to be stopped and searched by police than a White man in England and
Wales.5
“A Black man is still five times more likely
to be stopped and searched by police than
a White man in England and Wales.”10 Healing a divided Britain
3. Education
Ethnicity has been shown to impact a child’s educational attainment at GCSE level in
England and Wales, and the GCSE equivalent (Standard Grade) in Scotland.6 Data in
England shows that Gypsy/Roma, Irish Travellers and Black Caribbean pupils have the
lowest attainment. In addition, ‘Is Britain Fairer?’ found that White boys receiving free
school meals in England and Wales had the lowest educational attainment at the age of
16 in 2015.
Recent evidence suggests that children are still victims of bullying because of their race,
ethnicity or religion.7 An Equality and Human Rights Commission study from March 2015
found that one in four of the pupils surveyed in Scotland said that they were aware of
peers in their school experiencing prejudice-based bullying.8
4. Access to work and just and favourable conditions of work
People from ethnic minorities have disproportionately high unemployment rates. Our
research on ethnicity and employment trends in 2013 found that White people had a
higher employment rate (at 74.7 per cent) than those from ethnic minorities (59.3 per
cent).9 Across Great Britain, Black and Asian workers are also moving into more insecure
forms of employment at higher rates than White workers. Black and Asian workers were
more than twice as likely to be in agency work in 2014 (TUC, 2015a).
Our full submission to CERD can be found on the Committee’s website.10 By ratifying the
International Convention of the Elimination of Racial Discrimination, the UK has pledged to
make sure its domestic laws and policies comply with it. The Commission’s role is to hold
the Government to account against the terms of this treaty.
The lack of robust data is yet another key challenge to achieving race equality, as it limits
the effectiveness of policy interventions and renders some people in the most vulnerable
situations invisible. In doing so, it compounds the disadvantages ethnic minorities already
face by hiding them and the issues they face from the decision-makers who set priorities
and shape services. There are also differences in the availability of data across Great
Britain. Some of the data about ethnicity that is routinely collected in England and Wales is
not collected in Scotland. These gaps do not relate to the absence of an issue, but simply
an absence of data about the issue. This is perhaps most stark when reading the health
section in Part 2. In England, a considerable amount of work has been done to measure
prevalence, morbidity, patient access and experience by ethnicity which has not been
replicated in Scotland.
Race inequality can only be effectively tackled through a comprehensive long-
term approach which examines all the areas of life where Black and ethnic minority
communities are being held back; an approach which recognises the inter-relationship
between socio-economic factors, race, adverse childhood experiences and discrimination.Part 1: Working towards race equality in Britain
11
3. Government activity on race equality
The UK, Scottish and Welsh Governments have undertaken a range of activity to
improve race equality. We welcome these initiatives, but they operate in silos. A more
comprehensive and coordinated approach would have greater and more sustainable
impact, so delivering better value for public money. The current patchwork of initiatives can
only have limited effect.
UK Government initiatives include targets across six areas of economic opportunity and
advancement, including apprenticeships, employment and university entry. Separately, a
review by Baroness McGregor-Smith examines the obstacles faced by Black and ethnic
minority people seeking progression within the labour market, and Sir John Parker’s
review looks at the diversity of corporate boards (HoL, 2016). Other work includes the
review by David Lammy into the treatment of and outcomes for Black, Asian and ethnic
minority individuals (PMO, 2016), and plans to require universities to routinely publish
admissions and retention data by gender, ethnic background and socio-economic group
(BIS, 2015).
In Scotland, the ‘Race Equality Framework for Scotland 2016-2030’ sets out the Scottish
Government’s approach to promoting race equality and tackling racism and inequality.
The Framework outlines six themed visions, including an overarching ambition for race
equality in Scotland to be achieved by 2030. It encourages more effective use of the
Scottish-specific Public Sector Equality Duties, the use of more robust data on ethnicity,
and a stronger ethnic minority voluntary sector. The areas of focus cover outcomes
related to community cohesion and safety; participation and representation; education and
lifelong learning; employability, employment and income; and health and home (Scottish
Government, 2016).
The Welsh Government has set equality objectives for 2016-2020 which reflect the
findings and priorities from ‘Is Wales Fairer?’ (EHRC, 2015b). They relate to delivery
of public services such as housing, health and education; access to advice; reducing
employment, skills and pay inequalities; reducing the incidence of harassment and abuse
such as hate crime; strengthening community cohesion; reducing poverty; and developing
a diverse and inclusive workforce, setting an example across Wales. These eight equality
objectives embed racial equality across policy areas as part of the Welsh Government’s
wider strategy for reducing inequality and tackling poverty.12 Healing a divided Britain
4. The need for a comprehensive approach
For race inequality in Britain to be tackled successfully, it is essential to take a
comprehensive approach which recognises the interrelationship between different
elements of people’s lives. This requires a comprehensive and coordinated strategy, with
stretching new targets and clear ownership, accountability and governance arrangements,
led by the UK, Scottish and Welsh Governments.
By addressing individual issues in a piecemeal way, without consideration of causes,
drivers and levers for change, actions taken are unlikely to be effective in the long term
or provide significant and sustainable change. Public money currently spent on separate
activities could be used more efficiently and with greater impact if this work were brought
together. For example, we will not make sustainable progress in reducing the ethnic
minority employment gap unless we address the educational attainment gap. We cannot
reduce the disadvantage experienced by people from ethnic minorities in the criminal
justice system without considering the role of mental health services in supporting people
to have stable lives.11 And we cannot address the under-representation of people from
ethnic minorities in political and civic life without acknowledging the relationship between
socio-economic exclusion and political disengagement.
The evidence set out in this report underpins the case for the UK Government to establish
a comprehensive approach to eliminating race inequality to drive concerted and focused
action across the range of key challenges we have identified.
Such a comprehensive approach would involve tackling pervading and entrenched racial
inequalities across sectors and throughout individuals’ lives. The nature and scale of the
issues we have identified may vary in different parts of Britain, so the solutions might vary,
but a national strategy is essential.
“...we will not make sustainable
progress in reducing the ethnic minority
employment gap unless we address the
educational attainment gap.”Part 1: Working towards race equality in Britain
13
5. Recommendations
The Equality and Human Rights Commission (‘the Commission’) is calling on the
UK, Scottish and Welsh Governments to address race inequality and discrimination
experienced by people in Britain in a comprehensive and coordinated way.
We recommend that:
1. The UK Government develops a comprehensive, coordinated and long-term
strategy to achieve race equality, with stretching new targets to improve
opportunities and deliver clear and measurable outcomes. The strategy should
be informed by the evidence and experiences of all ethnic groups in Britain,
including key stakeholder groups.
2. Development and delivery of the strategy is coordinated effectively within and
between the UK, Scottish and Welsh Governments to maximise impact.
3. The UK Government brings responsibility for the strategy under one Secretary
of State, with clear accountability and governance arrangements in place
across departments to drive delivery and appropriate liaison with devolved
governments.
4. All governments improve the range and scope of the disaggregated ethnicity
data available – including intersectional data – and ensure that ethnicity
statistics and research findings inform their race equality strategies.
5. All governments ensure effective and transparent monitoring arrangements are
in place to measure progress.
To support implementation of these recommendations, the Commission will work with
governments and key stakeholders to raise awareness of the evidence – in this report, the
CERD concluding observations and the Runnymede Trust civil society report12 – and to
identify the action that needs to be taken to deliver progress. The Commission can play
a key role in bringing stakeholders together to influence and support governments in our
shared aim of achieving race equality.14 Healing a divided Britain
Part 1 Endnotes
1 ‘Is Britain Fairer?’ is the Equality and Human Rights Commission’s five-yearly statutory
report on equality and human rights progress in England, Scotland and Wales. The
review provides extensive evidence on 43 indicators across 10 major areas of everyday
life, including education, employment, standard of living, health, justice, security, identity
and participation. Quantitative evidence is drawn from major surveys and administrative
data compiled by public bodies (as explained in the ‘Is Britain Fairer?’ Methodology
paper (EHRC, 2015c). Most of the core quantitative data in this report covers the period
from 2008 to 2013, but we have updated this to reflect more recent data where possible.
2 There was a 57 per cent increase in reporting of hate crime to the police online
reporting portal, True Vision, compared with the same period in the previous month,
with 85 reports made from Thursday 23 June to Sunday 26 June compared with 54
reports in the corresponding four days in May. True Vision is a third-party hate crime
reporting website supported by all police forces in England, Wales and Northern
Ireland. (Karen Bradley, 29 June 2016. Available at: https://hansard.parliament.uk/
commons/2016-06-29/debates/16062966000002/HateCrime [accessed: 30 June 2016]).
3 The Committee on the Elimination of Racial Discrimination examined submissions from
the UK, including from governments, the Equality and Human Rights Commission
and civil society on 4 and 5 August 2016. At the time of publication of this report, the
Committee’s concluding observations to the UK are expected to publish in September
2016.
4 The Legal Aid, Sentencing and Punishment of Offenders Act 2012 was commenced in
April 2013.
5 Stop and search under section 1 of the Police and Criminal Evidence Act 1984 (PACE)
(and associated legislation), by police force area and self-defined ethnicity, England and
Wales, 2014/15: 374,806 White, 63,523 Black (or Black British), 42,209 Asian (or Asian
British), 15,302 Mixed. (Home Office (2015), Police powers and procedures England
and Wales year ending 31 March 2015: data tables. Available at: https://www.gov.uk/
government/statistics/police-powers-and-procedures-england-and-wales-year-ending-
31-march-2015-data-tables [accessed: 17 March 2016]).
6 Recent data shows that White Scottish pupils (around 91 per cent of pupils) and
those whose ethnicity is Not Known/Not Disclosed (around one percent of pupils)
have the lowest rates for attainment and positive leaver destinations, namely
those in training, education or work. (Scottish Government (2015), ‘Equality
Outcomes and Mainstreaming Report 2015’. Available at: http://www.gov.scot/
Publications/2015/04/7781 [accessed: 20 June 2016].Part 1: Working towards race equality in Britain
15
7 Ditch the Label (2015), ‘Annual Bullying Survey 2015’. Available at: http://www.
ditchthelabel.org/annual-bullying-survey-2015/ [accessed: 20 June 2016].
8 112/681 and 123/569 recorded incidents of prejudice-based bullying, in Scottish
Education Authorities who provided data for 2011–12 and 2012–13, were on grounds
of race or ethnicity. However, race or ethnicity also featured more frequently than
other characteristics in policies on bullying, meaning that confidence in identifying
and reporting incidents might be stronger for these grounds. (Dennell, B. and Logan,
C. (2015), ‘Prejudiced-based bullying in Scottish schools: A research report’. Equality
and Human Rights Commission. Available at: http://www.equalityhumanrights.com/
publication/prejudice-based-bullying-scottish-schools-research-report [accessed: 30
November 2015]).
9 Employment rate is defined as the number of people in employment as a percentage
of the population (our analysis uses the working age population, which is 16–64). The
unemployment rate is the number of people not currently in a job as a percentage of
the ‘economically active population’ (those who are able to work and have adequate
availability to work; this does not include those not working through sickness, disability
or because they are studying). Our data on employment rates separates out women and
men, as there are significant differences between men’s and women’s employment rates
in some ethnic minority groups. (EHRC (2015), ‘Is Britain Fairer?’, p. 36. Available at:
http://www.equalityhumanrights.com/about-us/our-work/key-projects/britain-fairer/great-
britain-report [accessed: 7 April 2016]).
10 Available at: http://tbinternet.ohchr.org/_layouts/treatybodyexternal/SessionDetails1.
aspx?SessionID=1073&Lang=en [accessed: 1 August 2016].
11 See, for example, Centre for Mental Health (2013), ‘The Bradley Commission: Black
and Minority Ethnic communities, mental health and criminal justice’. Available at: https://
www.centreformentalhealth.org.uk/bradley-briefing1 [accessed 2 August 2016].
12 Through an open tender process the Commission contracted the Runnymede Trust
to coordinate and draft a joint civil society organisation shadow report with a coalition
of race equality civil society organisations across England, Wales and Scotland for the
CERD August 2016 examination of the UK Government.16 Healing a divided Britain
Part 2: ‘Is Britain Fairer?’
evidence for race
This part presents evidence on race attainment at age 16 in England and
outcomes across the following domains Wales. In Scotland, the gap between
and based on specific indicators as set White Scottish pupils in the most socio-
out in ‘Is Britain Fairer?’: education and economically deprived parts of Scotland
learning; work, income and the economy; and their White Scottish peers in other
health and care; justice, security and the areas was much larger than for all other
right to life; and the individual and society. ethnicities, except Scottish Gypsy/
Evidence has been updated where Travellers.
possible to reflect the most current data.
• Black Caribbean and Mixed White/
Some evidence may also include socio-
Black Caribbean children have rates
economic data where relevant, to reflect
of permanent exclusion at about three
the complex interaction between race and
times those for all pupils.
socio-economic status.
• Gypsy/Roma and Irish Traveller
children have the highest rates of both
1. Education and learning permanent and fixed-period exclusions.
• Just 6% of Black school leavers
Key findings attended a Russell Group university,
Education-related inequalities have a compared with 12% of Mixed or Asian
defining impact over a person’s lifetime, school leavers and 11% of White school
not just in childhood. The challenges in leavers.
education settings are wide-ranging:
• A higher proportion of White
• Substantial gaps in attainment remain undergraduate students received a
between ethnic minority and White First/2:1 degree (76.3%) compared
pupils across England and Wales with ethnic minority undergraduates
where Gypsy/Roma, Irish Travellers (60.3%). The gap was particularly
and Black Caribbean pupils have the high for Black male undergraduates
lowest attainment. In Scotland, ethnic (46.2%) compared with White male
minority students, except Scottish undergraduates (73.5%).
Gypsy/Travellers, have well above
Evidence presented in this section can
average tariff scores, which are higher
be found in ‘Is Britain Fairer?’ supporting
than those of White pupils. However,
evidence paper ‘Domain E: Education’
when looking at socio-economic status,
(unless otherwise stated). This is available
White boys receiving free school meals
at: https://www.equalityhumanrights.
(FSM) had the lowest educational
com/en/britain-fairer-report/supporting-
evidencePart 2: ‘Is Britain Fairer?’ evidence for race
17
1.1 Attainment point difference between them and the
national average (an increase in the gap
In England, data highlighting the of five percentage points since 2014).
proportion of pupils who achieve at least The gap rises to 32.7 percentage points
five GCSEs grade A-C (or equivalent), when only Black Caribbean FSM boys
including English and Mathematics, shows are considered and it has widened by
that Gypsy/Roma, Irish Travellers and seven percentage points since 2014 (DfE,
Black Caribbean pupils consistently have 2016a).
the lowest attainment. Pakistani, Mixed
White/Black Caribbean, Other White and In Scotland, the picture across the
Other Black pupils perform consistently educational outcomes measures for ethnic
below the national average. Attainment minorities continues to be very different.
for Bangladeshi pupils has improved Gypsy/Traveller pupils have the lowest
considerably and is now well above the tariff scores,1 whereas pupils from ethnic
national average. Attainment for Black minorities have well above average tariff
African pupils has been improving and scores, which are higher than those of
it was above the national average by White Scottish pupils (191 points). In
2012/13. However, it is currently under the 2012/13 this included Asian-Chinese
national average. pupils (255 points), Asian-Indian pupils
(211 points), Asian-Pakistani pupils (206
In Wales, broadly similar improvements points) and pupils from Mixed or multiple
in attainment mean that substantial gaps ethnic minorities (206 points).
have remained between ethnic minority
pupils and White pupils. For example, The gap in 2013/14 between White
African/Caribbean and Black pupils Scottish pupils in the most socio-
(47.1%) were less likely to achieve five economically deprived parts of Scotland
GCSEs grade A-C (or equivalent) than and their White Scottish peers in other
White pupils (55.9%). However, Mixed areas was much larger than for all other
(58.2%), Asian (60.8%) and Chinese ethnicities (51 points compared with 41
(79.8%) pupils were more likely to do so in points for pupils of Mixed ethnicity and
2013-15 (Welsh Government, 2016b). less than 20 points for Asian or African/
Black/Caribbean pupils).
In England and Wales, White boys
receiving FSM had the lowest educational Gypsy and Traveller attainment
attainment at age 16 in 2013. In 2015, Gypsy, Roma and Traveller children
24% of White boys on FSM achieved have lower educational attainment than
the GCSE threshold in England (a 33.1 other ethnicities. For example, they
percentage point gap between them were less likely to achieve ‘a good level
and the national average, 57.1%). Black of development’ in their early years
Caribbean pupils eligible for FSM fell (Early Years Foundation Stage Profile)
further behind with a 24.6 percentage in 2013/14 compared with Other White
1 The percentage of S4 pupils achieving at least five Awards at Scottish Credit and Qualifications Framework
(SCQF) Level 5 or better. S4 is the fourth year of secondary schooling in Scotland and the last year of
compulsory schooling. Prior to changes in the Scottish curriculum (beginning in 2013/14), these pupils
worked towards Standard Grade qualifications. For the purpose of comparison over time, the analysis in ‘Is
Britain Fairer?’ only considers attainment under this previous system.18 Healing a divided Britain
children in England. The figure was In England, Black Caribbean, Mixed
19.1% for Gypsy and Roma children, and White/Black Caribbean, Gypsy/Roma and
30.9% for Traveller children, compared Traveller children continue to experience
with 61.8% for Other White children. disproportionate rates of exclusions.
Similarly, a lower percentage of Gypsy/ Gypsy/Roma and Traveller children have
Roma children (13.8%) and Traveller the highest rates of both permanent and
children (17.5%) achieved at least five fixed-period exclusions. Black Caribbean
A*-C GCSEs in 2012/13 compared with and Mixed White/Black Caribbean children
Other White children (60.3%). Gypsy/ have rates of permanent exclusion about
Roma children’s attainment of five or three times that of the pupil population
more GCSEs at Grades A*-C, including as a whole. Pupils of Asian and Chinese
Mathematics and English or Welsh, ethnicity have the lowest rates of
remains strikingly low at 13% in 2013/14. exclusion (DfE, 2015).
The numbers of Gypsy/Traveller pupils
In Wales, from 2008/09 to 2012/13 there
in Scotland is small. However, the data
were reductions in the exclusion rate
shows that their attainment is far lower
among all ethnic minorities. The rate for
than for other ethnic minorities. The
Black pupils has dropped from 96.3 to
average tariff score for all S4 pupils in
42.8 (per 1,000) and the rate for Mixed
Scotland in 2012/13 was 192, compared
pupils has dropped from 55.6 to 37.7 (per
with 86 for Gypsy/Traveller pupils.
1000) (Welsh Government, 2014).
1.2 Exclusion In Scotland, during 2014/15, there were
18,430 exclusions from local authority
Although there has been an overall
schools, a decrease of 16% from 2012/13.
decrease in the total number and rate of
There were reductions in the exclusion
permanent exclusions in England since
rates for White, Mixed and Asian pupils
2004/05 across all schools, fixed-period
between 2009/10 and 2014/15. There
exclusions in primary schools increased
was no change in the exclusion rate for
in 2015 (DfE, 2015). Pupils from ethnic
African/Caribbean/Black pupils. However,
minorities experience disproportionate
in 2014/15 ethnic minority pupils were less
rates of exclusions. Higher rates of
likely to be excluded than White pupils2
absence and (fixed-period) exclusions
(Scottish Government, 2016c). In 2010/11,
were found among White pupils from
exclusion rates for Gypsy/Traveller pupils
disadvantaged backgrounds in 2012/13.
in Scotland (57 per 1,000 pupils) and
Rates of absence (both authorised and
Other Traveller pupils (175 per 1,000)
unauthorised) are higher among White
were the highest of all ethnic minorities.
pupils than for other ethnic minorities. The
gap between those on FSM and those
who are not is also wider for White pupils.
2 The Scottish Government informed the Equality and Human Rights Commission that ‘due to changes
in ethnic minority definitions, it is difficult to make comparisons with previous years, and in any case the
numbers of pupils from minority ethnic backgrounds means that year on year fluctuations in numbers can
have a huge impact on statistical rates. Therefore caution must be exercised in drawing conclusions related
to progress for ethnic groups.’Part 2: ‘Is Britain Fairer?’ evidence for race
19
1.3 Bullying the Label, 2015). Racist incidents are
under-recorded and under-reported
Bullying can impede educational partly due to a lack of leadership on the
attainment and have negative effects issue and partly due to a lack of staff
on the private life and health of the training in some schools (Show Racism
victim. There is concern that bullying is a the Red Card, no date). Racist language
widespread problem in the UK and can is still commonly used/heard in primary
hinder children’s attendance at school and secondary schools; such language
and their potential for successful learning sometimes relates to religion (Ofsted,
(UNCRC, 2008). Research suggests 2012). Requests for counselling from
children who were bullied tended to be children and young people experiencing
less engaged at primary school, with a racist/religiously motivated bullying in
lack of positive friendships leading to less schools has increased in recent years. For
engagement at secondary school. This example, in 2012/13 over 1,400 young
was also found to be associated with people across Britain told ChildLine4 that
lower academic achievement (Gutman they were experiencing racist bullying,
and Vorhaus, 2012). Research shows a 69% increase within a year (NSPCC,
being bullied by peers in childhood also 2014).
has worse long-term adverse effects on
young adults’ mental health and should In Wales, between 20% and 50% of
be viewed as a cause or risk factor for pupils in Wales are estimated to have
subsequent mental health problems experienced bullying at some point in their
(Lereya et al., 2015). school lives. Bullying is a particular risk
for ethnic minority pupils (Estyn, 2014).
In England, since the Stephen Lawrence The Welsh Government has published
Inquiry,3 schools were required to record a series of anti-bullying materials that
and report racist incidents to their local provide guidance and practical solutions
education authority (Macpherson, 1999). on preventing and responding to incidents
In 2010/11, the Department for Education of bullying in schools (Welsh Government,
(DfE) published guidance for schools on 2011).
preventing and tackling bullying which
removed this requirement. As a result, Education authorities in Scotland are
no national statistics on the prevalence not required to collect or report data
of racist/religiously motivated incidents in on bullying or harassment in Scottish
English schools have been available since schools, although some do so. There is a
2010/11. significant evidence gap which needs to
be addressed.
Evidence demonstrates that children
are still victims of bullying because of In Scotland, a study by the Equality
their race, ethnicity or religion (Ditch and Human Rights Commission (‘the
3On 31 July 1997, the Home Secretary Jack Straw ordered a public inquiry to be conducted by Sir William
Macpherson and officially titled ‘The Inquiry Into The Matters Arising From The Death of Stephen Lawrence’.
4 A confidential telephone counselling service for children and young people up to the age of 19.20 Healing a divided Britain
Commission’) found that one in four of Mixed or Asian school leavers and 15%
the pupils surveyed said they were aware of White school leavers. Just 6% of Black
of peers in their school experiencing school leavers attended a Russell Group
prejudice-based bullying. The most university, compared with 12% of Mixed
commonly experienced bullying was or Asian school leavers and 11% of White
related to race, disability, sexual school leavers.
orientation and perceived socio-economic
There are stark differences by ethnicity in
status (Dennell and Logan, 2015).
the proportion of undergraduate students
who received a First/2:1 degree in a
1.4 Higher education HEI in 2013/14. A higher proportion of
Evidence shows that the percentage of White undergraduate students received a
people in Great Britain with a degree- First/2:1 degree (76.3%), compared with
level qualification increased from 21.4% ethnic minority undergraduate students
to 28.1% between 2008 and 2013. Since (60.3%). The gap was particularly high
2008, all ethnicities have seen an increase for male undergraduate students: 73.5%
in the proportion with a degree-level of White male undergraduate students
qualification, however compared with the received a First/2:1 degree compared
increase for White people (5.9 percentage with 46.2% of Black male undergraduate
points), a larger increase was seen for students (ECU, 2015).
all other ethnicities. Indians saw the
Recent analysis of official statistics by the
largest increase (18.1 percentage points),
TUC shows that ‘Black, Asian and minority
followed by ‘Other’ ethnicities (11.9
ethnic workers’6 with degrees are two and
percentage points), Pakistani/Bangladeshi
a half times more likely to be unemployed
people (9.7 percentage points) and
than White graduates. In addition, ethnic
African/Caribbean/Black people (9.6
minority7 workers with GCSE equivalents
percentage points).
and basic level qualifications are more
In 2013, African/Caribbean/Black (34.7%), than twice as likely to be out of work
Indian (49.5%), Mixed (36.6%) and ‘Other’ (TUC, 2016).
(40.2%) ethnic minorities had a higher
The unemployment rate for White workers
percentage of degree-level qualifications
with degrees is 2.3%, for ethnic minority
than White (26.8%) and Pakistani/
graduates this is 5.9%. At every level
Bangladeshi students (27.6%).
of education, jobless rates are much
However, just 13% of Black school leavers higher for ethnic minority workers. For
attended a top third5 higher education example, ethnic minority workers with
institution (HEI), compared with19-20% of A-level equivalents (including trade
5‘Top third’ universities are identified as those in the top third on the basis of entry requirements (UCAS tariff
scores) in 2011/12.
6 ‘Black, Asian and minority ethnic workers’ includes all workers who did not identify as White British, White
Irish, White Gypsy/Irish Traveller or White Other. ‘Black workers’ is a smaller subset of this group, including
those who identified as Black, African, Black Caribbean, or Black British.
7 TUC employs the term ‘BAME’ meaning ‘Black, Asian and minority ethnic’. This term has been replaced by
the equivalent, ‘ethnic minority’, in line with the Commission’s editorial policy.Part 2: ‘Is Britain Fairer?’ evidence for race
21
apprenticeships and vocations) are 3.2 • Young ethnic minorities experienced the
times more likely to be unemployed than worst long-term employment outcomes.
their White counterparts (TUC, 2016). Between 2010 and 2015 they saw a
49% rise in unemployment compared
Recent research exploring the
with a fall of 1% in overall long-term
experiences of Black African and
youth unemployment and a 2% fall
Black Caribbean male graduates in
among young White people.
elite universities argues that they face
systemic barriers to entering the top UK • There was a considerable gap in the
universities.8 These include: a lack of percentage of White and ethnic minority
Black teachers and academics as role people starting apprenticeships (89%
models; Black men being labelled as compared with 2-5%).
‘trouble’ or low achievers’ by teachers
• Black workers with degrees earn 23.1%
in secondary school; and assumptions
less on average than White workers with
made about their capabilities due to their
degrees.
ethnicity (Dumangane, 2016).
• Black people who leave school with
GCSEs typically get paid 11.4% less
2. Work, income and than their White peers.
the economy • Much lower proportions of ethnic
minorities are in senior positions.
Key findings • Overall, people from ethnic minorities
Inequalities in employment and income more likely to live in substandard and
persist, and for many ethnic minorities this overcrowded accommodation and to live
impacts upon their standard of living and in poverty compared with White people
experience of poverty: across Britain.
• Unemployment rates across Britain • In Scotland, ethnic minority households
were significantly higher for people are much more likely to experience
from all other ethnic minorities (12.9%) overcrowding.
compared with for White people (6.3%) Evidence presented in this section can
in 2013. be found in ‘Is Britain Fairer?’ supporting
• Pakistani/Bangladeshi women were evidence papers ‘Domain G: Productive
less than half as likely to be employed and valued activities’ and ‘Domain F:
compared with average employment Standard of living’ (unless otherwise
rates for other women. stated). These are available at: https://
www.equalityhumanrights.com/en/britain-
fairer-report/supporting-evidence
8 Refers to ‘top third’ universities as those in the top third on the basis of entry requirements
(UCAS tariff scores).22 Healing a divided Britain
2.1 Employment in elementary occupations (farm, process
plant or service work): 22% in England
In Great Britain, the ethnic minority and Wales; and 20% in Scotland.
employment rate in 2015 was 62.8%, an
increase of 3.2 percentage points from The 2011 Census revealed that the
2010 (DWP, 2016). In 2016, 109,000 highest proportion of people (over the age
more women from an ethnic minority of 16) with no qualifications was Gypsy or
were in employment than in 2014 (DWP, Irish Travellers (60%) compared with 23%
2016). The gap in employment rates for all ethnic minorities across England
between ethnic minorities and the overall and Wales. Equivalent figures for Scotland
population has decreased. In particular show that 50% of Gypsy/Travellers had
there has been significant improvement no qualifications in 2015, compared with
for the Pakistani/Bangladeshi population 27% for Scotland as a whole. Around
from 42% in 2005 to 55% (DWP, 2016). half (49%) of Gypsy/Travellers were
economically active, compared with
However, Black men and women 63% for Scotland as a whole (Scottish
experienced some of the largest falls in Government, 2015a).
full-time employment between 2006 and
2008, and in 2013 across the UK (Hills et Black and Asian workers are moving
al., 2015). This coincided with the 2008 into more insecure forms of employment
recession and the austerity measures at higher rates than White workers.
implemented after 2010. They were twice as likely (4.3%) to be
in involuntary temporary employment
Pakistani/Bangladeshi women were in 2014 compared with White workers
less than half as likely to be employed (2.1%). They are more than twice as likely
compared with the average employment to be in agency work. This increased by
rates for other female respondents (ONS, nearly 40% between 2011 and 2014 for
2015a). Black and Asian workers, compared with a
Gypsy and Irish Travellers had the lowest 16% rise for White workers (TUC, 2015).
levels of economic activity in England and In 2015, the ethnic minority unemployment
Wales (47% compared with 63% for all rate in Great Britain was 9.9%, a
England and Wales) according to the 2011 decrease of 3.2 percentage points from
Census. Just over half of Gypsies and 2010 (DWP, 2016). Evidence shows that
Travellers in England, Wales and Scotland unemployment rates were significantly
were economically inactive. The most higher for people from all other ethnic
common reason given for those who were minorities (12.9%) compared with White
economically inactive was looking after people (6.3%) in 2013. The lowest
the home or family (27%). unemployment rate was among Indians
Gypsy or Irish Travellers (aged 16 and (9.2%) and the highest among Pakistanis/
over) in employment were most commonly Bangladeshis (17.3%), African/Caribbean/Part 2: ‘Is Britain Fairer?’ evidence for race
23
Black people (15.5%) and Mixed ethnic White people. The lowest employment
minorities (15.2%). rates were for people with ‘Other’
ethnicity (56.0%) and for Pakistani and
Further analysis of ethnic minority
Bangladeshi people (42.9%).
unemployment rates suggests there are
particular gender/ethnicity/geographic Unemployment rates for people
patterns and concentrations of high from ethnic minorities (13.2%) were
unemployment (Vizard et al., 2015; significantly higher than for White people
Catney and Sabater, 2015). (6.9%). The 2011 Census found that in
Scotland, Polish people had the highest
There are also signs that young ethnic
rates of work – 81% were either employed
minorities in the UK may be experiencing
or self-employed. Gypsy/Travellers,
worse long-term employment outcomes
Arab and Chinese people were the least
than White young people. In 2015,
likely to be in work. However, Arab and
there were 41,000 16 to 24 year olds
Chinese people included a high proportion
from ethnic minority communities who
of students. African people were most
were long-term unemployed, a rise
likely to be unemployed (15%), followed
of 49% since 2010. This is compared
by Caribbean or Black people (11%)
with a fall of 1% in overall long-term
and Gypsy/Travellers (9%) (Scottish
youth unemployment and a 2% fall in
Government, 2015c).
unemployment among young White
people (Runnymede, 2015). The Scottish Equal Opportunities
Committee9 found that the world of work
In Wales, static employment rates
in 2016 was still not representative of
meant that substantial gaps between
the communities and people of Scotland.
ethnic minority (51%) and White people
The report found that people from ethnic
(72%) persist. Unemployment for most
minorities were, on average, more likely
ethnic minorities rose between 2008
to be unemployed or in low-paid work
and 2013. This followed the 2008
than White people, despite their overall
recession and austerity measures from
better performance academically. The
2010. Employment is the area in which
Committee called for employment and
people from ethnic minority backgrounds
recruitment practices to be improved in
considered they were least likely to be
order to tackle racism and discrimination
treated fairly (Race Council Cymru, 2012).
(Scottish Parliament, 2016).
In Scotland, there was a significant gap
It is important to acknowledge that there
between the employment rate of people
are further differences in employment
from ethnic minorities and that of White
based on people’s religion that also
people in both 2008 and 2013. In 2013,
intersect with race. For example,
57.4% of people from ethnic minorities
Muslims experience the worst outcomes
were in work, compared with 73.8% of
9The remit of the Equal Opportunities Committee is to consider and report on matters relating to equal
opportunities and upon the observance of equal opportunities within the Scottish Parliament.24 Healing a divided Britain
in employment and there are specific In Scotland in 2013, Gypsy/Travellers
patterns for Muslim men and women. were twice as likely to be self-employed
Muslims have experienced the highest compared with the general population
unemployment rates and lowest – 24% compared with 12%. In 2014-15,
employment rates across England, Wales the self-employment rate was highest
and Scotland. For a fuller discussion for Pakistani (32%), Chinese (23%) and
of the evidence, see ‘Is Britain Fairer?’ Indian (22%) groups. Bangladeshi and
(EHRC, 2015). other South Asian groups also had high
rates of self-employment (20% for both
2.1.1 Self-employment groups).
Self-employment accounted for 44% of
Significant occupational segregation is
the net rise in employment in Great Britain
also apparent in Scotland, with 38% of
since mid-2010 (TUC, 2014). There were
Indians employed in wholesale/retail
substantial declines in average pay for
industries (against a 15% national figure)
self-employed people, and their median
and 32% of Chinese people employed in
income fell by 22% between 2008/09
the accommodation and food industries
and 2012/13. This was more than for
(against a 6% national figure).
employed people.
There are considerable disparities 2.1.2 Managerial positions
between ethnic minorities in self- In Britain, significantly lower percentages
employment rates (Clark and Drinkwater, of ethnic minorities (8.8%) worked as
2007; Nazroo and Kapadia, 2013; Brown Managers, Directors and Senior Officials
et al., 2013) as well as strong national compared with White people (10.7%).
and regional patterns. South Asian men, This was particularly true of the African/
especially Pakistani men, have tended Caribbean/Black group (5.7%) and the
to concentrate on this form of activity, Mixed ethnicity group (7.2%). By the end
while Black people and women from of 2014, ethnic minority representation
any ethnic minority have not tended to in FTSE 100 boardrooms was 5%. All-
be self-employed (with the exception of White executive teams ran 69% of FTSE
Chinese women). The pattern is even 100 companies and 95% of FTSE 100
more marked when considering those that board directors were White (Green Park,
are UK-born and those that are foreign- 2014). There are currently just two FTSE
born. A little over half of Pakistani men in 100 companies with an ethnic minority
the transport sector were self-employed person as Chair (Green Park, 2015).
(53% of workers) (Clark, 2014). Gypsy or Although in the public sector, ethnic
Irish Travellers had the highest proportion minority representation in the civil service
of self-employed workers compared with increased from 4% in 1988 to 10% in
other ethnic minorities (Clark, 2014). 2014, their representation in the Senior
Civil Service was only 7% (NAO, 2015).Part 2: ‘Is Britain Fairer?’ evidence for race
25
In Scotland, people from an average than White workers with degrees.
ethnic minority background are On average, a Black worker with a degree
underrepresented in senior management will earn £14.33 an hour, compared
positions (Scottish Parliament, 2016). In with £18.63 for a White graduate. Black
Wales, ethnic minority people remain less workers with A-levels earn 14.3% less on
likely to be in senior roles. average than their White counterparts.
Moreover, Black people who leave school
2.2 Pay with GCSEs typically get paid 11.4%
less than their White peers. The pay gap
Overall, Pakistani/Bangladeshi and ‘Other’
between White workers and all ethnic
ethnicity groups received lower pay than
minority minorities, regardless of their
White people in Britain, with both groups
educational attainment, is 5.6%, and is
having an average pay of less than £10/
12.8% for Black workers (TUC, 2016a).
hour in 2013. Bangladeshi men had the
lowest pay of all ethnic minorities. Black Research conducted by the Institute for
men and their families have seen the Social and Economic Research indicates
largest regressions in pay and income that factors such as parental background
since 2010. Conversely, the Indian ethnic and local area are more important for
group did not experience a significant labour market outcomes for ethnic
reduction in average pay which resulted in minority graduates than they are for
a positive pay gap in 2013; Indians were White British graduates. Ethnic minority
paid 8.9% more per hour on average than graduates who do not benefit from
the White ethnic group. The number of financial support from their parents earn
Black and Asian workers in low-paid jobs less and are less likely to be employed
increased by 12.7% between 2011 and compared with White British graduates in
2014, compared with a 1.8% increase the same situation. Ethnic minority women
for White workers. In Wales, the pay from a less advantaged background
gap between White and ethnic minority (except Indian and Chinese women) earn
people widened between 2008 and 2013. significantly less than White women, while
Sikhs saw a particularly large decline male Black Caribbean, Black African
in pay (£1.90 per hour) and both Sikhs and Pakistani graduates from a less
and Muslims have the highest pay gap advantaged background earn less than
compared with those with no religion White British male graduates (Zwysen and
earning around 20% less in 2013. Longhi, 2016).
The pay gap between White and Black
workers is at its widest for those with
2.3 Apprenticeships
university degrees. Analysis of official Apprenticeships were a key part of
statistics (by the TUC) shows that Black the UK Government and the devolved
workers with degrees earn 23.1% less on governments’ approach to get BritainYou can also read


