FANTA III - Minimum Dietary Diversity for Women A Guide to Measurement - FAO
←
→
Page content transcription
If your browser does not render page correctly, please read the page content below
FANTA III
FOOD AND NUTRITION
T E C H N I C A L A S S I S TA N C E

 Minimum Dietary Diversity for Women
 A Guide to Measurement
Minimum Dietary Diversity for Women
A Guide to Measurement

                                      Published by
               the Food and Agriculture Organization of the United Nations
                                          and
 USAID’s Food and Nutrition Technical Assistance III Project (FANTA), managed by FHI 360

                                      Rome, 2016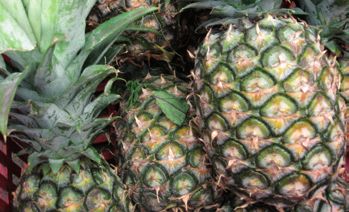
Recommended citation: FAO and FHI 360. 2016. Minimum Dietary Diversity for Women:
A Guide for Measurement. Rome: FAO.

The designations employed and the presentation of material in this information product do not imply the expression
of any opinion whatsoever on the part of the Food and Agriculture Organization of the United Nations (FAO), or of
FANTA/FHI 360 concerning the legal or development status of any country, territory, city or area or of its authorities,
or concerning the delimitation of its frontiers or boundaries. The mention of specific companies or products of
manufacturers, whether or not these have been patented, does not imply that these have been endorsed or
recommended by FAO, or FHI 360 in preference to others of a similar nature that are not mentioned.

Additional funding for this publication was made possible by the generous support of the American people through
the support of the Office of Health, Infectious Diseases, and Nutrition, Bureau for Global Health, U.S. Agency for
International Development (USAID), under terms of Cooperative Agreement AID-OAA-A-12-00005 through the Food
and Nutrition Technical Assistance III Project (FANTA), managed by FHI 360.

The views expressed in this information product are those of the author(s) and do not necessarily reflect the views or
policies of FAO, FHI 360, UC Davis, USAID or the U.S. Government.

FAO encourages the use, reproduction and dissemination of material in this information product. Except where
otherwise indicated, material may be copied, downloaded and printed for private study, research and teaching
purposes, or for use in non-commercial products or services, provided that appropriate acknowledgement of FAO
as the source and copyright holder is given and that FAO’s endorsement of users’ views, products or services is not
implied in any way.

All requests for translation and adaptation rights, and for resale and other commercial use rights should be made via
www.fao.org/contact-us/licence-request or addressed to copyright@fao.org.

FAO information products are available on the FAO website (www.fao.org/publications) and can be purchased
through publications-sales@fao.org

© FAO, 2016

ISBN 978-92-5-109153-1 (FAO)
Contents
Acknowledgements......................................................................................................................... i

Abbreviations and acronyms..........................................................................................................ii

Quick Start Guide..................................................................................................................................... iv

Section 1.           Introduction.............................................................................................................. 1

Section 2.           Description of food groups....................................................................................... 9

Section 3.           Model questionnaire.............................................................................................. 23

Section 4.           Preparing the MDD-W questionnaire..................................................................... 27

Section 5.           Selection and training of enumerators.................................................................. 33

Section 6.           Tabulation, presentation and interpretation.......................................................... 37

References ................................................................................................................................ 43

Appendix 1. Sampling and design issues specific to measurement of Minimum Dietary
            Diversity for Women of Reproductive Age............................................................ 45

Appendix 2. Guidance on assigning individual foods to food groups for Minimum Dietary
            Diversity for Women of Reproductive Age............................................................ 47

Appendix 3. Alternative method for collecting information on food groups consumed –
            the list-based method............................................................................................ 66

Appendix 4. Comparing Minimum Dietary Diversity for Women of Reproductive Age
            and Infant and Young Child Feeding Minimum Dietary Diversity.......................... 70

Minimum Dietary Diversity for Women A Guide to Measurement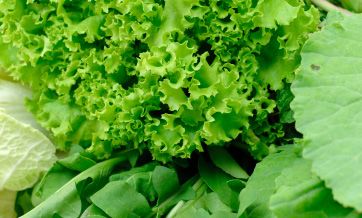
Acknowledgements
This document reflects many contributions. The writing team was led by Mary Arimond1 and Terri
Ballard2, and included Megan Deitchler3, Gina Kennedy4 and Yves Martin-Prével5. The authors are
very grateful to participants at a July 2014 consensus meeting and a January 2015 technical meeting
who shared field experiences and provided many insights that are reflected herein. See http://
www.fantaproject.org/monitoring-and-evaluation/minimum-dietary-diversity-women-indicator-
mddw for the meeting report from July 2014 and for the lists of participants at both meetings.
Previous versions of this document were reviewed by Elodie Becquey, Marie-Claude Dop, Leslie
Koo, Claudia Lazarte Pardo, Warren Lee, Mary Lung’aho, Judiann McNulty, Theodora Mouratidou,
Mourad Moursi and Anne Swindale; the authors are very grateful for the reviewers’ many insightful
comments. Pauline Allemand, Kiersten Johnson and Jef Leroy also made contributions on key points.
Development of this document was funded by the U.S. Agency for International Development
(USAID) through the Food and Nutrition Technical Assistance III Project (FANTA), the Food and
Agriculture Organization of the United Nations (FAO) and the World Food Center at the University
of California, Davis. Finally, the authors are very grateful to members of the Women’s Dietary
Diversity Project (WDDP), a long-running collaboration whose members, in addition to the five-
member writing team, include Pauline Allemand, Elodie Becquey, Alicia Carriquiry, Melissa Daniels,
Marie-Claude Dop, Elaine Ferguson, Nadia Fanou-Fogny, Maria Joseph-King, Warren Lee, Mourad
Moursi, Marie Ruel, Liv Elin Torheim and Doris Wiesmann. WDDP members have shared thoughts
and experiences for many years and these too are reflected within. However, the writing team is
responsible for the content and any errors.

1
  Program in International and Community Nutrition, University of California, Davis
2
  Food and Agriculture Organization of the United Nations
3
  FANTA/FHI 360
4
  Bioversity International
5
  Nutripass Research Unit, Institut de Recherche pour le Développement

Minimum Dietary Diversity for Women A Guide to Measurement                                      i
Abbreviations and acronyms
CAPI		    Computer-Assisted Personal Interviewing
FAO		     Food and Agriculture Organization of the United Nations
FBDG		    Food-based dietary guidelines
FCS		     Food Consumption Score
HDDS		    Household Dietary Diversity Score
IYCF		    Infant and young child feeding
MDD		     Minimum Dietary Diversity
MDD-W     Minimum Dietary Diversity for Women of Reproductive Age
MSG		     Monosodium glutamate
NRV		     Nutrient Reference Value
RE		      Retinol equivalents
RAE		     Retinol activity equivalents
UHT		     Ultra-high temperature
USAID		   U.S. Agency for International Development
WDDS		    Women’s Dietary Diversity Score
WFP		     World Food Programme
WHO		     World Health Organization
WRA		     Women of reproductive age

                                                                    ii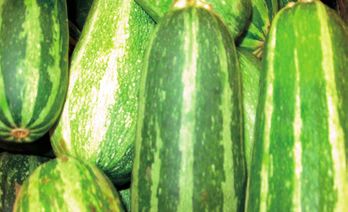
iii
QUICK START

Measuring women’s dietary diversity – Quick Start Guide
This Quick Start Guide provides hyperlinks to guidance on specific questions and tasks and also a
cautionary list of common errors (see box below).
All users should read the Quick Start Guide for an overview of available guidance and common pitfalls.
We encourage users with no prior experience with simple food group diversity indicators to consider
reading the full manual. Experienced users may find this page useful for quickly finding answers to specific
questions. Please also see the Frequently Asked Questions.
•     Why measure Minimum Dietary Diversity for Women of Reproductive Age (MDD-W)?
•     Indicator definition
•     Appropriate uses of the MDD-W indicator
•     Comparison with other food group diversity indicators (see also Appendix 4)
•     How to collect data – introducing the guided open recall
•     Survey sampling and design issues for food group recalls
•     Brief descriptions of the ten MDD-W food groups
•     Detailed food lists for the food groups
•     “Problem foods” that are difficult to classify
•     Model questionnaires to be adapted: open recall and list based method
•     Translating and adapting the questionnaire
•     Choosing and training enumerators
•     Example of instructions for enumerators
•     Tabulating the MDD-W indicator
•     Recommendations for presenting MDD-W results

                                           COMMON PITFALLS
Improper uses of MDD-W
  •    Do not use to assess diet quality of individual women.
  •    Do not use as a basis for developing dietary guidance; use standard best practices from the World
       Health Organization (WHO) and the Food and Agriculture Organization of the United Nations (FAO).
  •    Do not use to develop behaviour change messages; use standard best practices, for example,
       toolkits found from Alive & Thrive, The CHANGE Project, The C-Change Project, and K4Health.

Inadequate or incorrect preparation of questionnaires
  • If you cannot afford to adapt a model questionnaire to your context, reconsider collecting data for
     this indicator. Model questionnaires for open recalls and list-based methods are available. Guidance
     on adaptation is available.
  •    Do not drop or combine required food groups (rows) that are included on the model questionnaire.

Incorrect comparisons with other MDD-W surveys
  • Do not compare survey results from different seasons or agro-ecological zones without considering
      seasonal and harvest patterns. See guidance in Appendix 1.
  •    In pre-post designs, do not change the questionnaire and then compare between baseline and
       endline.

                                                                                                      iv
v
Section 1. Introduction

Background
Women of reproductive age (WRA)1 are often nutritionally vulnerable because of the physiological
demands of pregnancy and lactation. Requirements for most nutrients are higher for pregnant and
lactating women than for adult men (National Research Council, 2006; World Health Organization
[WHO]/Food and Agriculture Organization of the United Nations [FAO], 2004). Outside of pregnancy
and lactation, other than for iron, requirements for WRA may be similar to or lower than those
of adult men, but because women may be smaller and eat less (fewer calories), they require a
more nutrient-dense diet (Torheim and Arimond, 2013)2. Insufficient nutrient intakes before and
during pregnancy and lactation can affect both women and their infants. Yet in many resource-
poor environments, diet quality for WRA is very poor, and there are gaps between intakes and
requirements for a range of micronutrients (Arimond et al., 2010; Lee et al. 2013).
These vulnerabilities and gaps in diet quality have been recognised for a long time. However,
despite decades of appeals to improve women’s diet quality and nutrition, there has been little
programmatic action. Historically, one major impediment has been a lack of effective platforms and
programmes reaching adolescent girls and WRA outside of prenatal care. A lack of indicators to allow
for assessment, advocacy and accountability has been another constraint.
The Minimum Dietary Diversity for WRA (MDD-W)3 indicator defined and described in this document
is a food group diversity indicator that has been shown to reflect one key dimension of diet quality:
micronutrient adequacy, summarised across 11 micronutrients (Martin-Prével et al., 2015)4. The
indicator constitutes an important step towards filling the need for indicators for use in national and
subnational assessments. Such indicators must be relatively simple to collect and suitable for large
surveys5.
Promotion of diverse diets is one of several approaches to improving micronutrient nutrition
for WRA; additional diet quality indicators would be needed in settings where other strategies,
including fortification, biofortification and/or supplementation, are used. Furthermore, diet quality
is multidimensional. In addition to micronutrient adequacy, high-quality diets are characterised by
balance in intake of protein, carbohydrates and fat (Institute of Medicine, 2005) and moderation in
consumption of certain foods – those low in nutrient density and those associated with increased
risks for chronic disease (George et al., 2014). In the context of rapid nutrition transitions in many

1   For the purposes of this document and indicator, WRA are defined as those 15–49 years of age.
2   “Nutrient density” refers to the ratio of nutrients (such as vitamins and minerals) to the energy content of foods.
3   Additional background on the indicator is available at: http://www.fantaproject.org/monitoring-and-evaluation/
    minimum-dietary-diversity-women-indicator-mddw.
4   The 11 micronutrients were vitamin A, thiamine, riboflavin, niacin, vitamin B6, folate, vitamin B12, vitamin C,
    calcium, iron and zinc. See Arimond et al., 2010, and Martin-Prével et al., 2015, for the rationale for selection of
    micronutrients and for methods and results of a multistage research process assessing and comparing candidate
    indicators. See http://www.fantaproject.org/monitoring-and-evaluation/minimum-dietary-diversity-women-
    indicator-mddw for a description of a 2014 consensus meeting where stakeholders reviewed results and finalised
    indicator selection.
5   Many other indicators of diet quality can be generated from more detailed dietary surveys (e.g. those employing
    repeat quantitative 24-hour recalls or weighed food records), but at present detailed quantitative surveys are not
    feasible and affordable for repeated implementation in most low-income countries.

Minimum Dietary Diversity for Women A Guide to Measurement                                                           1
Section 1 Introduction
low- and middle-income countries, additional simple and feasible indicators are needed to reflect
these dimensions of balance and moderation.
It is beyond the scope of this guide to describe or operationalise a full set of indicators for diet
quality or nutrition for WRA. But consumption of food items from diverse food groups is universally
recommended, whether or not other strategies for improving nutrition are in place6, and similarly, an
indicator of food group diversity is relevant globally.
Indicator definition
The MDD-W is so named to harmonise with a similar Minimum Dietary Diversity (MDD) indicator for
infants and young children (WHO, 2008) (see p. 4 for a comparison of several food group diversity
indicators currently in use).
MDD-W is a dichotomous indicator of whether or not women 15–49 years of age7 have consumed
at least five out of ten defined food groups the previous day or night. The proportion of women
15–49 years of age who reach this minimum in a population can be used as a proxy indicator for
higher micronutrient adequacy, one important dimension of diet quality.
The ten food groups are:
1. Grains, white roots and tubers, and plantains 6. Eggs
2. Pulses (beans, peas and lentils) 7. Dark green leafy vegetables
3. Nuts and seeds 8. Other vitamin A-rich fruits and vegetables
4. Dairy 9. Other vegetables
5. Meat, poultry and fish 10. Other fruits
The food groups are described and defined in Section 2, and Appendix 2 provides a comprehensive
list of specific food items comprising each of the ten groups.
Appropriate uses of the indicator
The MDD-W was developed as a proxy indicator to reflect the micronutrient adequacy of women’s
diets. The main use of the MDD-W is for assessment at national and subnational levels. It is a
population-level indicator based on a recall period of a single day and night, so although data
are collected from individual women, the indicator cannot be used to describe diet quality for an
individual woman. This is because of normal day-to-day variability in individual intakes.
Groups of WRA where a higher proportion consume food items from at least five of the ten food
groups are likely to have higher micronutrient adequacy than other groups that have a lower
proportion of women achieving the threshold of food items from at least five food groups. Put
another way, a higher prevalence of MDD-W is a proxy for better micronutrient adequacy among
WRA in the population. Groups of WRA who consume food items from five or more of the ten groups
are also highly likely to consume at least one animal-source food and either pulses or nuts/seeds and
food items from two or more of the fruit/vegetable food groups (Martin-Prével et al., 2015).
6 See, for example, the WHO Healthy Diet Fact Sheet (http://www.who.int/mediacentre/factsheets/fs394/en/),
which summarises several WHO and FAO reports and advises that a healthy diet contains fruits, vegetables,
pulses, nuts and whole grains.
7 That is, women who have reached their 15th birthday but who have not yet reached their 50th birthday. This is
sometimes expressed as aged 15.0 to 49.9 years.
Minimum Dietary Diversity for Women A Guide to Measurement 2Section 1 Introduction
The MDD-W can be used:
• As a proxy to describe one important dimension of women’s diet quality (micronutrient
adequacy) in national and subnational assessments;
• To compare with previous assessments, so long as survey timing accounts for seasonality8.
The indicator should not be used to:
• Screen individuals for selection for interventions, nor to identify individuals at risk for poor
intakes.
In the context of programmes, this indicator may be useful when the programme design, activities
and impact pathway indicate a potential to increase food group diversity. Note that many agricultural
and health sector projects may improve nutrition, but only some will do so by increasing food group
diversity.
In many contexts, it will also be important to increase the quantity of nutrient-dense food groups
that are accessible and consumed by target groups. Programme users should note that consumption
of food items from five or more food groups, while useful as a population-level benchmark, does not
ensure micronutrient adequacy for the population, particularly if quantities of micronutrient-dense
foods consumed are too small.
Distinction between food group diversity indicators and food-based
dietary guidelines
Indicators and guidelines are often confused with each other. In the case of dietary diversity
indicators, this may be because many countries have developed food-based dietary guidelines
(FBDG) and graphics (pyramids, plates, etc.) that provide guidance to populations about consumption
of diverse diets and/or of food items from specific sets of food groups9. National FBDG are developed
through a structured process and are meant to shape policy and national programmes (Albert, 2007).
There is no global harmonisation of FBDG10, and the MDD-W threshold of at least five of ten food
groups may not align exactly with national recommendations. The indicator should not be confused
with a dietary guideline, nor should it be used as a basis to inform the development of guidelines or
programmatic behaviour change communication or counselling messages.
However, although the MDD-W food groups may not align perfectly with those recommended
for consumption in national FBDG, all such guidelines do advocate consumption of diverse food
groups. Thus, measurement of this dimension of diet quality, with an aim to assess and advocate for
improvement, is consistent with the principles behind dietary guidance given at country level. Also,
in many cases, the food groups on the MDD-W questionnaire could be aggregated during analysis to
reflect food groups in national FBDG and could provide information on consumption of these groups
in addition to the prevalence of meeting the MDD-W threshold.
8 Seasonality is important because the relationship between food group diversity and micronutrient intakes and
adequacy can vary by season. See Appendix 1 for a discussion of seasonality and of other considerations for survey
design and sampling.
9
FAO compiles national FBDG, which are available at http://www.fao.org/nutrition/nutrition-education/food-dietary-
guidelines/en/.
10 However, development of global guidance has been recommended in the Conference Outcome Document:
Framework for Action of the Second International Conference on Nutrition Rome 19–21 November 2014.
(“Recommendation 13: Develop, adopt and adapt, where appropriate, international guidelines on healthy diets”, p. 3).
3Section 1 Introduction
The advantage of using an indicator such as MDD-W rather than a measure tailored to an individual
country’s FBDG is the ability to compare across time and location, and even in the event that
national FBDG change.
Comparison with other food group diversity indicators
Dietary diversity has been measured in many different ways, in both research and programmatic
contexts. However, only a few simple food group diversity indicators have been promoted for wide
population-level use in resource-poor settings. These include the Household Dietary Diversity Score
(HDDS), the MDD and the Women’s Dietary Diversity Score (WDDS), which are compared with the
MDD-W in Table 1.
The WDDS resulted from a preliminary step in the process of developing the dichotomous MDD-W.
Earlier research resulted in a suggestion of several scores that reflected micronutrient adequacy;
however, no single score was proposed for global use (Arimond et al., 2010). One of these scores,
a WDDS based on nine food groups, was described by FAO (2011) and selected for use by the U.S.
Agency for International Development (USAID) Feed the Future and Food for Peace development
food assistance programmes, and others. However, demand for a dichotomous indicator grew,
particularly for use in policy and advocacy contexts. Another round of research with more data sets
replicated and extended the earlier study and resulted in the proposal of the MDD-W, a dichotomous
indicator based on a set of ten food groups (Martin-Prével et al., 2015).
In addition to the simple food group indicators in Table 1, a variety of more complex indicators and
indices have been used in specific countries or contexts. For example, the World Food Programme
(WFP) uses a more complex food group diversity indicator (the Food Consumption Score [FCS]) in the
context of food security analyses. The FCS is a weighted household-level food group score that also
incorporates frequency of consumption over 7 days (WFP, 2008).
4Section 1 Introduction
Table 1. Simple food group diversity indicators currently in use or advocated for use at
population level
HDDSa IYCF MDDb WDDSc MDD-Wd
Population Households Infants and young Women aged Women aged
sampled/unit of children aged 6–23 15–49 years 15–49 years
analysis months
Validated Kilocalorie Micronutrient Micronutrient Micronutrient
against availability as density compared adequacy assessed adequacy
assessed in with desirable by multiple assessed by
household-level density for 24-hour recalls multiple 24-hour
consumption complementary recalls
surveys foods, assessed
by 24-hour recall
or weighed food
records
Meaning Proxy for Proxy for the Proxy for the Proxy for the
household- adequacy of the probability of probability of
level access micronutrient micronutrient micronutrient
to kilocalories density of infant adequacy of adequacy of
(dietary energy), and young child women’s diets women’s diets
which is one diets
Reflects Reflects
dimension of
Reflects one of micronutrient micronutrient
household food
several favourable adequacy, which adequacy, which
security
infant and young is one critical is one critical
Reflects economic child feeding dimension of diet dimension of diet
access to a diet practices quality quality
with higher
kilocalories per
capita
Number of food 12 7 9 10e
groups
Threshold for No dichotomous 4 or more of the 7 No dichotomous 5 or more of the
dichotomous indicator food groups indicator 10 food groups
indicator
Indicator Yes No No No
tabulation
includes fats/
oils, sweets, and
all beverages,
including alcohol
Foods consumed Not included Included Included Included
outside the
home
a HDDS = Household Dietary Diversity Score; see http://www.fantaproject.org/monitoring-and-evaluation/household-
dietary-diversity-score and Food and Agriculture Organization of the United Nations (FAO) (2011).
b IYCF MDD = Minimum Dietary Diversity indicator, as an indicator of infant and young child feeding practices; see http://
www.who.int/maternal_child_adolescent/documents/9789241596664/en/.
c WDDS = Women’s Dietary Diversity Score; see FAO (2011).
d MDD-W = Minimum Dietary Diversity for Women of Reproductive Age
e During analytic work comparing candidate indicators to micronutrient adequacy for women, the 7-group IYCF MDD and
dichotomous indicators based on the 9 groups in the WDDS were explored but did not perform as well as the 10-group
MDD-W (Martin-Prével et al., 2015).
5Section 1 Introduction
Methodological approaches to measurement of food group diversity
While food group diversity indicators can be derived from detailed quantitative dietary intake
surveys, this guide is intended for users who are not in a position to conduct such surveys. When
relatively simple data collection approaches are required, as in a number of large-scale and multi-
module surveys, food group diversity indicators can be measured using two main methods: open
recall and list-based.
OPEN RECALL METHOD
In a qualitative open 24-hour recall (henceforth, “open recall”), the enumerator asks a series of
standard probing questions to help the respondent recall all foods and beverages consumed the
previous day and night and also probes for main ingredients in mixed dishes. Specifically, the recall
period covers from when the respondent awoke the previous day, through the day and night for a
24-hour period.
The recall is “open” because the enumerator does not read predefined foods/groups to the
respondent. Each food or beverage that the respondent mentions can be circled, underlined or
ticked on a predefined list. Foods not already included on the predefined list can be either classified
by the enumerator into an existing predefined food group or recorded in a separate place on the
questionnaire and coded later into one of the predefined food groups.
This method is recommended and is detailed in Section 3 (model questionnaire).
LIST-BASED METHOD
In the list-based method, the enumerator does read a list of foods and beverages to the
respondent. The enumerator informs respondents that they should respond “yes” for each food or
beverage consumed during the specified recall period of the previous day and night. The enumerator
continues by reading a list of foods organized in groups, giving multiple examples for each food
group.
There is anecdotal evidence that data collected with this method are less complete. An example
questionnaire and more details are given in Appendix 3.
COMPARISON OF METHODS
There are advantages and disadvantages to each method; these are detailed in Table 2. This guide
describes and recommends the open recall because it may lead to more accurate and complete
recall of all foods and beverages consumed.
Of key concern are the linked issues of respondent burden and the time needed (and thus cost) to
implement the recall. There is no universal answer regarding which method is quicker, because it
depends on the simplicity or complexity of the woman’s diet, on the length of the food group list11
and on the number of examples needed for each food group on a list-based questionnaire. When
diets are simple, the open recall is likely to be the quicker of the two.
11 See Section 2 for an explanation of required and optional food and beverages categories (rows) for the MDD-W
questionnaire.
6Section 1 Introduction
Table 2. Advantages and disadvantages of two recall methods
Open recall method List-based method
Advantages • Intuitive for both the enumerator • Possibly lower capacity requirements for
and the respondent enumerators
• Structured probing • Shorter training time for enumerators
• Enumerator (rather than • Easier to programme in Computer-Assisted
respondent) has the task of Personal Interviewing (CAPI) applicationsa
matching foods consumed with
food groups and examples listed
in questionnaire, leading to more
correct classification of foods
• May lead to more complete recall
of foods
Disadvantages • Longer training time required • Requires the respondent to correctly
identify foods she consumed as belonging to
• Requires enumerators to have food groups with examples as read from the
a good understanding of the list, which may result in misclassification of
objectives of the questionnaire and foods into food groups
reasonable knowledge of foods as
acquired, prepared and consumed • Requires the respondent to mentally “take
in the survey area(s) apart” mixed dishes and to remember to
respond for each main ingredient
• More difficult to programme
in Computer-Assisted Personal • Requires the respondent to mentally move
Interviewing (CAPI) applicationsa back and forth in time as foods are mentioned
• May be more likely to elicit biased responses,
for example, if respondents aim to please the
enumerator (by saying “yes”) or give untrue
positive responses for high-status foods, such
as meat
• May be more likely to lead to omission of foods
consumed, because there is no probing at the
level of the eating episode
• May lead to different results when the number
of food groups/food examples in the list differs
(e.g. from previous surveys or surveys in other
areas)
• Anecdotally reported to be more tedious for
respondents and enumerators, particularly
when food group lists are long
a CAPI applications allow direct data entry (no paper forms).
78
Section 2. Description of food groups

As noted in Section 1, MDD-W is a dichotomous indicator of whether or not women 15–49 years
of age have consumed at least five out of ten defined food groups the previous day or night. This
section provides a description of each of the ten MDD-W food groups:

 1. Grains, white roots and tubers, and plantains               6. Eggs
 2. Pulses (beans, peas and lentils)                            7. Dark green leafy vegetables
 3. Nuts and seeds                                              8. Other vitamin A-rich fruits and vegetables
 4. Dairy                                                       9. Other vegetables
 5. Meat, poultry and fish                                      10. Other fruits

The food groups that make up the MDD-W are mutually exclusive – that is, no food or ingredient is
placed in more than one food group. Note that on the model questionnaire (see Section 3), three of
the ten groups are further subdivided. This is for ease of recording and to make the questionnaire
more intuitive for enumerators. For example, the food group “Meat, poultry and fish” is recorded on
three rows (subgroups) on the questionnaire.
In addition, this section provides descriptions of six optional and two required categories12 (pages
17–19) that appear on the model questionnaire (Section 3) but that are not part of the indicator
calculation.

The optional categories are:
     •   Insects and other small protein foods                  •    Savoury and fried snacks
     •   Red palm oil                                           •    Sweets
     •   Other oils and fats                                    •    Sugar-sweetened beverages

The required categories are:
 •       Condiments and seasonings
 •       Other beverages and foods

The rationale for including both the optional and required categories is stated in the descriptions
below. Some of these categories are of interest in the context of the nutrition transition while other
categories are included primarily to provide a place for enumerators to mark each food and to
avoid falsely classifying items into one of the ten MDD-W groups. The “Condiments and seasonings”
category contains diverse foods and ingredients and is designed to avoid allowing foods consumed in
very small quantities to “count” in the MDD-W indicator. See Box 1 on page 13 for further discussion
of “how much is enough to count?” and of the “Condiments and seasonings” category.

12   These are referred to as “categories” rather than “groups” to avoid confusion with the MDD-W food groups.
     However, these, too, consist of lists of food or beverage items.

Minimum Dietary Diversity for Women A Guide to Measurement                                                       9
Section 2 Description of food groups
In addition to the descriptions in this section, detailed lists of foods belonging in each MDD-W food
group, as well as in the other categories, are provided in Appendix 2. Appendix 2 also includes a
table listing specific foods and ingredients that are difficult to classify.
A discussion of mixed dishes is provided at the end of this section.
Fortified foods and products
The MDD-W reflects healthy diversity in unfortified foods and is neither designed nor adequate for
assessing coverage or impact of fortification or biofortification programmes. Separate questions
on consumption of fortified foods and/or biofortified foods may be added to the questionnaire.
These will be context-specific and are not described in this guide. Such questions could also assess
coverage of specialised products, such as blended fortified foods (corn-soy blend, wheat-soy blend,
etc.) or ready-to-use foods.
Guidance is available elsewhere on monitoring and evaluation of fortification programmes (e.g.
WHO/FAO, 2006). Whether or not optional questions are developed and added to the model
questionnaire, for the purposes of MDD-W, fortified and biofortified foods should be classified in
their food group “home” (e.g. fortified wheat flour should be classified as a grain).
Selection of the ten food groups for MDD-W
Dietary diversity indicators group foods together when they are considered nutritionally similar
and/or play the same role in the diet (Ruel, 2003). While developing the MDD-W, many different
candidate indicators, with different numbers of food groups and different food group definitions,
were considered. The indicator based on the ten groups described here had a stronger relationship
to micronutrient adequacy than other candidate indicators with different groupings (Martin-Prével
et al., 2015).
Food group descriptions
Note that the food groups described here generally follow culinary, rather than botanical, definitions
and classifications for such items as fruits, vegetables and seeds. For example, tomatoes and peppers
are classified as vegetables rather than fruits, and the “Nuts and seeds” group includes only certain
types of seeds that are typically described as such in one or many cuisines (e.g. sesame seeds or
pumpkin/squash seeds).
GROUP 1 – GRAINS, WHITE ROOTS AND TUBERS, AND PLANTAINS
This group is sometimes also called “starchy staples”. These foods provide energy, varying amounts
of micronutrients (e.g. certain B vitamins provided by grains) and varying amounts of anti-nutrients,
such as phytates13. Note that white-fleshed plantains (a fruit) are included in this group because they
share a similar nutrient profile to some roots and tubers and play the same role in diets as a “starchy
staple” food.
Common examples from this group include all types of breads and flatbreads, stiff porridges of
maize, sorghum, millet or cassava (manioc), pasta, potatoes, white-fleshed sweet potatoes, white
yams, yucca and plantains.
13 Phytates are considered “anti-nutrients” because they bind with certain minerals and prevent absorption.
10Section 2 Description of food groups
GROUP 2 – PULSES (BEANS, PEAS AND LENTILS)
This group includes members of the plant family Fabaceae (alternate name Leguminoseae), such
as beans, peas and lentils. The seeds are harvested at maturity and dried and used as food or
processed into a variety of food products. This group does not include the same plants harvested
green or immature and eaten fresh in the pod – these are included in the “Other vegetables” group.
It also does not include groundnut (peanut) because while groundnut is in the Fabaceae family,
both its high fat content and most common culinary uses are different from other legumes and
similar to those of tree nuts. The pulses group does include mature seeds (beans) and processed
products, such as tofu, tempeh and other soy products. The group is high in protein and B vitamins,
although the protein is not “complete” and certain amino acids must be supplied by other foods.
Pulses represent a very important protein source in plant-based diets and among populations
where animal-source foods are largely unaffordable. Fat content of pulses is generally low, with the
exception of soybean. Pulses contain varying amounts of anti-nutrients that inhibit absorption of
certain nutrients.
Common examples from this group include common bean (black, kidney, pinto), broad bean (fava,
field bean), chickpea (garbanzo), pigeon pea, cowpea, lentil and soybean/soybean products or other
legume products.
GROUP 3 – NUTS AND SEEDS14
This group comprises mostly tree nuts but also includes groundnut (peanut) and may include
certain seeds when consumed in substantial quantities. While seeds are usually recorded in the
“Condiments and seasonings” category (below), they are included in the nuts/seeds category if they
are a substantial ingredient in local mixed dishes or if they are eaten as a substantial snack or side
dish. This group also includes nut and seed “butters”, such as pounded groundnut/peanut butter,
cashew butter or sesame butter (tahini), when consumed in substantial amounts and not merely
added to flavour mixed dishes. See “Condiments and seasonings” (below) and Box 1 for more
detailed discussion of when to include particular nuts and seeds in this food group. Note that oils
extracted from nuts and seeds are not included in this group.
Nuts and certain seeds are rich in unsaturated fatty acids, vegetable protein, fibre, minerals,
tocopherols, phytosterols and phenolic compounds. They may have unique health benefits (Alasalvar
and Bolling, 2015; Del Gobbo et al., 2015; Ros, 2015). With the exception of chestnuts, they generally
have a very high fat content.
Common tropical tree nuts include cashew, macadamia and Brazil nut; common nuts grown in
more temperate zones include almond, chestnut, hazelnut, pecan, pistachio and walnut. Peanut/
groundnut cultivars are grown in a wide range of climates. Commonly consumed seeds include
sesame, sunflower, pumpkin/squash/gourd and pine nut (see Appendix 2).
14 “Seeds” in the botanical sense includes a very broad range of items, including grains and pulses. However, in
culinary systems, there is usually a limited number of other seeds, typically high in fat content and consumed
as snacks or side dishes, in pastes or to season mixed dishes. For purposes of this grouping, “seeds” excludes
grains and pulses. The group also excludes seeds when they are added in small amount to flavour dishes (see Box
1). Examples of seeds that may be eaten in larger amounts include squash/melon/gourd seeds used as a main
ingredient in West African stews and sesame seed paste (tahini) in some dishes in Middle Eastern cuisines.
11Section 2 Description of food groups
GROUP 4 – DAIRY
Dairy foods are easily understood as a group and are important sources of high-quality protein,
potassium and calcium, as well as vitamin B12 (available only from animal-source foods) and other
micronutrients. This group includes almost all liquid and solid dairy products from cows, goats,
buffalo, sheep or camels. Tinned, powdered or ultra-high temperature (UHT) milk, soft and hard
cheeses and yoghurt and kefir are also included.
However, butter, cream and sour cream, ice cream, sweetened condensed milk and processed/
packaged “yoghurt drinks” are excluded. Butter, cream and sour cream are classified with fats and
oils because of their high fat content and most typical culinary uses. Ice cream and sweetened
condensed milk are classified with sweets. Commercially processed/packaged “yoghurt drinks” are
classified with sweet drinks, because these are usually high in sugar and low in dairy content. While
high-quality ice cream and yoghurt drinks can contain substantial amounts of dairy and associated
nutrients, cheaper and poorer-quality products do not, and the classification is aimed to avoid false
inflation of the proportion of women consuming nutritious dairy products.
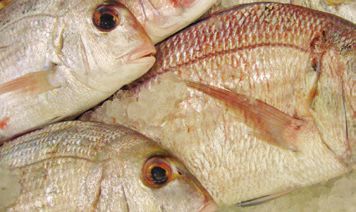
GROUP 5 – MEAT, POULTRY AND FISH
This group is sometimes referred to as “flesh foods”. All meats, organ meats, poultry and other
birds and fresh and dried fish and seafood/shellfish are included. Wild birds and mammals (“bush
meat”), snakes, frogs and other reptiles and amphibians are also included. On the questionnaire,
these appear as three subgroups: organ meat, meat and poultry, and fish/seafood. All flesh foods
are important sources of high-quality protein and bioavailable micronutrients, notably iron, zinc and
vitamin B12 (the last is available only from animal-source foods).
There is increasing interest in and concern regarding consumption of red meat and processed meats
(see, for example, Bouvard et al., 2015, and http://www.who.int/features/qa/cancer-red-meat/en/).
In some settings, consumption of animal-source foods is very low, while in others it is consumed in
excess of needs.
For the purposes of the MDD-W indicator, all flesh foods, including red meat and processed meat,
are included in this group. However, in settings where there are public health concerns about
excessive consumption and/or where processed meats are widely consumed, an additional row
could be added to the questionnaire to disaggregate and capture descriptive information about
specific types of meat of concern, i.e. to separate red meat and/or processed meat from other items.
For global comparability, however, these items should still “count” in MDD-W in the same way as
poultry or fish.
GROUP 6 – EGGS
This group includes eggs from any type of bird (domesticated poultry and wild birds) but not fish
roe, which are classified with small protein foods (see “Insects and other small protein foods”,
p. 17). Like other animal-source foods, eggs are a good source of protein, vitamin B12 and a range of
bioavailable micronutrients.
12Section 2 Description of food groups
Box 1. The issue of quantity – how much is enough to “count” towards food
group diversity?
Ideally, women of reproductive age (WRA) would consume adequate amounts of diverse
foods, such as fruits, vegetables, legumes, nuts and animal-source foods. But what is
“adequate”? Various national food-based dietary guidelines provide recommendations on
serving sizes and number of servings to consume from various food groups. However, there
is no global harmonisation of what constitutes a serving size or on recommended numbers of
servings per day for the various food groups.
Furthermore, Minimum Dietary Diversity for Women of Reproductive Age (MDD-W) was
developed exactly for situations where collection of quantitative dietary information is
not feasible, that is, where it is not feasible to ask about the number and size of servings
consumed.
So, how much is needed for a food group to “count” in the MDD-W? And how can this be
determined without asking about quantities?
Several studies suggest that even if it is not possible to assess servings or an “adequate”
amount, it is worthwhile to try to exclude very small quantities (Arimond et al., 2010; Gewa
et al., 2014; Martin-Prével et al., 2015). The relationship between food group diversity and
micronutrient adequacy is stronger when very small amounts of a food group are not allowed
to “count”. Several studies have used a cutoff of ≥15 g (for many foods that is about one
tablespoon). So for the purposes of defining “large-enough” quantities, consider if, when
consumed, the food is usually consumed by WRA in quantities ≥15 g.
Experience with large dietary diversity surveys has shown that it is both feasible and best to
define foods and ingredients that do and do not count for constructing the MDD-W indicator
during questionnaire adaptation – that is, before enumerator training and data collection
begin. Foods usually consumed in trivial quantities are placed in the “Condiments and
seasonings” category. Enumerators should know the principle of not counting small quantities
but should not be making decisions during data collection about whether or not a quantity is
sufficient to count.
When surveys will be repeated in the same geographic area across time, it is essential to
maintain the same definitions of foods that do and do not count across survey rounds. It
is also useful to aim for consistency among various users in the same geographic area and
to follow the same principles and process across different countries or geographic areas.
To promote consistency, this manual therefore provides a principle, suggestions for the
adaptation process (Section 4) and examples (Appendix 2).
• Principle: When necessary, err on the side of not falsely inflating food group diversity.
This is particularly important when foods or ingredients are expensive and the poorest
and most vulnerable women are those most likely to consume trivial amounts.
• Process: Engage nutrition experts in questionnaire adaptation. When this is not
feasible, follow the classification decisions in this manual (Appendix 2) for classifying
items into the “Condiments and seasonings” category.
13Section 2 Description of food groups
Box 1. continued
Condiments and seasonings
Condiments and seasonings are food ingredients that are either usually or often used in
small quantities in the “family pot” or in foods prepared outside the home. Often these
food items are added to provide flavour. Common examples include all fresh or dried herbs,
spices, chili peppers, garlic, ginger root, fish powder, bean paste, fermented bean paste,
tomato paste, seeds added for flavouring, bouillon cubes and similar flavour cubes, soy
sauce, fish sauce and pepper sauce (see also Appendix 2). Some of these are very nutritious
but the amount consumed by individuals consuming the dish is most often very small.
Furthermore, in cases where these ingredients are expensive, the quantities added in
poorer households may be smaller than in better-off households.
In the MDD-W method described in this manual, these items are placed in the “Condiments
and seasonings” category and do not count in the ten food groups that comprise MDD-W
(see Section 6 on tabulation of the indicator). This reflects a judgement that the risk
of falsely inflating food group diversity is more serious than the risk of excluding these
items and underestimating diversity for the relatively small number of instances where
consumption of these items might be more substantial.
During survey adaptation (Section 4), survey designers can decide if there are culturally
specific exceptions to this – for example, if there are situations where seeds or seed pastes
are usually eaten in large quantities. In some settings, there may be additional context- and
cuisine-specific items that are usually used in trivial amounts and should be excluded from
the count by placing them in the “Condiments and seasonings” category (e.g. small amounts
of nuts, legumes or grated vegetables if usually used to top dishes). These items can also be
added to the “Condiments and seasonings” category at the discretion of nutrition experts
involved in survey adaptation.
These types of decisions should be taken only in consultation with experts; when this is not
possible, follow the classification decisions suggested in this manual.
14Section 2 Description of food groups
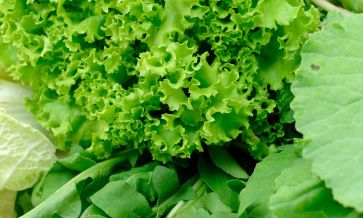
GROUP 7 – DARK GREEN LEAFY VEGETABLES
Essentially all medium-to-dark green leafy vegetables are vitamin A-rich (see Box 2 for criteria for
classifying items as vitamin A-rich). Only very light leaves, such as iceberg lettuce, are not. Medium
green leaves, such as Chinese cabbage, romaine and bibb lettuce, along with darker greens, are all
vitamin A-rich and are included in this group. In addition to being rich in vitamin A, many green leafy
vegetables are rich in folate and several other micronutrients.
Commonly consumed leaves vary widely by country and region, and include many wild and foraged
species, as well as the green leaves of other food crops (e.g. cassava leaves, bean leaves, pumpkin
leaves, amaranth leaves and others). See Appendix 2 for a detailed list of cultivated leafy vegetables.
In the absence of information on nutrient content, wild/foraged leaves that are medium-to-dark
green can be assumed to be vitamin A-rich and placed in this group.
Box 2. Criteria for defining foods and liquids as “sources” of vitamin A
For plant foods: Foods providing at least 120 retinol equivalents (RE) per 100 g are considered
“sources” of vitamin A.* This is roughly equivalent to 60 retinol activity equivalents (RAE).
Food composition tables may report vitamin A content of foods using the older RE units or the
more recently adopted RAE.
For liquids (e.g. juices): Liquids providing 60 RE or 30 RAE per 100 g are considered to be
sources of vitamin A.
*120 RE per 100 g corresponds to 15 percent of the Nutrient Reference Value (NRV; 800
RE) established by the Codex Alimentarius. The Codex standard for identifying a food as a
“source” of any nutrient states that the food should provide any of the following: 15 percent
per 100 g solid food, 7.5 percent per 100 g liquids, 5 percent per 100 kcal or 15 percent per
serving. To be identified as a “high source”, the food must provide twice this amount (e.g. 30
percent or 240 RE per 100 g solid food). The NRVs are set at a level that should meet the needs
of approximately 97 percent of individuals in the age/sex group with highest needs (excluding
pregnant and lactating women). For the definition of “source”, see Codex Alimentarius
Commission, Guidelines adopted 1997, revised 2004. For the definition of NRV, see Codex
Alimentarius Commission, Guidelines adopted 1985, revised 1993 (for all Codex Standards,
see http://www.codexalimentarius.org/).
15Section 2 Description of food groups
GROUP 8 – OTHER VITAMIN A-RICH FRUITS AND VEGETABLES
This group includes both vitamin A-rich fruits and a small but diverse group of vitamin A-rich
vegetables other than leafy greens. These foods may also be good sources of vitamin C and/or folate
and/or other micronutrients. While “Other vitamin A-rich fruits and vegetables” constitutes one
of the ten distinct food groups in the indicator, fruits are listed separately from vegetables on the
questionnaire, as this may be more intuitive for enumerators.
The most common vitamin A-rich fruits are ripe mango and ripe papaya; others include red palm
fruit/pulp, passion fruit, apricot and several types of melon. When eaten “green” (unripe), mango
and papaya are not rich in vitamin A and if consumed “green” should be classified with “Other
fruits”.
Certain varieties of ripe, deep yellow-fleshed or orange-fleshed bananas are also rich in vitamin A,
but white/cream-fleshed bananas are not. Deep yellow-fleshed and orange-fleshed bananas may be
classified with vitamin A-rich fruits when their high vitamin A content is known to survey planners
and it is considered feasible to distinguish bananas by colour during fieldwork. Otherwise, all
bananas should be classified with “Other fruits” (see below), to avoid falsely inflating the proportion
of women consuming vitamin A-rich fruits and vegetables.
Other vitamin A-rich vegetables include orange-fleshed sweet potato, carrot, pumpkin and deep
yellow- or orange-fleshed squash. See Appendix 2 for a list of other vitamin A-rich fruits and
vegetables.
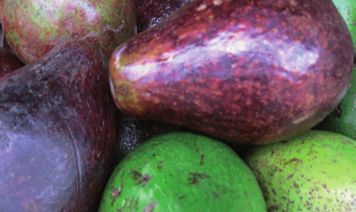
GROUP 9 – OTHER VEGETABLES
This group includes vegetables not counted above as dark green leafy vegetables or as other vitamin
A-rich vegetables. Diets rich in fruits and vegetables are associated with positive health outcomes.
This may be due to consumption of a range of bioactive compounds found in fruits and vegetables,
including phenolics, flavonoids and fibre, and not just to their commonly recognised role as sources
of micronutrients (Liu, 2013; Turati et al., 2015).
This group includes legumes when the fresh/green pod is consumed (as in fresh peas, snow peas,
snap peas or green beans). In general, the “Other vegetables” group follows the culinary definition
of a vegetable, not the botanical definition. It includes stems, fruits and flowers of plants when
generally consumed in savoury dishes and considered as vegetables in culinary systems. So,
for example, cucumber, tomato and okra (all fruits in botanical terms) are included as “Other
vegetables”.
However, this group excludes high-carbohydrate “starchy” roots and tubers, such as white potatoes,
white yams, cassava and cocoyam, because their nutrient contributions differ, even though they are
considered vegetables in some culinary definitions. Exclusion of roots and tubers is consistent with
how WHO documents define which vegetables count towards the recommended consumption of
fruits and vegetables15.
As with dark green leafy vegetables, commonly consumed vegetables vary widely with geography
and can include foraged as well as cultivated foods.
15 For example, see the Healthy Diet Fact Sheet at http://www.who.int/mediacentre/factsheets/fs394/en/, accessed
July 1, 2015, and Agudo, 2005.
16Section 2 Description of food groups
GROUP 10 – OTHER FRUITS
This group includes most fruits, excluding vitamin A-rich fruits. Health effects of diets rich in fruits
and vegetables were noted above. As with “Other vegetables”, this group follows the culinary
definition of fruits and so does not include tomatoes, etc., as explained above. Fruits are usually
easily recognised and classified as such. Note that plantains are classified with starchy staples
(Group 1, above), but sweet white bananas are classified with fruit.
As with vegetables, commonly consumed fruits vary widely with geography and can include foraged
as well as cultivated fruits. A detailed list is provided in Appendix 2.
OTHER FOOD CATEGORIES
The food categories listed below do not count in the construction of the MDD-W indicator.
Insects and small protein foods – optional
This category includes insects, insect larvae/grubs, insect eggs, fish roe, spiders, land and sea snails
and any other small invertebrates. It does not include frogs, snakes or other reptiles and amphibians,
which are included in the “Meat, poultry and fish” group.
Insects and other small protein foods are diverse and have diverse nutrient content. Considering
insects alone, it is estimated that there are more than 2,000 edible species, but nutrient data are
available for only about 10 percent of these (Rumpold and Schlüter, 2013). Data on quantities
consumed are also scant. For those species with nutrient composition data, it appears insects are
nutrient dense and could potentially provide protein, fatty acids and micronutrients. But information
on bioavailability is also lacking. Given these uncertainties, insects and other small protein foods
are not included in the MDD-W count (this is also in harmony with the IYCF MDD indicator). As with
condiments and several other items above, it is judged better to err on the side of not including/not
counting these small protein foods given the diversity in nutrient content and uncertainty about the
amount usually consumed. This avoids the risk of falsely inflating the proportion of women reported
to consume nutrient-dense animal-source foods.
Reasons for including this category on the questionnaire: the category includes highly nutritious
foods, and there may be an interest in knowing the proportion of WRA who are consuming these
foods. These foods are also being promoted to play a greater role in the future in filling nutrient gaps
(FAO, 2013).
If these foods are not eaten or are considered very rare throughout the survey area, this category
does not need to be included on the questionnaire.
Red palm oil – optional
This category includes only red palm oil, which is usually consumed as an ingredient in mixed dishes.
Reason for including this category on the questionnaire: red palm oil is extremely high in vitamin
A. In geographic areas where it is available, it may be of interest to know the proportion of WRA
consuming it. Note that the oily red palm fruit is classified as a vitamin A-rich fruit. In areas where
grown, either the oil or the oily fruit may be consumed, depending on the particular mixed dish.
If red palm oil is not available, not consumed or considered very rare throughout the survey area,
this category does not need to be included on the questionnaire.
17You can also read