YAMMER NETWORKS ||2018 - SWOOP ANALYTICS' BENCHMARKING OF
←
→
Page content transcription
If your browser does not render page correctly, please read the page content below

S WOOP ANAL YTIC S' B E NC HMARK ING O F

Y A M M E R N E T W O R K S || 2 0 1 8

                                                                                 AUTHORS:
                        Dr . La ur enc e Loc k Lee, C hi ef Sc i ent i s t a nd C o -Foun d er
        S h a r o n Da ws on, Di r ec t or , Ext er na l Rel a t i ons hi ps & C ommu n ication s
T ABLE O F CO NT E NTS

EXECU T I VE S U MMA RY                                                                  3

1      I NT R O D U C TI O N                                                             7
       1.1      Our 3rd Edition – What's New?                                            7
       1.2      The Changing Environment for Enterprise Collaboration                    8
       1.3      Why Benchmarking?                                                        9

2      S WO O P B E N C HMA RK I N G ME A S U RES                                       10
       2.1      Alignment with Enterprise Social Network Maturity                       10
       2.2      Outline of Each Measure We Benchmark Against                            12

3      BE NCH MA RK I N G RE S U L TS A N D I NSI GHT S                                 14
       3.1      Demographics                                                            14
       3.2      Previous Year Comparison                                                15
       3.3      Where are the biggest gaps between the best and worst?                  16
       3.4      Stepping your way up the ESN Maturity Curve                             17
                3.4.1     Platform Adoption                                             17
                3.4.2     User Engagement                                               20
                3.4.3     Connecting                                                    21
                3.4.4   Sharing                                                         22
                3.4.5   Problem Solving                                                 23
                3.4.6   Innovating                                                      25
       3.5      Summary                                                                 27

4      NE T WO RK P E RFO RMA N C E L E A D E RS                                        28
       4.1      Organizational Performance Comparisons                                  28
       4.2      Who are our Collaboration Champions?                                    30
                4.2.1     Hall & Wilcox                                                 31
                4.2.2     Real Foundations                                              33
                4.2.3     Union for Reform Judaism (URJ)                                35
                4.2.4     Medibank                                                      37
                4.2.5     Bankwest                                                      39
                4.2.6     KFC                                                           41
                4.2.7     Telstra                                                       43
                4.2.8     Syngenta                                                      45

5      CR O S S E N TE RP RI S E G RO U P B E N CHM A RKI NG                            48
       5.1      Curiosity Within Groups                                                 48
       5.2      Finding the 'Best Groups' Across All Enterprises                        50
                5.2.1     Summarized Benchmark Results                                  51
                5.2.2     Curious Results when Mapping Curiosity to Group Performance   53
       5.3      Champion Groups                                                         55
                5.3.1     Adopt and Embrace                                             55
                5.3.2     Union of Reform Judaism: Working Out Loud Group 12            57
                5.3.3     Blue Cross Blue Shield NC: New Media Group                    58

6      T O WARD S A RI C HE R N E TW O RK P ERFO RM A NCE M O DEL                       61
       6.1      Three Factor Performance Model                                          62
       6.2      Four Factor Online Cultrual Mapping Model                               63
                6.2.1    Sub-Cultures Aligned for Formal Organizational Structure       64
                6.2.2    A Clash of Sub-Cultures?                                       65
                6.2.3    Cultural Impacts of a Disruptional Change                      65

7      F I NAL W O RD S                                                                 66

AB O U T T H E AU THO RS                                                                68

                                                              2
EXECUTI VE S U M M AR Y

SWOOP Analytics provides a unique online social networking platform
which analyzes online interactions from Enterprise Social Networks
(ESN) in real time. Through SWOOP, we have collected anonymized
data from 74 organizations using Yammer over a six-month period.
The organizations ranged in size from 100 to 161,000 users (average
16,700), across a full breadth of industry sectors and geographies.
These 74 organizations represent more than 1.4 million users
conducting over 12 million interactions during our six-month study
period. This is the largest collaboration Yammer benchmarking analysis
ever performed.

This third edition of SWOOP’s benchmarking studies makes use of           This year we have
our collaboration benchmarking framework, which positions specific        introduced the SWOOP
measures against stages in the ESN maturity: Platform Adoption,
                                                                          Awards for achieving
User Engagement, Connecting, Sharing, Solving and Innovating.
                                                                          outstanding results in
Despite Yammer being considered the stalwart of Enterprise Social         the benchmarking.
Networking platforms, we have found significant improvement across
almost all of our collaboration indicators from previous years. Yammer    The awards have been made
networks are still growing and maturing. Even though we’ve seen           to the leading organizations in
many groups who have achieved excellent results, on average, we feel      each of the following categories:
Yammer usage is still short of achieving a critical mass to influence
the whole organization. The growth trajectory is positive, however, and   •   100-1000 employees
we are confident that this will be achieved for the majority of Yammer    •   1000-5000 employees
networks. Some of our benchmarking partners have been there               •   5000+ employees
from the start, a decade ago. Many more are new to using Yammer,
provided as part of their O365 subscription. There is still much to be    Their stories highlight best
learned from those that have been there before.                           practices and in this report
                                                                          we’ve shared examples of
Some Yammer groups formed as teams will potentially be moving             what has worked for these
to the Microsoft Teams platform, which we estimate, based on our          organizations. Common themes
analysis, represents some 10-15% of the active Yammer groups.             to success for all these leaders
This effect may be a plus for Yammer, leading to a stronger focus on      include;
important enterprise-wide challenges such as innovation, competency
development through social learning, enterprise knowledge sharing,        » Making Yammer part of their
                                                                              everyday work.
employee engagement, organizational culture transitions, policy
development and enterprise help forums.
                                                                          » A community manager to
                                                                              facilitate Yammer and
                                                                              engage staff.

                                                                          » Engagement from senior
                                                                              leaders and executives,
                                                                              ensuring front line staff feel
                                                                              connected to their leaders.

                                                                          » An emphasis on working
                                                                              out loud so everyone in the
                                                                              organization can benefit
                                                                              from conversations and
                                                                              knowledge sharing,
                                                                              leading to innovation.

                                                                          » Engaging with what staff are
                                                                              passionate about, often in
                                                                              the form of social groups.

                                                      3
2018 BENCHMARKING, KEY INSIGHTS
The key insights from this year’s benchmarking report:

» Yammer network                    » While we have seen             » The new Curiosity
   performance is still on             a big improvement                 Index (proportion
   the upward trajectory.              in reducing the                   of Posts and Replies
   Eight of the nine                   number of                         that include questions)
   performance metrics                 Broadcasters, the                 averaged 14%, but with
   that are comparable
                                       Broadcaster measure               a large range from
   with previous years showed
   stronger performance by,            was where the gap                 less than 3% to more
   on average, an                      between the best and              than 30%.
   impressive 30%.                     the worst was largest.            At the Enterprise level
                                       We therefore suggest those        we found that Curiosity
» The ‘big mover’ was                  enterprises new to Yammer
                                       should monitor this measure
                                                                         was positively correlated
                                                                         with the percentage of
   Reciprocity, which was              closely. Even if operating        Engager personas and
   a 66% improvement                   at the social media phase,        Diversity (participation
   on 2017.                            Broadcasters are likely           in multiple groups). This
                                       adding little value.              bodes well for breakthrough
   As our measure of
                                                                         innovation success; which
   cohesion, it suggests that
                                                                         requires all three of
   many of our benchmarking
   partners have managed            » Despite the improved               these indicators1.

   to progress beyond the              performance, Yammer
   social media maturity               usage is still falling        » At the group level
   phase to the social
                                       short of an adoption              we found the high
   networking phase,
   which prioritizes people            rate required to impact           performing smaller
   connections over content            whole organizations.              groups asked more
   consumption. The other
   big improvement is in
                                       An estimated 69% of               questions; perhaps
                                       employees are exposed to
   the reduction of the                                                  demonstrating more
                                       Yammer by at least reading
   proportion of Broadcasters
                                       messages but only 38%             agile working.
   by 56%, reinforcing the
                                       were contributing. Those          However, as the group sizes
   maturation beyond simple
                                       who actively contribute           grew, better performance
   content sharing.
                                       more than once every              was associated with asking
                                       two weeks make up 15%.            less questions. We suggest
                                       Yammer is a social network        this is a reflection of larger
                                       whose performance is              groups acting more as
                                       dictated by a strong ‘core’       information sharing forums
                                       of well-connected staff,          than the co-operative and
                                       so 100% of people posting         cohesive behaviors favored
                                       messages is never a               by our performance criteria.
                                       reasonable goal. We
                                       suggest a core of 25 – 30%
                                       active participants,
                                       containing a healthy
                                       sprinkling of senior
                                       management participation,
                                       could be sufficient. We
                                       estimate just under 30% of
                                       our benchmarking partners     1
                                                                       See http://www.optimice.com.au/upload/
                                       are currently operating at    Optimice_3Es_of_Innovation.pdf
                                       this level.                   for a networking perspective on innovation

                                                   4
WHAT HIGH PERFORMERS DO
We’ve enjoyed learning from our high-performing benchmarking partners what they believe has
contributed most to their success. In summary, our leaders:

» Make Yammer a part of their day to                      » Encourage groups to engage
   day work culture.                                        across the full membership, more
   For example, working out loud groups like                so than over-relying on a small
   Real Foundations’ “#What I’m Doing Today”;               core of leaders.
   Adopt & Embrace's “What I am Working on”;
                                                            The top performers employed a host of
   URJ’s “WOL Groups”. Others have aligned
                                                            innovative techniques to broadly engage staff
   formal business units with Yammer groups, like
                                                            on Yammer. Yam Jams, competitions, CEO
   KFC’s restaurants and Blue Cross Blue Shield
                                                            chats,“High Five” recognitions and fun selfie
   NC’s New Media group.
                                                            posts are just some examples.

» Have dedicated community                                » Encourage their membership to
   management resources.
                                                            explore and become active in multiple
   The community managers at Bankwest, URJ
                                                            groups; in this way building on their
   and Blue Cross Blue Shield NC emphasized the
   importance of “facilitation” over “management”           diversity of experiences.
   in this role.                                            Our leaders don’t stress over the large number
                                                            of inactive Yammer groups that are typically
                                                            formed. Providing the opportunity for staff to
» Know the importance of authentic                          explore a breadth of experiences, and allowing
   engagement from executives and                           groups to thrive or die organically, is seen as
   senior leaders.                                          appropriate.
  It allows front line workers to feel connected to
  their leaders and build trust. The most discussed       » Are innovative about the way
  topic in the nine years of using Yammer at
                                                            they use Yammer.
  Telstra, a network of 55,000 users, was marriage
  equality. Yammer became a safe place to have              Bankwest’s tracking of engagement around
  views heard thanks to support from the CEO                corporate messaging using #tags; URJ
  and senior leaders.                                       facilitating working out loud circles to build
                                                            diversity across their network; Hall & Wilcox
                                                            supporting staff in the field with real-time advice;
» Have a mix of knowledge-sharing                           Blue Cross Blue Shield NC’s coaching senior
   collaborative groups and larger                          executives on exposing their ‘full selves’ online,
                                                            are just a few examples.
   information sharing forums.
  The smaller knowledge sharing groups are more
  curious, with a higher proportion of their posts        » Engaging with what staff are
  containing questions. Real Foundations and Hall           passionate about, often this is
  & Wilcox declared ‘Knowledge Sharing’ as the
                                                            a social group.
  overriding mission for their Yammer network
  and achieved this through a mix of small and              Bankwest boasts one of the highest participation
  larger groups.                                            rates on Yammer, something it attributes to
                                                            encouraging staff to share pet photos and
                                                            restaurant reviews. Yammer was the forum
                                                            for discussion at Telstra about the same-sex
                                                            marriage vote in Australia and URJ responded
                                                            to the tragic Florida school shootings by
                                                            marshalling their youth network to join the
                                                            protest march on Washington DC on Yammer.

                                                      5
LIVING THE INNER/OUTER LOOP:
How much of Yammer’s lunch will
Microsoft Teams eat?

When Microsoft acquired Yammer in 2012, the
Enterprise collaboration space was open for
Yammer to dominate, with an expectation of
100% adoption being common. Today we see the
market split into Enterprise-wide and Team-based
collaboration; something Microsoft refers to as the
Inner and Outer Loop collaboration.

Our benchmarking tells us the adoption of Yammer            INTENDED READERSHIP
in organizations still sits below the 40% interactive
                                                            We anticipate those responsible for the
users mark, with a high of 75%. While we would all
like to aspire to the 100% target, we believe this          successful implementation of the Yammer
is not a requirement for a Yammer network to be             platform will gain most
successful. We discuss this aspect in more detail           from this report.
in section 3.3.1. The ‘Outer Loop’ is still seen as
a ‘discretionary participation’ option for
most staff.                                                 » The Community Manager is provided with
                                                               a structured approach, supported by analytics,
We would anticipate the Inner Loop Teams product               to shepherd groups and communities towards
should achieve a higher adoption rate, as for many,            achieving their true potential.
participation may not be discretionary at all. As we
begin to move SWOOP into these new ‘Inner Loop’             » Internal Communications Managers can
                                                               learn how to move beyond simply broadcasting
markets, we anticipate our benchmarking of Outer
                                                               corporate messages to engaging with their
Loop, Inner Loop and interactions between the two
                                                               audience through interactive conversation.
will be able to provide unique insights into how that
balance can best drive enterprise value through
effective collaboration at all levels.                      » The Human Resources Executive will find
                                                               measures that comfortably fit within their
                                                               scope of interests in ‘people analytics’.

                                                            » Senior Line Managers, CEO, COO and
                                                               Functional Leads will find familiarity with
                                                               the benchmarking approach from similar
                                                               experiences in their own lines of work. They
                                                               should find comfort that, as disruptive that an
                                                               Enterprise Social Network can be to traditional
                                                               lines of communication, the performance
                                                               improvement techniques devised from
                                                               decades of quality management experience
                                                               are still critical to business success.

                                                            » Finally, the Yammer group leaders themselves
                                                               will see how they compare with groups of similar
                                                               sizes, across more than 3,000 groups selected
                                                               from our benchmark data base.

                                                        6
1       INT R O DU CT I O N

1.1     Our 3rd Edition – What’s New?

We are excited to be able to present this 3rd Edition of our Yammer
Benchmarking results; each year gaining new and valuable insights
to share with the industry at large. In 2016 we started with just 16
organizations; but even at that time, it was unique for its breadth and
depth of analyses into how organizations really collaborate. In 2017 we
grew that sample to 57 organizations, with a much greater coverage
of organizations from all sectors and geographies. In 2018 we have
invested in bringing our benchmarking activities and our SWOOP
product into alignment and hosted on the same platform. This
provides us with a major new capability to access the most up to
date data and undertake ad hoc research and custom benchmarking
exercises. It also enables us to dig deeper into the data to analyze
collaboration performance.                                                    This year we have also added
                                                                              the proportion of Interactive
In this report, for the first time, we have benchmarked Yammer groups         Users and overall activity
across a majority of the benchmarked Yammer sites. We have added              levels as we wanted to find
new sites but also rationalized some of our older sites to come up with       the organizations that were
a sample of 74 organizations, ranging in size from 100 to 161,000             demonstrating the right
users (average 16,700), across a full breadth of industry sectors and         collaborative behaviors but
geographies. These 74 organizations represent more than 1.4 million           were also high frequency users.
users conducting over 12 million interactions during our six-month
study period.                                                                 One of our newest measures,
                                                                              the Curiosity Index, which
We will report on the key SWOOP indicators. Our intent is to make it          measures the degree to which
easy for SWOOP users to identify the benchmarking measures directly           people ask questions, has
with their SWOOP dashboards. Where it is appropriate, we will be              also been used this year, for
commentating on movements in the measures for 2018 compared                   information purposes. Our
with previous years.                                                          rationale is that successful
                                                                              organizations should always
We are celebrating the performances of our benchmark leaders, both            be willing to question and
at the enterprise and groups level. All of our benchmarking analyses          challenge the status quo. They
are presented using anonymised data; a condition we agree on with             should also be looking to create
our benchmarking partners. For our leaders, we have reached out               new value through innovation
to them and interviewed them to gain specific insights into practices         (the highest stage in our
they have undertaken to help them achieve their success. With their           maturity model – see section
permission, we have been able to share these best practices with you          2.1). Serendipitously, Harvard
in this report. After all, that is why we do benchmarking; to find out what   Professor Francesca Gino’s
works and to share with everyone else, for the benefit of all.                recent HBR article on “The
                                                                              Business Case for Curiosity3”
How do we determine our leaders? The process has evolved a little             agrees, suggesting that the
this year. In previous years we have drawn from academic research             most effective leaders look
that has identified the key performance indicators for a successful           for ways to nurture their
network, being its cohesion and diversity and how these indicators            employees’ curiosity to fuel
are maximised together. We have again relied most heavily on                  learning and discovery.
these two attributes:

»       Reciprocity (for cohesion)2 and                                       2
                                                                                Reciprocity is at times referred to as “Two-
                                                                              Way Relationships” in the report, being the
»       Diversity Index (for diversity).                                      terminology used on the SWOOP dashboard.
                                                                              Cohesion (and trust for that matter)
                                                                              are seen as a consequence of Reciprocity.

                                                                              3
                                                                                  https://hbr.org/2018/09/curiosity

                                                         7
1.2     The Changing Environment for
        Enterprise Collaboration

Yammer is celebrating its 10th birthday this year, and six years since
it was acquired by Microsoft. In ESN terms, this puts Yammer in the
‘elder statesman’ category. As an elder statesman, Yammer is being
challenged by newer market entrants. But Yammer remains a stalwart
in its class; with a mountain of experiences and lessons, ready to be
shared within the very substantial user base that Office365 represents.

The collaboration market has now clearly separated into Enterprise-
level and Team-level collaboration tools. Microsoft Teams was
launched in 2017 in reaction to the success of team-focused Slack
(and recently merged Hipchat)4. Workplace by Facebook launched in
2016 and is a direct competitor to Yammer and Microsoft Teams. It is
split into the same shared discussion vs private chat separation. Slack
is moving into the Yammer space with Slack Enterprise Grid connecting
various Slack sites. While the brand is the same, the software
partitioning between Enterprise and Teams is in place for all.

Another natural separation is inside versus outside the enterprise
with ‘customer collaboration’ tools forming a separate collaboration
market sector.

Functionally, there is much overlap between the different layers of
tools. While Yammer has always had the capability to support external
customer networks and team level chat, the market has spoken and
Yammer will be largely constrained to cross-enterprise collaboration,
foregoing the team space to Microsoft Teams and potentially Yammer
External Networks to customer collaboration tools, like Microsoft’s
LinkedIn acquisition, which together with Microsoft Dynamics
represent a powerful combination for external communities.

                                                CUSTOMER
              TEAMS                            COM M UNI TI ES
         (Microsoft Teams)               (LinkedIn / Microsoft Dynamics)

                              NE T W O R K S
                                (Yammer)
Figure 1 - Collaborating Your Way to Customer Success
                                                                           4
                                                                             https://www.cmswire.com/digital-
                                                                           workplace/slack-and-microsoft-teams-
While this might be seen as a retreat from earlier aspirations, we         is-enterprise-collaboration-a-two-
believe Yammer has a clear role to play. While some commentators are       horse-race/?utm_source=cmswire.
predicting a Microsoft Teams takeover5, we believe a natural order now     com&utm_medium=email&utm_
                                                                           campaign=cm&utm_content=nl-daily-
exists which prevents any single tool from becoming all encompassing.
                                                                           180808&mkt_tok=eyJpIjoiTXpWaVl6bGxZV0
Conveniently, Microsoft last year came out with its “Inner Loop –          k0WVRjMCIsInQiOiJ1M
Outer Loop” framework6 to describe how Yammer, Teams and
                                                                           5
Email effectively co-exist.                                                  https://en.share-gate.com/blog/microsoft-
                                                                           teams-vs-yammer

                                                                           6
                                                                             https://blogs.technet.microsoft.com/
                                                                           cloudyhappypeople/2017/09/28/now-it-
                                                                           makes-sense-microsofts-collaboration-story-
                                                                           in-a-single-slide/

                                                       8
We are very supportive of this characterization. Our earlier research
on multi-channel collaboration7, described in our 2017 benchmarking
report8, found organizations naturally gravitate towards particular
tools for different types of collaborations. And in Yammer’s case, it
played a clear role in horizontal and vertical connections for the whole
enterprise; more so than email, chat and process/project management
tools. We can anticipate the activity level will diminish as we move from
the ‘here and now’ Teams and Email collaboration, to the ‘explore and
develop’ Yammer collaboration and then the ‘engaging the customer’
Dynamics/LinkedIn collaborations. But activity is not always correlated
with success; as we have demonstrated previously9. It’s about finding
the ‘right’ amount and type of activity that really matters.

Within this reduced, but now more focused scope, we are in a position
to identify realistic goals and aspirations for Yammer. We believe
Yammer will still be the ‘go to’ tool in the Microsoft Office365 toolset
for innovation, competency development, employee engagement,
enterprise knowledge sharing, organizational culture transitions,
policy development and enterprise help forums.

We believe collaboration analytics will provide important guidance to
organizations and individuals as to how to best synthesize the different
levels of collaboration tools, to maximize enterprise value overall.

1.3     Why Benchmarking?

When organizations start out with a tool like Yammer, the Yammer             focused specifically on
leaders will often come to us saying their executives are asking the         social networking - enabled
‘ROI’ question. How can they best respond? Without resorting to an           collaborative performance.
auditable ROI, organizations can still judge how they are performing         In this third edition we have
against like organizations to assess their relative performance. And         benchmarked 74 organizations,
let’s face it, this is what most executives really want to know. Are we      ranging in size from 100
better than our competition? This is not something new. The ‘quality         to 161,000 users (average
movement’ has relied on benchmarking to assess organizational                16,700), across a full breadth
progress for decades. The popular business improvement method Six            of industry sectors and
Sigma identifies the benefits of Benchmarking10 as:                          geographies, over an extended
                                                                             six-month study period.
•       Providing a focus on best practices;
•       Strives for continuous improvement;
•       Enable partnering to share information;
•       Needed to maintain a competitive edge; and
•       Facilitates adaptation based on customer needs after
        examination of the best.

Benchmarking services11 are widely available across many
organizational disciplines and industry sectors for precisely this reason.   7
                                                                              http://www.swoopanalytics.com/why-90-
                                                                             of-organisations-would-not-survive-a-digital-
You do not have to be the ‘best’ in the world at everything but you do
                                                                             disruption/
want to compare favorably to those organizations that matter most to
you e.g. your closest competitors or other organizations you admire. To      8
                                                                               https://en.share-gate.com/blog/microsoft-
date, these benchmarking services do not extend to ESNs. And as we           teams-vs-yammer

have stated earlier, it’s not only about numbers, but the stories about      9
                                                                               https://www.cmswire.com/social-business/
how the new practices are making a real difference; and how these            the-smoke-and-mirrors-of-enterprise-social-
‘best’ practices can be shared for the benefit of all.                       networking-metrics/

                                                                             10
                                                                               https://www.isixsigma.com/methodology/
What we provide here is the world’s largest benchmarking analysis of
                                                                             benchmarking/understanding-purpose-and-
Yammer network performance. The dimensions for comparisons are               use-benchmarking/
the result of more than a decade of applied research and development,
                                                                             11
                                                                                  https://www.apqc.org/benchmarking

                                                        9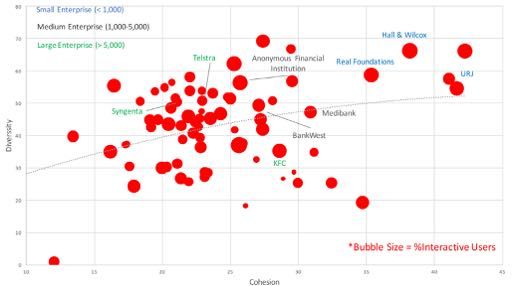
2       SWO O P BE NCH MA RK I N G ME A S U RE S

2.1     Alignment with Enterprise Social
        Network Maturity

The SWOOP dashboard measures according to an established ESN
maturity framework12, and full description of the maturity framework,
can be found in our ebook13.

The maturity framework identifies six stages of evolution of ESN
exploitation, from the initial stage of encouraging staff to log onto the
platform through to the use of the ESN to facilitate a fully innovating,
adaptive and responsive organization. Using SWOOP, we can trace
the journey from first digital experience, through to online collaboration
champion, using Yammer interaction data.

BENCHMARKS        BY Level
Benchmarks by Maturity MATURITY LEVEL
                                                                                  JOB FULFILMENT

                                          SOCIAL NETWORKING
                                                                                                         Innovating

      SOCIAL MEDIA
                                                                                      Solving
                                                           % Public Messages
                                                                                                      Diversity
                                                                                                      Curiosity
                                                               Sharing

                                                                               Reciprocity
                                                                               Response Rate
                                         Connecting

                                                           Threads / User
                       User                                Replies / Post
                                                           Public Messages
                    Engagement
                                        Influencer Risk
    Platform                            % Engagers
                                        % Catalysts
    Adoption
                                        % Responders
                   Activity Per User
                   Recognition
Observers          % Broadcaster
Active Users

Figure 2 - ESN Maturity Model

                                                                                 12
                                                                                  We acknowledge the contribution of prior
                                                                                 work from Siemens and Simon Terry to this
                                                                                 maturity framework.

                                                                                 13
                                                                                   http://www.swoopanalytics.com/
                                                                                 products/#ebook

                                                         10
The above graphic positions each SWOOP measure included in this
benchmarking report against the stage of ESN maturity14 it is most
related to. Two important transitions are identified that require a
significant change in the way both individuals and organizations
are thinking and acting:
1. Social Media to Social Networking
The first occurs when an organization becomes less reliant on
social media to attract staff (User Engagement Stage) and more
cognizant of the need for staff to connect and build relationships.
We call this the ‘Social Media’ to ‘Social Networking’ transition.
2. Social Networking to Job Fulfilment
The second important transition point occurs when we move
from happily connecting and sharing knowledge to acting on
that shared knowledge to create tangible value. We call this the
‘Social Networking’ to ‘Job Fulfilment’ transition. This is where the
rubber hits the road in terms of tangible business results (and
ROI). Everyone in the organization has a job to do. Increasingly,
these jobs are becoming interdependent on others. When the
job is done, be it a difficult problem solved, or a new opportunity
grasped, tangible enterprise value has been achieved.
Relationships can be leveraged to more effectively share
tacit knowledge, problem solve and ultimately create new
value through innovation.
When assessing each benchmarking indicator,
it is helpful to identify them with the maturity
stage for which they are most indicative.
14
http://www.swoopanalytics.com/blog/
enterprise-collaboration-maturity-frameworks/
112.2 Outline of Each Measure We Benchmark Against
The following table identifies the measures we have included in the benchmarking study and how each
SWOOP measure should be interpreted in relation to the ESN maturity stage.
Table 1 - Maturity Model Measures
SWOOP Benchmark Interpretation
STAGE 1: PLATFORM ADOPTION
Platform adoption is the initial stage when an ESN is newly launched and the key motivation is attracting
staff to its use.
Number of Users The number of people who have been given access to Yammer i.e. the size
of the potential participating membership.
Number of Interactive On launching a new ESN platform, this should be the first measure to
Users monitor. Basically, how many of the eligible staff have logged in and taken a
tangible action e.g. made a post or like etc. Excludes ‘reading’.
Observers Measures the proportion of Observers. Observers are classified as those
that have been interactive less than once every two weeks. Organizations
that score well on this measure have a low proportion of Observers.
STAGE 2: USER ENGAGEMENT (around content)
Initial user engagement is through the content of social media e.g. moving corporate news or
announcements to the ESN to facilitate active feedback.
Broadcasters Measures the proportion of Broadcasters. Broadcasters is one of the five
SWOOP personas. The Broadcaster is characterised by posting messages
but isn’t getting many replies or likes. The lower the score, the better.
Recognition Recognition is the percentage of all interactions that are ‘likes’ or ‘mentions’,
and it is a measure of ‘social recognition’. In the social media context, a ‘like’
or a ‘mention’ is usually an indicator of positive feedback on posted content.
Activity/User Measures the number of activities per person (post, reply and like). This
simple ratio can provide a quick assessment of engagement with the
platform. A high score indicates that activity isn’t being dominated by a
selected few.
STAGE 3: CONNECTING
The Connection stage marks the important transition from engaging with the platform and content, to
engaging with people. This is an important step in the move toward effective collaboration.
Distribution of: These are all SWOOP personas and depending on the context, individuals
• Engagers can play positive roles with any of them. That said, we prefer to see a high
• Catalysts proportion of Engagers, who are people who connect others. Catalysts
• Responders are also important because of the way they drive activity and connections.
• Broadcasters Responders are seen as the ‘care-givers’ and are key to sustaining
communities and groups.
Influencer Risk* This measures how reliant the organization is on a selected few power
networkers. Networks will always have a core and a periphery, but if that
core becomes too small, the network becomes at risk, should certain key
players leave the network. A lower Influencer Risk score means less risk or
higher resilience to the loss of core members.
12SWOOP Benchmark Interpretation
STAGE 4: SHARING
At this stage the organization is actively sharing knowledge. This may be in the form of explicit content, or in
the form of tacit knowledge, shared through rich and regular conversations.
Public Messages Measures the percentage of messages that have been posted in public
groups. This is an indicator of overall transparency. In general, we would like
to see this score to be high, indicating a maximum opportunity for broader
knowledge sharing.
Replies/Post This simple ratio is an indicator of how conversational a network has
become. Once the volume of Replies exceeds the number of Posts, we
can be confident that conversations facilitating tacit knowledge sharing are
starting to happen.
Threads Per User Discussion threads per user is used to assess the breadth with which online
discussions are pervading the organization. We can infer that if the majority
of participants are actively involved in conversation threads, then broad
based knowledge sharing is happening.
STAGE 5: SOLVING
Problem solving marks another important transition from knowledge sharing to action. Tangible benefits
only arise from positive actions i.e. job fulfilment. Organizations must reach this stage of maturity if they are
to demonstrate real tangible value.
Response Rate The response rate is an indicator of both how much an organization is
sharing its problems in the form of questions, and then how much people are
responding to them. It is one of the most direct measures of value available.
The measure only includes written replies i.e. excludes likes, mentions etc.,
to emphasize the importance of conversation.
Reciprocity This measures the degree to which connections are reciprocated, i.e. A
response to B, and B to A (replies, mentions or likes). We know that high
reciprocity leads to higher trust and therefore a higher potential for positive
actions. On the SWOOP platform this is called “Two-Way Relationships”.
STAGE 6: INNOVATING
This stage is placed as the final maturity stage, as it is an indication that an organization is creating new
value. It is also something that most organizations struggle with.
Diversity Successful innovation is regularly linked to diversity in an organization.
Diversity can be measured across many dimensions e.g. cross business
unit, geography, gender etc. In this benchmark we use the diversity across
Yammer group activity. An individual with high diversity would be equally
active across a large range of groups.
Curiosity Without questions, there is no change. This measure identifies the proportion
of posts and replies that are framed as questions. We infer that organizations
with relatively high curiosity are also likely to be more adaptive and
innovative.
It is important to appreciate that while this report is assessing Enterprise level performance against these
maturity stages; inside the Enterprise, there will be different groups at different stages of maturity.
More on this later.
133 BEN CH M AR K I NG RE S U L TS & I N S I G HTS
3.1 Demographics
Our sample is formed from organizations with a minimum of 100 active participants.
Participants by GICS Sector
Figure 3 - GICS Industry Segmentation
Using the Global Industry Classification Standard (GICS), we can see
the sample has representation across all sectors. A high proportion
of the benchmarked organizations are global in their operations.
Headquarters are located in the United States, United Kingdom,
Canada, Switzerland, Australia, Japan, India, Mexico
and Sweden.
143.2 Previous Year Comparison
As we indicated, the majority of comparable measures compared with
results from our 2017 report have shown a healthy improvement. The
following table provides a year on year comparison:
Table 2 - Year on Year Comparison
Measure 2017 2018 % Movement
Reciprocity 14.6 24.2 66%
Broadcasters* 18 8 56%
Activity/User 21 29 38%
Threads / User 2.05 2.71 32%
Reply/post 1.34 1.72 28%
Diversity 36 42.5 18%
Response rate 40 46 15%
Observers* 68 59 13%
Recognition 56 61 9%
Public
74 68 -8%
Messages
*Lower score is better
Academic research has identified cohesion as one of the key
performance indicators for a successful network, and since
Reciprocity is our chosen proxy for cohesion, it is therefore
gratifying to find its improvement at the top of the table.
Seeing a reduction in the number of Broadcasters is equally
gratifying. However, this measure also shows the greatest
variation amongst our benchmarking partners –
see section 3.3.
The Activity/User measure indicates how the Yammer activity is
increasingly being shared across all users, and like the other
measures is an indication of a stronger ESN maturity.
153.3 Where are the biggest gaps between the best and worst?
Benchmarking offers the opportunity to learn from the measured highest performing organizations. Areas
of greatest opportunity for improvement exist where there is a large range of scores. Where large variances
exist in a key maturity dimension, the strength of the opportunity is amplified. The following graphic plots the
average variances for each of the benchmarked dimensions:
Relative Variance - Scope for Improvement
Figure 4 - Improvement Potential from Benchmarking
As the chart shows, reducing the proportion of Broadcasters
is the biggest opportunity for improvement.
It appears many of the new entries into our benchmarking are
newcomers to Yammer and still operating at the ‘Social Media’
phase of maturity. These organizations are still looking to engage
staff through posting content; and in this case, not very engaging
content. The Broadcaster persona describes individuals whose posts
attract little or no reaction. Organizations with a high proportion of
Broadcasters are not making effective use of the Yammer platform.
The Threads/User measure (not yet on the SWOOP dashboard)
measures how well discussions are spread across the user base.
A low score indicates discussions are only occurring within a limited
number of cliques. The Activity/Active User measure is a generic
‘adoption’ measure. Similar to the Threads/User measure, it looks
to see how pervasive the engagement is across those that have
already been active at some stage.
We note that the key performance indicator of Two-Way Relationships
(reciprocity) has moved down the list since 2016, indicating that
for this dimension, the gap between the best and worst performing
organizations is narrowing.
163.4 Stepping Your Way Up the ESN Maturity Curve
We structure our benchmarking reports around the ESN Maturity framework. We will report on the
benchmarking results as they relate to each maturity stage. We also suggest realistic targets for each
metric, based on what has already been achieved by our best practice leaders.
3.4.1 PLATFORM ADOPTION
At this very early stage, we are most concerned to use the average registered users for the most
with getting staff to experience the Yammer recent 30-day period.
platform. One obvious measure is to identify the
percentage of staff that has logged on. This will be ‘Interactive users’ are defined as those that have
a meaningful measure for many but for some, the made an active contribution e.g. pushed the ‘like’
figures could be skewed by policy decisions made button or more. The average performance is 38%
about how the platform is initially introduced. Some with a best performance of 76%.
choose an incremental approach, where only a
proportion of staff is invited in. Others will have a
38%
policy to ensure everyone is logged in, even if they
are not real candidates for early participation. Even Average %
after someone has logged in, if they are not active
i.e. potentially just reading content, the data can be
Interactive
somewhat unreliable. Users:
Maintaining the user accounts, taking into account
the comings and goings of staff, is also often Range 6% - 76%
problematic. In previous years we have avoided
this situation by only analyzing interactive users We have conducted some analysis of individual
that we could measure reliably. However, many of organizations using the Yammer ‘Seen By’ counts,
our clients at the early stage of Yammer usage are which suggests that for those that have not become
keen to know what percentage of all staff log into interactive on Yammer, about half of those have at
Yammer. least read or seen something on Yammer.
Therefore, we have tried to make a best effort to We can therefore estimate the adoption
determine the average number of staff registered characteristics for Yammer on average, and
for Yammer use. For the most part, we have chosen demonstrated best practice:
Average Yammer Adoption
31% 31%
haven’t logged
have only ‘read’ on to Yammer
on Yammer
23%
modestly interact
on Yammer 15%
actively interact
on Yammer
Figure 5 - Average Yammer Adoption
17On the surface this looks like a pretty modest result. Best practice
performance was just over 75% interactive users, so there is a
significant gap between average performance and what at least one Networks do not,
organization has been able to achieve. High adoption figures are more
easily achieved for the smaller organizations, but one organization with
and need not,
over 3,000 staff was still able to achieve a 64% interactive user rate. achieve 100%
What should we expect from a Yammer platform in terms of active participation to be
participation across the whole enterprise?
successful.
Naïve expectations will be 100% active participation for Yammer. In
this light the above results would paint Yammer as a failure; yet this is
far from the case. Yammer is an Enterprise Social Network. Networks
do not, and need not, achieve 100% participation to be successful. A
common structure for a network is what we call a “Core-Periphery15”
model. As the term suggests, the structure is one of a core of very
active and interconnected people, surrounded by a periphery of less
connected people. This is precisely what we are seeing here. Even
staff who have never logged on to Yammer are not immune to the
influence of a core Yammer member, outside of Yammer. It is therefore
the size and composition of the ‘core’ that will dictate how successful,
or otherwise, the Yammer network will be.
The size of the core could also be referred to as the ‘critical mass’
required to sustain and grow the network. It’s hard to be precise about
how big this needs to be, but at least one study16 related to politics
and gender suggests around 30%. A recent article in the Scientific
American suggested it takes 25% of people to start a revolution17.
Of course, a good proportion of the core needs to be ‘organizational
influencers’ and not just ‘Yammer Influencers’. Having executive
leadership in the Yammer core is therefore critical to attracting other
organizational influencers into the core.
Based on the average adoption figures reported here, there is still
some work to do to achieve the critical mass required. But the results
below, when compared with prior years, suggests it is within reach.
We estimate that just under 30% of our benchmarking partners are
currently operating at this level.
Once we have identified those staff who have become interactive
on Yammer, we can drill down further to understand the breadth of
interactive activity.
Having executive leadership
in the Yammer core is therefore critical
to attracting other organizational
influencers into the core. 15
https://en.wikipedia.org/wiki/
Core%E2%80%93periphery_structure
16
https://www.cambridge.org/core/journals/
politics-and-gender/article/story-of-the-
theory-of-critical-mass/592171C05B9B828D
BBDCC121B05780D4
17
https://www.scientificamerican.com/article/
the-25-revolution-how-big-does-a-minority-
have-to-be-to-reshape-society/
183.4.1.1 Observers
59%
Once a staff member has become interactive on
the platform, they are included in our benchmarks.
The next level of participation we have set is to be Average %
active on the platform more than once every two
weeks, on average. ‘Observers’ are those that have Observers:
not achieved this level of participation over the most
recent six-month period.
Range 25% - 88%
The average score is 59%, which is again an
improvement on 2017 figures (68)%, and 2016 What is an appropriate target for participation?
(75%). Across the sample, Observer scores as
low as 25% have been achieved. Looking in more We suggest a target of 40%+ active participation
detail at the frequency distribution, we can see the is not an unreasonable goal for Yammer usage.
majority of organizations are in the 50-70% range, a That means that the proportion of Observers should
definite improvement on 2017 results. not exceed 60%.
%Observer Distribution
Figure 7 - Observer Distribution
193.4.2 USER ENGAGEMENT
Once we have people on the platform it is time for them to contribute.
We use three measures for this; proportion of Broadcasters, proportion
of Recognition and Activity per User. These are described in more
detail below.
3.4.2.1 Broadcasters
Now that we have managed to influence staff into becoming active on
the platform, we need to try and keep them there. The most common Average % Broadcaster:
8%
method is to provide content they can only access on the platform.
Given that ESN platforms are a derivation from consumer social
networking sites, there is significant experience available on how
to engage people through social media. User engagement around
content requires people to react to the content, either by commenting,
sharing or simply acknowledging with a ‘like’. Ineffective content is
therefore content that gains little or no traction. We have characterized
people who are responsible for this style of content as “Broadcasters”. Range 0% - 56%
In other contexts, broadcasting may not be a negative behavior. But
in an ESN it is. We believe that this measure should have targets to
minimize broadcaster behavior. The average of 8% this year is a big
improvement on the 2017 benchmarking report’s 18%, but the larger
range points to a large room for improvement for many organizations.
We suggest trying to keep the %Broadcaster to below 5%
3.4.2.2 Recognition
A core characteristic of any social system is social recognition.
The ubiquitous ‘like’, or related signal the @ ‘mention’, form part of the Average % Recognition:
61%
social recognition system. The measurement of social recognition is
important for assessing how users are engaging with the social model
of collaboration. The Recognition is simply the percentage of
all interactions that are ‘likes’ or ‘mentions’.
There should, however, be an upper limit to this. If the proportion of
social recognition becomes too high, we run the danger of turning
Yammer into a mutual admiration system, at the expense of developing
Range 12% - 81%
tangible outcomes. We should also note however that a “mention” is
a form of tagging which we know attracts more replies. The higher
29
average than the 2017 report’s 56% is perhaps too high though, with
Average Activity/User:
the range being even larger this year.
We suggest a target range for Recognition to between 40% – 60%
A common measure of success for social media systems is the raw
activity that the platform is attracting. Social systems are characterized Range 3.1 – 125.1
by a ‘long tail’ effect, whereby lead users are responsible for a
significant proportion of the activity.
A quick measure to identify the extent that this is occurring is to
We suggest a practical initial
measure the ‘Activity/Active User’ ratio. The average activity/user works
target for this measure is
out to be just over one activity/week/user. Best practice (125.1 activities
more than one activity per
/ active user) performance works out to just under five activities/week/
week for every active user
user, or once every working day. Again, the performance comfortably
and then toward or exceeding
exceeds the 2017 report’s score of 21. This is a measure that we would
the best practice of one
like to maximize without limit.
activity each working day.
203.4.3 CONNECTING
Connecting signals the transformation from a media focus to a
relationship focus. For many adopters of Yammer this is a critical
transition. While content is used to attract people to Yammer, the real
value in the platform comes from people connecting with other people.
Once connections are made, the pathways have been established for
true knowledge sharing, problem solving and innovation.
3.4.3.1 Proportion of Engagers, Catalysts, Responders
and Broadcasters
The Persona scores assess the percentage categorizations for the non-
observers i.e. those that are active more than once every two weeks.
SWOOP identifies Personas based on interaction behaviors18.
%Persona (Average/Range)
Figure 8 - Behavioral Persona Distributions
We can see the Responder has the highest average score.
A Responder is someone who reacts to others with replies and
likes. We often refer to them as the ‘caregivers’ who help sustain
communities. They have displaced the Catalysts as the most prolific
from the 2017 benchmarking report. The Engager is our aspirational
persona. Engagers are able to balance posting and responding.
This behavior therefore lends itself to relationship building and the
movement from engagement around content, to building connections.
In terms of targets for the positive Personas, we suggest the
proportion of Engagers should be above 30%, and Catalysts
and Responders should be comfortably between 30–40%.
In summary, we identify Observers and Broadcasters as the least
attractive personas, in the context of moving an organization beyond
content consumption, to collaboration. The positive behavioral
personas of Engagers, Catalysts and Responders are required to
push organizations into relationship building; a key prerequisite for
effective collaboration.
18
http://www.swoopanalytics.com/personas/
213.4.3.2 Influencer Risk
Influencers can attract eyeballs to content and therefore advertisers
and revenue for the content owners. Engaging users around content
34
Influencer Risk:
is the ‘end game’ for social media. For Enterprise Social Networking
it is more like the beginning of the journey. Once an organization
starts to prioritize connections and relationships over content, it is
the relationship network that becomes the focus. The influencers are
the people central to these networks. They are the ‘go to’ people and
the people that are positioned to broker new connections. However,
networks can become over-dependent on a single hub. When this is
the case, a network can disintegrate, should the hub leave the network. Range 1.9 - 78.7
The extent to which a network is at risk to this happening is captured
by our Influencer Risk. This index calculates the degree to which the
network is dependent on a selected few. The higher the score, the
higher the risk.
The average score is 34 with a ‘best practice’ i.e. lowest risk score of
1.9. A high Influencer Risk Index means that the network is at risk if a
few key people were to leave. Just like hierarchical roles, it is always
good to build some redundancy into the network, encouraging multiple
hubs to form, and to lower the key player risk.
We encourage a target to be initially set at maximum of 20%.
3.4.4 SHARING
The sharing stage leverages the connections we have built.
Connections provide the pathways for knowledge sharing.
Knowledge comes in two forms; explicit and tacit. Explicit
knowledge is just another name for information or content.
Most organizations have many ways of sharing information.
While we might argue about which ways work the best, for the
most part, explicit knowledge sharing is relatively easy, compared
with tacit knowledge sharing. By definition, tacit knowledge is not
codified. It is shared through frequent and rich conversations.
The most effective means for sharing tacit knowledge is face to face.
However, the ESN is available to fill the gaps between important face
to face knowledge sharing sessions. The richer and more frequent the
online conversations are, the more effective face to face interactions
will be, once the opportunity arises.
For this stage we’re applying the measures of ‘Public Messages’,
‘Post/Reply’ ratio, ‘Thread/User’ and these are outlined below.
3.4.4.1 Public Messages
A number of benchmarks can be used as indicators of sharing. The
Public Messages measure identifies the percentage of messages that % Public Messages
68%
are open and transparently available across the network, i.e. posted
in public groups. While there are always good reasons for maintaining
privacy for certain messages, we believe that a ‘sharing organization’
should be continually challenging private spaces. For example, it is a
common practice for teams to be formed as private groups in ESNs.
Often setting these group areas to private is because team members
just don’t think anyone else would be interested in the detail of their day Range 7% - 100%
22to day work. Largely, this may be true but by setting these groups up
as private, it completely removes the opportunity to share.
At 68%, the percentage of public groups is actually a little lower than
the 2017 report’s 74%, with one organization having only 7% public
messages. Many of the highly collaborative organizations are still
sustaining over 80% public groups. We would anticipate that as private
teams move to Microsoft Teams, the proportion of Public messages
should improve again.
We suggest an appropriate target for Public Messages is greater
than 80%.
3.4.4.2 Reply/Post Ratio
We often refer to the Reply/Post ratio as ‘pump priming’. When
networks are starting up, it is common for the leaders to post a lot Average Reply/Post:
1.72
of content to attract people to the network (Reply/Post < 1). At this
stage we expect the number of posts to exceed the number of replies
during start-up. But as the network matures and becomes more
conversation-centric, we would expect the ratio to reverse, with Replies
outnumbering Posts. If this isn’t happening, then there is a good
chance effective knowledge sharing is not occurring.
At 1.72 we see that on average, organizations are still only marginally
Range 0.27 - 4.23
replying more than posting. This suggests that ESN discussions still
have a way to go. That said, this year’s performance is an improvement
on 2017’s 1.34, with the best practice score of 4.23 replies for every
post being comfortably better than 2017’s 3.03.
We suggest a practical target for a Reply/Post ratio should be
above 2.5 replies for every post
3.4.4.3 Threads/User
This measure is designed to capture the breadth of engagement of
staff in discussions. The more discussion threads that staff are involved Average Threads/User:
2.71
in, the more likely that active knowledge sharing is occurring.
The results suggest engagement in active discussions is still low, with
an average of less than three threads per active user, over the full
six-month period. The score however is an improvement on our 2017
report’s 2.05 with the ‘best practice’ score a healthier 14.8, significantly
better than 2017’s 7.82. This is another measure where there should be
no upper limit.
Range 0.25 - 14.8
We would suggest a practical initial target based on best practice
leaders would be more than six threads/user over a six-month
period, or one thread/user every four weeks and then moving
toward best practice of one thread every two weeks.
3.4.5 PROBLEM SOLVING
A problem shared is a problem solved. This well-known saying
correctly identifies that problems are rarely solved in isolation. But it is
also true that a lot of knowledge is shared without an express purpose.
For example, gossip is a form of knowledge sharing, but it rarely moves
the organization forward, and sometimes quite the contrary.
23The transition from knowledge sharing to problem solving is another
key transition, just like the one between engaging around content and
connecting. Once a problem solving purpose is acknowledged, we
have a path to true value creation. Tim Baker and Aubrey Warren in
their book “Conversations at Work: Promoting a Culture of Conversation
in the Changing Workplace19” identify conversations without questions
being simply statements passing back and forth with no result.
“Questions add the vital ingredients of reflection, investigation, and
integration”; all of which are required to solve difficult problems.
For this stage we’re applying the ‘Response Rate’ and ‘Reciprocity’
measures.
3.4.5.1 Response Rate
The Response Rate looks to directly capture responses to posts. For
this benchmark we only include written replies; some of which may Average Response Rate:
46%
be further questions. ‘Likes and Mentions’ have been excluded from
this benchmark (though are available in the SWOOP dashboard),
because a ‘like’ can be a conversation killer i.e. how do you extend a
conversation after a ‘like’?
The average of 46% is an improvement on 2017’s 40%, with a best
practice of 70% (64% in 2017).
Range 13% - 70%
We can see most performances fit in the range of 30 – 70%. Those
handful of organizations with written reply response rates over 60%
are generating richer conversations. Those operating below 30% are
‘Reply’ Response Rate Frequency
Figure 9 - ‘Reply’ Response Rate Distribution
likely to be still ‘broadcasting’ style organizations; which should only
be justified in the early phases of ESN maturity, where you may still be
looking to use content to attract staff to the platform.
We would recommend a target of at least 50% be adopted for this
important measure. 19
https://www.amazon.com.au/
Conversations-Work-Promoting-Culture-
Conversation-Changing-Workplace/dp/
B017J5HBDC
243.4.5.2 Reciprocity
A two-way connection is formed when you initiate an interaction with
someone e.g. you ‘like’ their post and they, in return have perhaps Average % Reciprocation
replied to one of your posts. Two-way connections are a signal
(Two-Way Relationships):
24.2%
for a relationship being formed. And of course, the more two-way
interactions you have with someone, the more likely you are to have
formed a stronger relationship with them.
The Reciprocity measure is simply the percentage of all relationships
that are two-way connections. The average score and best practice
are a substantial improvement over those recorded in 2017
(14.6% versus 24.2%). Range 9.58% - 42.2%
We suggest organizations should be trying to maximize both
measures, looking to achieve Reciprocity above 35% for
organizations with less than 1,000 people; 30% for organizations
of between 1,000 – 5,000 people and 25% for organizations
with more than 5,000 people.
It should be noted that the 2017 report’s average two-way connections
score was less influenced by the relative size of the organization.
However, we have dropped this measure in favor of the easier-
to-interpret Reciprocity (Two-way Relationships on the SWOOP
dashboard). It is, however, more sensitive to organization size (larger
organizations will find it harder to achieve high Reciprocity scores
when compared with smaller organizations).
If you have a group with a high number of two-way connections, it is
more than likely the group is densely connected, and therefore more
cohesive in its operations. It is common to judge an ESN group by how
active it is. But if the activity is simply statements or opinions ‘passing
in the night’, performance is simply an illusion.
The Reciprocity score is the most reliable measure of relationships
forming and problems being solved.
3.4.6 INNOVATING
While regular problem solving is akin to incremental innovation, we
reserve the final stage of maturity for when organizations exhibit a
culture of continuous innovation, adaptability and responsiveness.
Clayton Christensen introduced us to the concept of disruptive
innovation in his book the “The Innovator’s Dilemma22” some 20 years
ago. Disruptive innovation occurs when a diversity of views is brought
to bear on a problem or opportunity.
For this stage we’re applying the ‘Diversity’ and ‘Curiosity’ measures.
3.4.6.1 Diversity Index
In essence, a key prerequisite for successful innovation is diversity
of thought, which comes from a diversity of connections, leading to a
diversity of experiences. Diversity can be measured across a multitude
of dimensions. While the popular media aligns diversity with gender,
business enterprises are more regularly concerned about diversity
of connections across the formal lines of business, or exposure to a
25You can also read