15-MINUTE NEIGHBORHOODS - REPAIRING REGIONAL HARMS AND BUILDING VIBRANT NEIGHBORHOODS FOR ALL - Boston Indicators
←
→
Page content transcription
If your browser does not render page correctly, please read the page content below
15-MINUTE
NEIGHBORHOODS
REPAIRING REGIONAL HARMS AND BUILDING
   VIBRANT NEIGHBORHOODS FOR ALL

             September 2021
AUTHORS
Anne Calef
Luc Schuster
Tom Hopper
Peter Ciurczak

EDITOR
Sandy Kendall

DESIGN
Isidor Studio
Mel Isidor
Sarah Rege

ABOUT BOSTON INDICATORS

Boston Indicators is the research center at the Boston Foundation, which works to advance
a thriving Greater Boston for all residents across all neighborhoods. We do this by analyzing
key indicators of well-being and by researching promising ideas for making our city more
prosperous, equitable and just. To ensure that our work informs active efforts to improve our
city, we work in deep partnership with community groups, civic leaders and Boston’s civic data
community to produce special reports and host public convenings

ABOUT MASSACHUSETTS HOUSING PARTNERSHIP
CENTER FOR HOUSING DATA
MHP’s Center for Housing Data was created in 2017 to collect, analyze and share information
to drive better conversations about housing in Massachusetts. The Center’s staff identifies data
gaps, acts as a data clearinghouse, and makes data easily accessible to non-housing professionals.
It is part of the Massachusetts Housing Partnership, a quasi-public agency founded in 1990 that
helps shape state housing policy, provides community technical assistance and has used private
bank funds to finance more than 47,000 apartments and homes.

ABOUT THE BOSTON FOUNDATION
The Boston Foundation is one of the largest and oldest community foundations in America,
with net assets of $1.3 billion. The Foundation is a partner in philanthropy, with some 1,100
charitable funds established for the general benefit of the community or for special purposes. It
also serves as a major civic leader, think tank and advocacy organization dedicated to bringing
people together and advancing opportunity for everyone in Greater Boston.
15-MINUTE
NEIGHBORHOODS
REPAIRING REGIONAL HARMS AND BUILDING
   VIBRANT NEIGHBORHOODS FOR ALL

 ACKNOWLEDGMENTS
 This report would not be possible without vital contributions from a range of local leaders,
 advocates, and researchers, including: Tracy Corley, Northeastern University & Conservation
 Law Foundation; Christopher Kuschel, Metropolitan Area Planning Council; Jonathan Berk,
 Patronicity; Andre LeRoux, MassINC; Dana LeWinter, CHAPA; Ben Forman, MassINC;
 Jarred Johnson, TransitMatters; Kyndal Feinman, Housing Forward MA; Josh Zakim, Housing
 Forward MA; Stacy Thompson, Livable Streets; Anabelle Rondon, MassDevelopment; Peter
 Dunn, City of Worcester; Karin Valentine Goins, WalkBike Worcester; Christine Madore,
 Massachusetts Housing Partnership; Callie Clark, Massachusetts Housing Partnership; Alma
 Balonon-Rosen, Massachusetts Housing Partnership, Helen Murphy, The Boston Foundation;
 and Soni Gupta, The Boston Foundation.

 We also appreciate the time and invaluable insights shared by leaders and advocates from
 our paper’s four case study communities: Worcester, Somerville, Reading and Boston’s
 Jackson Square.

 This report was also made possible with generous support from the Barr Foundation.

                                   September 2021
INTRODUCTION

Each of us deserves to live in a vibrant,
healthy neighborhood, where we can get
to everyday destinations without too much
hassle. These are neighborhoods where you
can pick up a library book on your walk to
the local market, where children feel safe
playing outside, and where welcoming public
spaces encourage all sorts of gathering and
community events. For years, planners and
policymakers have advanced visions along
these lines using a range of different names—
smart growth districts, great neighborhoods,
transit-oriented development, mobility-
oriented development, superblocks,
WalkUPs, complete neighborhoods, safe
streets, and many more.
Source: Eryn Johnson for the Community Arts Center in Cambridge

In this paper, we use the “15-minute city” model as a           Second, we emphasize high-quality public transit and bike
jumping off point. This can feel like yet another urban         options as supplements to improved walkability. Third,
planning buzzword, but we find it powerful for articulating     we believe that 15-minute neighborhoods should reflect
a vision of what Greater Boston could become. Designed          our region’s racial and socioeconomic diversity, and any
by Carlos Moreno and popularized by Paris Mayor Anne            comprehensive regional planning initiative should be a
Hidalgo, the 15-minute city model aims to build vibrant,        means to reverse the entrenched patterns of racial and
mixed-use neighborhoods where all residents can reach           economic segregation. To accomplish this, the planning,
their daily needs within a 15-minute walk of their home.        creation, and stewardship of 15-minute neighborhoods
Our vision for Greater Boston is distinct because we add        must truly center the voices and needs of those who
a few extra points of emphasis. First, we worry that a          have historically been left on the margins, including Black,
hyper-local focus can lead to a few, disconnected, amenity-     Indigenous and other residents of color, low-wealth
rich islands of privilege, so we’ve designed our vision to      residents, new immigrants, and those with disabilities.
be regional in nature, moving toward an interconnected
network of 15-minute neighborhoods across Greater
Boston.

                                                                                                                                5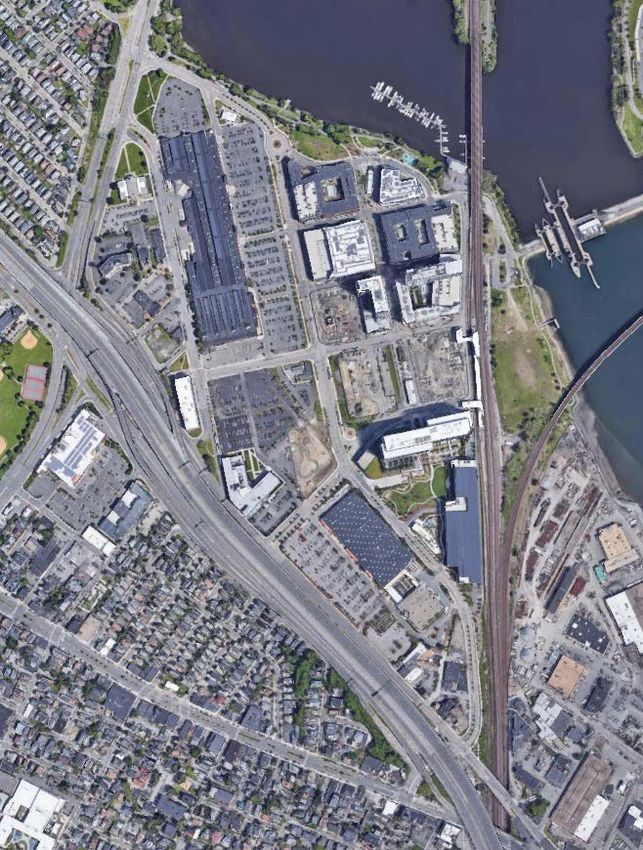
INTRODUCTION

       Source: Jonathan Berk

       Greater Boston has real potential to turn the vision          The state legislature actually took an important step
       of 15-minute neighborhoods into reality. Our region is        in supporting 15-minute-style development in this
       already dotted with downtowns that are fairly walkable        past January’s Economic Development Bond Bill,
       and have some measure of small business development.          which included a provision requiring that every MBTA
       With the pandemic and increases in remote work,               community develop at least one multifamily zoning
       demand for living in many suburban downtowns has              district. The Department of Housing and Community
       increased. Greater Boston is also home to “regional urban     Development is currently drafting implementation
       centers” like Worcester and Lawrence that feed local          guidelines, and there’s uncertainty about how much new
       ecosystems largely independent of Boston. Connected by        housing it will yield, but this represents an important step
       the MBTA’s rapid transit, bus, and commuter rail networks,    toward revitalizing these transit-rich neighborhoods and
       this constellation of cities and towns outside of Boston is   requiring them to build housing that’s more accessible to
       poised to support vibrant, mixed-use neighborhoods that       low- and moderate-income families.
       are less car-dependent and more locally focused.

6   Boston Indicators 15-minute Neighborhoods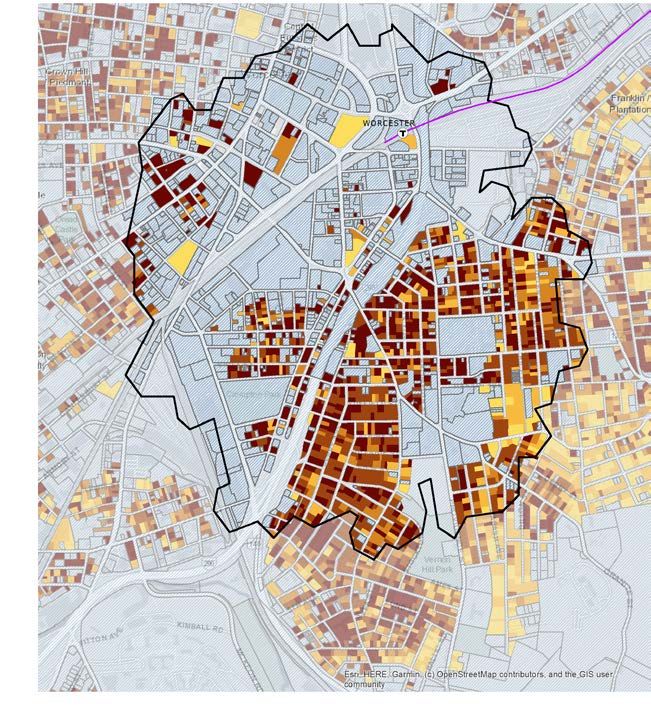
Source: Jonathan Berk

To date, though, too many policy decisions have moved         It’s also worth acknowledging concerns that certain
us in the opposite direction. Transportation and land use     neighborhood improvements can serve to accelerate
policy has prioritized cars for generations, encouraging      rising housing costs and spur displacement. These potential
sprawl, separating residential from commercial uses,          side effects are another reason why we focus region-wide.
and relinquishing large amounts of public space to            In the policy section below, we discuss policies both for
single-occupancy vehicles. Furthermore, while jobs,           opening access to Boston’s exclusionary suburbs and for
transportation, and housing markets increasingly operate      revitalizing neglected downtowns that have struggled with
at an interconnected regional scale, the state has ceded      cycles of disinvestment. Equity-focused investments are
too many land-use and zoning decisions to the purview         more limited when we don’t have growing economies,
of small local governments. This has allowed many of          and localized displacement pressures are highest when
these communities to adopt single-family-exclusive            we don’t build housing in all communities. Neighborhood
zoning, contributing to persistent residential segregation    improvements also create a virtuous cycle of new job
by race and income. Exclusionary zoning has also led to       creation, increased economic activity and, ultimately,
our region’s severe housing shortage, high housing costs,     increased local tax revenue that should be spent on
and residential density levels that often are too low to      equity-focused investments like acquiring naturally
support the development of vibrant downtowns and              occurring affordable housing or increasing the availability
strong regional job opportunities. Local decisions are        of small business capital to entrepreneurs of color.
made without the input of those hoping to move into a
community, such as service workers who cannot afford to
live where their jobs are, making defense of the status quo
the norm.

                                                                                                                            7
TABLE OF                                PART 1

             CONTENTS                           OUR VISION OF EQUITABLE
                                                15-MINUTE NEIGHBORHOODS
             AND KEY FINDINGS                   (P. 10)
                                                Key components:
             Through this paper we              { Redesigned streets that make space for walking,
                                                  biking, gathering, and high-quality public transit
             hope to popularize a vision
                                                { Accessible commercial spaces
             of a regional network
                                                { Diverse and abundant housing options
             of equitable 15-minute
                                                { Strong social infrastructure
             neighborhoods, and we
                                                { Diverse and empowered resident communities
             provide a framework for
             action to advance this vision.     Examples of where Greater Boston falls short:
             To do this, the paper is           Transportation and land use policy has favored
             structured in three parts:         cars over other transportation modes and single-
                                                family-exclusive zoning has contributed to persistent
                                                residential segregation and a regional housing
                                                shortage.

8   Boston Indicators 15-minute Neighborhoods
PART 2                                                   PART 3

CASE STUDIES OF FOUR                                     STATE AND LOCAL POLICY LEVERS
NEIGHBORHOODS MOVING                                     FOR BUILDING A REGIONAL
IN THIS DIRECTION                                        NETWORK OF EQUITABLE 15-MINUTE
(P. 24)                                                  NEIGHBORHOODS
                                                         (P. 50)
Case study locations:
{ Assembly Row in Somerville                             Massachusetts jobs, transportation and housing
                                                         markets operate at an interconnected regional
{ Canal District in Worcester
                                                         scale, but too many land-use decisions are left up
{ Jackson Square in Boston                               to municipalities. To advance racial and economic
                                                         justice--especially in a state with persistent residential
{ Downtown Reading
                                                         segregation, shortage-driven housing cost inflation,
                                                         and wealth and opportunity varying greatly by place--
Key findings:                                            we should make more such decisions at a higher level
Many neighborhoods in Greater Boston are moving          of governance, where elected leaders represent a
toward 15-minute-style visions, but progress is          broader cross-section of society and redistribution of
uneven. Many suburban towns are moving in a              resources is more feasible.
very modest direction as they haven’t allowed for
                                                         Examples of leveling up: use state legislation to
sufficient multifamily housing density to support
                                                         legalize multifamily housing and eliminate minimum
truly vibrant commercial and local employment
                                                         parking requirements, especially around transit
opportunities. Some redesign efforts have been
                                                         stops. Leveling up strategies could also be advanced
shaped by dogged local organizing, and others are
                                                         through stronger regional action.
grappling with how to prioritize vulnerable residents
in the face of reinvestment and possible displacement.   Other decisions need to move down a level. Many
The existence of highways and large through roads        details of the 15-minute neighborhood vision are best
presents significant design challenges in several        determined by inclusive, participatory engagement
places, where longstanding residential neighborhoods     processes that reflect the local context. Unfortunately,
are effectively cut off from new all-inclusive           many places use engagement processes that aren’t
neighborhood developments.                               accessible or welcoming, particularly to residents who
                                                         have rigid work schedules, modest English skills or
                                                         difficulty getting to meeting venues.

                                                         Examples of leveling down: involve residents from
                                                         the beginning of a project to determine priorities (say,
                                                         whether a new “safe street” program should focus on
                                                         fixing potholes or closing streets to cars) and, more
                                                         broadly, prioritize the needs of the most vulnerable
                                                         residents when doing community engagement.

                                                                                                                      9
PART 1

OUR VISION
OF EQUITABLE
15-MINUTE
NEIGHBORHOODS
3    Diverse housing options

                        2     Acessible commercial spaces

                                                                                           4 Diverse and
                                                                                               Diverse   empowered
                                                                                                       and empowered
                                                                                                  resident
                                                                                                resident   populations
                                                                                                         populations

                                                                                            5    Diverse and
                                                                                                  Strong social
                                                                                                 infrastructure
                                                                                                 empowered

                       Diverse and
       Redesigned streetscapes   thatempowered
                                      include  1
      space for walking, biking and
                         resident   gathering
                                  populations

From Paris’s 15-minute city to Portland, Oregon’s 20-minute
neighborhoods to Barcelona’s superblocks, many cities around the world
are adopting policies that pursue a similar goal—changing how they use
space to build lively and walkable neighborhoods.

Our vision of 15-minute neighborhoods for Greater Boston is inspired by this work, and we build upon
it by adding elements (like the need for regional connections) and putting additional emphasis on equity
(like the need for these neighborhoods to be truly inclusive of the racial, ethnic, and income diversity of
our region).

The five components in this section should be considered a vision and not a definitive prescription for all.
Ultimately, the most suitable path forward will vary from place to place, but based on conversations with
local leaders and policy experts, the components laid out in this section represent core elements that
every community should consider in their pursuit of an equitable 15-minute neighborhood.

                                                                                                                         11
PART 1
Redesigned Streetscapes That Include Space
1
for Walking, Biking and Gathering
Prioritizing walking, biking, and public transit usually MassINC found in June 2021 that an overwhelming
requires reclaiming space from cars. “Road diets,” where majority of Boston-area voters supported setting aside
the number of lanes is reduced, not only make roads safer more space for outdoor seating and dining, as well as
for pedestrians, bicyclists, and other drivers1 but can also creating separated bike lanes and adding more parking for
encourage people to do all sorts of things that aren’t as bikes, even if it meant taking away space for cars.2
utilitarian as getting to work or shopping for groceries—
things like sitting on a bench to have a conversation, Ensuring that all residents can meet their needs in a
playing outside, organizing neighbors on a street corner, or 15-minute walk also requires developing better pedestrian
sharing a meal in a small park or at an outdoor café. infrastructure. Doing so means widening sidewalks,
installing curb cuts at crosswalks for wheelchairs and
Many cities took steps in this direction during the strollers, installing benches, and prioritizing other “universal
pandemic, most often reclaiming parking spaces for design” elements that allow all residents, regardless of
outdoor dining, but also sometimes redesigning roadways ability, to use sidewalks. It also means creating an active
through “complete streets” programs. For example, and engaged street front where residents aren’t just
Moody Street in Waltham closed a four-block stretch to comfortable walking but actively enjoy it. This includes
vehicle traffic to create space for social distancing and planting trees for shade, adding public art to walls, plowing
outdoor dining in May 2020. The program was so popular sidewalks during winter, and providing sufficient lighting at
that it was repeated in 2021. night.
12 Boston Indicators 15-minute NeighborhoodsIt also demands robust bike infrastructure to extend Finally, redesigned streets can free up space for public
the areas that residents can reach without a car. The transit improvements like designated bus lanes or street
number of destinations that can be reached in 15 cars. Public transit is critical to supporting longer distance
minutes increases greatly when traveling by bike. Bike lane transportation, reducing greenhouse gas emissions, and
networks can connect residents not only to commercial ensuring that individuals with limited mobility are able to
centers but also to other municipalities and job centers. access the resources they need without a personal car.
However, it is not enough to just paint bike lanes on
streets. Protected bike lanes are not only safer for cyclists
but also more popular.3 A study in Boston found that the
installation of protected bike lanes led to an 80 percent
increase in bike share use. Bike share programs, especially
when coupled with subsidized use passes and stations in
lower-income neighborhoods, are critical to increasing bike
access to both new riders, casual bike riders, and those
who may not be able to afford their own bike.4
Where We Are Falling Short
Many downtowns in Greater Boston are still very region that do not even have sidewalks on both sides
car-centric, with the majority of street space devoted of the street.5 Even places with walkable strips are
to cars and too little space devoted to public or often interrupted by parking lots or dangerous street
commercial space and cycling, pedestrian, and public crossings. Parking takes up a sizable portion of street
transit infrastructure. The Metropolitan Area Planning space and not all cities in the region have established
Council’s (MAPC) Local Access Score shows what many bike share programs or other programs designed to
of us already know: that there are many roads in our improve bicycle accessibility.
LEFT Street in Worcester without pedestrian infrastructure. Source: Anne Calef
RIGHT Potential bike and car conflict on a street in Boston. Source: Callie Gibson on Unsplash.
13PART 1
2 Accessible Commercial Spaces
Having a strong mix of commercial spaces provides the Ideally, many of these businesses are locally owned, feeding
goods and services that residents need, generates new job a circular and inclusive economy within the neighborhood
and entrepreneurship opportunities close to home, and while also supporting wealth generation for residents.
enlivens neighborhoods. While some residents will always
travel elsewhere in the region for work, especially to the In recent years some Greater Boston cities have
urban core where jobs are more concentrated, advocates developed more intentional strategies for growing local
have worked for years to strengthen local economies businesses that both meet the needs of current residents
outside of downtown Boston to make these areas more and help generate opportunity. For instance, “innovation
self-sustaining. The equitable 15-minute neighborhood coalitions” in Lawrence, specifically Lawrence Community
model is one approach for supporting these shifts. Works, Groundwork Lawrence, and the Lawrence
Partnership, have cultivated a growing entrepreneurial
While the exact mix of commercial spaces should vary ecosystem and helped many entrepreneurs of color build
based on the specific cultural and social needs of a given wealth and skills.6 Cities such as Salem and Lynn have used
community, it is important that neighborhoods contain public art and placemaking as economic development
places where residents can access healthy food (e.g., strategies that both attract shoppers and showcase local
grocery stores, culturally relevant small markets, farmer’s artists. These programs have helped revitalize neglected
markets), home goods and supplies (e.g., hardware stores), downtowns while also ensuring that low-wealth and
basic services (e.g., post offices and banks), medical care lower-skilled households are able to participate in that
and pharmacies, as well as dining establishments and growing prosperity.
entertainment (e.g., movie theaters).
14 Boston Indicators 15-minute NeighborhoodsWhere We Are Falling Short
Far too many Greater Boston cities and towns
separate commercial spaces from residential areas
through their zoning regulations. Rather than mixing
commercial and residential areas throughout the
town, commercial areas are instead concentrated
in small pockets, generally along car-centric roads.
By design, this separates where residents live from
businesses and related job opportunities. In Weston,
for instance, local zoning rules require that businesses
be concentrated in only a few areas near the
Commuter Rail and along Route 20. And none of
this land is allowed to have a mix of both commercial
and residential uses. The majority of the remaining
land in town is zoned exclusively for housing. MAPC Zoning Atlas
In 2019, the Massachusetts Housing Partnership Weston map of residential and
commercial zoning
(MHP) found that 25 percent of cities and towns One quarter of MBTA communities do not allow mixed-use development by right around stat
(Source: MAPC)
with an MBTA station either do not allow for
any mixed-use development within a half mile of By right Only by special permit Not allowed
the MBTA station or require a special permit for
mixed-use approval. Requiring a special permit
raises development costs and makes it difficult for
buildings with new homes and businesses to be
constructed, especially at an affordable level or by
smaller, independent landowners. Eleven percent 14%
of municipalities with an MBTA station—including
Milton and Wellesley—don’t allow mixed-use
development at all.7 11%
It’s important to note that in some contexts having
mixed-use zoning is a necessary but not sufficient
condition for supporting new business development. 75%
In some places key infrastructure is missing, such as
sewer or other utilities, making development less
likely to occur. The resources needed to start a
business are also not equally distributed. Specifically,
we know that many entrepreneurs of color lack
access to basic levels of capital needed to finance
One quarter of MBTA communities do
the creation of a small business, so even in places not allow mixed-use development by right
where they may have enough potential customers One quarter of MBTA communities do not allow mixed-use development by right around station areas.
around station areas.
and the zoning to allow it, they might not be able
to get a business up and running. We discuss ideas By right Only by special permit Not allowed
for addressing these challenges further in the policy
section of this paper. Source: Massachusetts Housing Partnership
Center for Housing Data, 2019.
15
14%PART 1
3 Diverse Housing Options
Another pillar of our vision for equitable 15-minute We use the word diverse here because vibrant downtown
neighborhoods is having abundant housing options neighborhoods rely on a varied housing stock to meet
available at a range of price points, including duplexes, the different lifestyle needs of potential residents.
triple deckers, and small apartment buildings that Neighborhoods should have the full “life cycle of housing”
ultimately support the creation of a socioeconomically and represented—from shared homes for young adults to
racially diverse resident population. Building more housing modestly priced single-family homes for young families to
overall will help address the statewide housing shortage smaller condos for empty nesters—and have units that
and stabilize housing prices, creating additional paths can accommodate residents with limited mobility, such
to homeownership for lower-wealth residents. Building as elders and residents with disabilities. Below is a list of
denser housing will also make an area more vibrant by some of the different sorts of housing diversity that these
supporting the creation of more local businesses in a given neighborhoods should aim for:
neighborhood. Without enough potential patrons living
nearby, it becomes nearly impossible to succeed as a local
business.
16 Boston Indicators 15-minute NeighborhoodsTOP Jackson Square Mixed Use (Source: Trevor Mattos) TOP Source: City of Salem and Chris Kuschel (MAPC)
BOTTOM Source: MarkinBoston on Wikimedia Commons BOTTOM Source: Magicpiano on Wikimedia Commons
{ A mix of rental and owner-occupied units. Denser { A mix of unit sizes. Having homes of varied scale
urban neighborhoods will tend to have more rental allows families with kids, empty nesters, young adults,
housing than suburban ones, as more people will live and people of all abilities to live next to each other.
in larger apartment buildings, so there’s no perfect
{ A mix of market-rate and income-restricted units.
rental/ownership mix, but it’s a useful target to have
Income-restricted affordable housing can be created
some of both.
through a variety of channels, including vouchers to
{ A mix of building types. Different kinds of access market-rate housing. A range of programs
buildings—ranging from multifamily blocks to support development of income-restricted housing
triple deckers to single-family homes or accessory units, including income-restricted set-aside units
dwelling units (ADUs), including buildings that have created through inclusionary zoning programs,
other uses, like retail—will make the neighborhood public housing developments, and privately built or
more dynamic by avoiding a sterile cookie-cutter administered affordable housing projects that tend to
look and can increase density in places that were be subsidized through state and federal low-income
formerly single-family-only without inserting a big housing tax credits.
apartment building. Townhomes or triplexes, like the
ones pictured above, can add a surprising amount of
density and human energy to a neighborhood while
staying in line with existing design standards.
17PART 1
Where We Are Falling Short
Housing is one area where we’ve fallen especially far short The map below shows just how pervasive bans on
of our vision. Governance of Greater Boston is chopped multifamily housing are. Created with the Metropolitan
up into dozens of small cities and towns, many of which Area Planning Council’s (MAPC) Zoning Atlas tool, it
have outright banned the construction of anything other shows parcels where multifamily housing is blocked by
than single-family homes on large lots and permitting local zoning.8 These places are effectively inaccessible to
processes are deferential to existing homeowners. those who can’t afford to purchase or rent a single-family
Others have implemented onerous procedural barriers home. Other than housing produced through the state’s
and zoning provisions that make housing production 40B requirement, the development of new income-
more costly and difficult than it should be. This has all restricted housing is essentially prohibited in these places
contributed to a region that is plagued by a severe since those projects are almost always done as multifamily
housing shortage, high housing costs, and persistent units. Related to the affordability discussion lower in this
residential segregation. As a region we need to do list, suburban neighborhoods with little rental housing also
everything we can to moderate market costs for all types end up excluding subsidized rental voucher holders since
of housing so that low- and moderate-income families those can only be used in rental properties.
aren’t forced to squeeze into small homes or get pushed
out of our region entirely.
MAPC Zoning Atlas
18 Boston Indicators 15-minute NeighborhoodsThese policies add up to a segregated
region that is sprawling and lacks density
in many transit-rich areas. Looking across
the MBTA network, MHP found that
113 station areas did not even meet the
extremely low residential density level of
five residents per acre within a half-mile
radius of the station.9 Many cities and
towns have limited density not just through
single-family-exclusive zoning but also
through mechanisms like minimum lot sizes
and low Floor-Area-Ratios. Many towns go
as far as requiring at least one-acre lots for
each single-family home. The chart at right
shows residents and employment per acre
within a half mile area of all stations on the
Commuter Rail’s Newburyport-Rockport
Line in 2019, capturing how little residential
density there is around many MBTA
stations.10
Massachusetts Housing Partnership (2019)
19PART 1
4 Diverse and Empowered Resident Population
Everything discussed above is about the places, amenities, An equitable approach to 15-minute neighborhoods also
and infrastructure that are needed to make our requires a careful attention to displacement pressures that
neighborhoods vibrant, dynamic, and safe for all residents. may arise and pro-active steps to ensure that low- and
These are important, but only because they’re in service moderate-income residents are able to stay in their homes.
of improving the lives of the people who live in these
places. An equitable 15-minute neighborhood must also However, it is not enough to simply have diversity in
be reflective of Greater Boston’s tremendous diversity numbers. Well integrated neighborhoods must also
and must be accessible to all, regardless of socioeconomic equitably distribute power and resources among residents.
status or background. It is a place of meeting—where As we discuss in more detail in the final section of this
rich cultural traditions, power, and resources are equitably paper, this means not only redistributing resources to
shared and community forms across lines of difference. those that have historically been denied them but also
Scholars have questioned the 15-minute neighborhood actively including all residents in local planning decisions
model’s ability to tackle racial and socioeconomic so that decisions around how to redesign the local
segregation, and for this reason we emphasize policy streetscape, for instance, best serve people who currently
actions at the state and regional levels, maximizing the live there and hope to live there in the future. It also
potential for progressive redistribution of tax dollars and means having local institutions that respect and reflect
for tackling our housing shortage at scale.11 the diversity of a given neighborhood, are welcoming to
new residents, and ensure that all residents feel safe and
included.
20 Boston Indicators 15-minute NeighborhoodsThe 2019 Greater Boston Housing Report Card found
Where We Are Falling Short that the more multifamily housing units built, the more
racially diverse a place became. Cities and towns that
allowed more multifamily housing units gained more
Black, Asian, and Latinx residents, demonstrating that
As we’ve noted, Greater Boston’s residential segregation policies limiting multifamily development not only worsen
is as intense as it is persistent. In 2017, Boston magazine our housing shortage and inflate housing costs but also
reported that two thirds of Greater Boston’s Black perpetuate racial segregation in the region.13
population lived in Dorchester, Roxbury, and Mattapan.12
Meanwhile, of the 147 communities in the Greater In addition to residential segregation, planning processes
Boston area, two thirds were at least 90 percent White. have historically disregarded, disempowered and harmed
Winchester and Hingham were only 0.5 and 0.6 percent vulnerable residents including low-income residents,
Black, respectively. According to the 2020 Census, 71 immigrants, renters, and communities of color. This has
percent of Greater Boston’s Latinx population lives in led to the destruction of communities such as the West
Boston and the Gateway Cities. In Lawrence, 82 percent End, parts of Chinatown and parts of Roxbury.14 Had
of the population is Latinx compared to just 0.3 percent organizing not stopped it, I-95 and an Inner Belt would
in neighboring North Andover. While in aggregate Greater have plowed through much of Roxbury and Jamaica Plan
Boston may be more diverse than you’d expect, in many as well as parts of Cambridge and Somerville. Planning
parts of the city and in many surrounding towns, you for more equitable and inclusive neighborhoods requires
would not necessarily know it. considering this history and actively pursuing more
equitable strategies for planning with communities instead
of for them and ensuring that policy makers are truly
reflective of the community.
21PART 1
5 Strong Social Infrastructure
Social infrastructure includes the places where bonds Social infrastructure can also include public art and
develop and community forms. While this can also occur performance spaces where residents engage with each
in commercial spaces, the emphasis here is less on where other and cultural practices. As previously mentioned,
people are shopping, working, or conducting business, and cities such as Lynn and Salem have used public art as
more on where people are relaxing, congregating, playing, a part of placemaking initiatives and local economic
and contributing to each other’s care. Many of these will development strategies. These also serve as social
be publicly owned places, such as public schools, public infrastructure as they bring people together and facilitate
parks, town halls, or libraries where we participate in stronger community bonds.
civic life. Others will be privately owned, such as private
daycare centers, healthcare providers, museums, or places Finally, open and public space is a critical component
of worship. Community based organizations can play a of social infrastructure by creating space for human
large role in the creation and maintenance of these spaces interactions that are not dependent on commercial
and provide key services that individuals need to develop exchange. Public parks and green space can be the site of
bonds and participate in community and civic life. public events, summer programs, or small family gatherings.
They can connect residents to the natural environment,
help seniors or other residents battle social isolation, and
be a place of refuge in urban heat islands. Parks can also
enable the shared use of urban space by providing publicly
accessible basic services, such as drinking water and public
toilets.
22 Boston Indicators 15-minute NeighborhoodsWhere We Are Falling Short
Absentee property owners, dilapidated properties,
brownfields, and high vacancy rates in municipalities
where housing is less expensive present barriers to
developing social infrastructure. At the same time,
displacement caused by rising property values and an
influx of new residents to previously low-wealth areas
can destabilize a neighborhood’s social fabric and
infrastructure.
Around the region, many public spaces that could
support social infrastructure have been devoted to
private uses. Parking, for example, has removed a lot
of space that could have otherwise been used for
parks, parklets, or other places for gathering. Car-
centric neighborhoods with high car volume streets
hinder our ability to get to know our neighbors and
build a stronger sense of community. Researchers
have found that as traffic volume increases neighbors
are less likely to interact with each other, know each
other, or feel responsible for shared space.16
Many public spaces have also become heavily policed,
particularly in low-income neighborhoods, and the
rise of privately-owned public spaces, such as the
Fan Pier Harborwalk in Boston’s Seaport, has led to
greater control of space that can limit access and the
spontaneous uses that can strengthen a community.
To encourage use of public space, people need to be
able to hang out, linger, meet one another, and build
relationships without fear or impediments. Over-
policing or overly regulating the use of public space
limits conversations, community events, and social
cohesion.
TOP Privately-Owned Public Space in Boston’s Seaport
(Source: NewtonCourt on Wikimedia Commons)
MIDDLE Brownfield in Chelsea (Source: Massachusetts
Dept. of Environmental Protections on Wikimedia
Commons)
BOTTOM Dilapidated Lot (Source: Collin Burman on
Unsplash)
23AS
SEM
BLY
SQU
AR
E
I CT
S TR
DI
AL
N
CA
PART 2
CASE STUDIES OF
FOUR NEIGHBORHOODS
MOVING IN THIS
DIRECTIONRE
AD
IN
GD
OW
NT
OW
N
JACKSON SQUARE
Cities and towns throughout Massachusetts have made varying degrees
of progress toward our vision of equitable 15-minute neighborhoods.
To highlight the wide range of opportunities and challenges that
municipalities face, we’ve put together four neighborhood examples that
reflect some, but certainly not all, of the diverse community types we have
in our region—newly built neighborhoods, lower-income Gateway Cities,
suburban town centers, and inner core communities.
Since our goal is to ensure that all residents in the region have access to the resources they need to
thrive, these case studies look at the unique history of each place, considering questions like: Is this a
lower wealth community that has struggled with cycles of disinvestment or a higher wealth community
where many residents have benefited from racially discriminatory housing and wealth-building policies? If
the latter, what steps are they taking to share prosperity and ensure that those with fewer resources are
able to access their community fully? These case studies are not designed to be exhaustive; instead, our
goal is to highlight how neighborhoods evolve over time, the various challenges they face, and the many
steps communities have already taken to become more walkable, inclusive, and vibrant places.
25PART 2
ASSEMBLY SQUARE (Somerville, MA)
Unique among this report’s case Though this new development has added much-needed
housing and helped generate some new economic activity,
studies, the Assembly neighborhood
it cannot yet be characterized as a fully walkable, vibrant,
of Somerville has been built out mostly connected 15-minute neighborhood. While parts of the
from scratch over the past 10 years. Over neighborhood are walkable and dynamic—such as the
previous decades the area featured a playground and open space along the Mystic River—large
swaths of it are almost absolutely car-focused—like the
railroad yard, a mall, and a variety of Assembly Marketplace section, which features strip mall
underutilized industrial properties. mainstays such as Bed, Bath & Beyond and TJ Maxx. As a
major employment and retail destination, most visitors do
Today, Assembly Square is shaped by two main centers. not live in the neighborhood and get to Assembly Square
The first is the mixed-use Assembly Row district, which by car.
features housing, offices, and many new outlet shops. The
second is Assembly Marketplace, a strip mall built into a The neighborhood is also physically walled off from the
former Ford assembly plant whose footprint (in stores and rest of Somerville in a challenging way. Even though parts
parking) takes up a large share of Assembly Square’s total of Assembly are short walks from longstanding residential
area. Yet, Assembly’s transformation into the neighborhood neighborhoods dotted with triple-deckers and low-rise
it is today was no sure thing. Only through extensive apartment buildings—like East Somerville and Ten Hills—
community consultation, alongside advocacy and litigation they’re separated by I-93 and the Fellsway, which makes
led by Mystic View Task Force was Somerville encouraged walking and biking to Assembly a potentially hazardous
to reclaim and rebuild Assembly Square, transforming it trip across either the city’s most dangerous intersection or
into an entirely new neighborhood. This neighborhood the Fellsway, a six-lane boulevard.17 These physical hurdles
opened up access to the city’s waterfront, added hundreds make it particularly difficult for visitors, a third of whom
of new housing units, and created space for significant may be people of color, to access Assembly without a
additional commercial and retail growth. car.18
Though Assembly remains a work in progress, it gets
a lot of things right. Just under half of new market-rate
housing units, and around 40 percent of the city’s new
affordable units,19 come from developments at Assembly.
The active contributions of local residents in collaboration
with City of Somerville planners and Assembly‘s owners
shaped the new Assembly Square neighborhood plan,
which will attempt to address many of the challenges the
neighborhood faces.
26 Boston Indicators 15-minute NeighborhoodsAS
Ten Hills SEM
BLY
SQ Everett
UA
RE
Fellsway
Assembly
Assembly Row
Marketplace
Grand Union Blvd.
Orange Line and
Assembly Station
Interstate-93
East Somerville
Source: Google Earth
27PART 2
Good local mobility infrastructure, a When it comes to pedestrian infrastructure, Assembly
Row and Assembly Marketplace yield different
variety of commercial space, and new
experiences. Within five minutes of Assembly Station,
housing construction give Assembly pedestrians can reach the leafy green trees of Assembly
the potential to become an equitable, Row, shop at outlet stores, and linger in restaurants or
15-minute neighborhood. the square outside JP Licks. Traffic moves much slower
within the Row, and street furniture in a few places allows
residents and visitors to rest as they make their way from
In the last 20 years there has been a focus on bringing
shop to shop. Shade is plentiful, provided by both the
more transit options to Assembly. Opened in 2014,
trees and the offices, residences, and hotels built across
Assembly Station gave residents direct access to Boston
the Row’s footprint.
via the Orange Line, and likewise, Bostonians direct
access to Assembly. The train station is not the only
Notably though, the retail, restaurants, and entertainment
connection to Boston either. Assembly has almost two
available are largely chains, giving the Row a corporate feel.
dozen transit connections, with service to over 800,000
Assembly Marketplace is a bit further by foot, functioning
jobs.20 For getting around within the neighborhood,
like a large suburban strip mall with a TJ Maxx, Bed Bath
Bluebikes has a hub located right next to the station,
& Beyond, and a Trader Joe’s. Though there are sidewalks,
though bike-oriented infrastructure (such as separated
they are designed primarily to get shoppers from the
lanes), is limited and often poorly marked.
parking lot to the Marketplace.
Due to Somerville’s Inclusionary Housing Program (IHP),21
residential developments at Assembly do have some
income diversity. While market-rate condos are higher-
end, Assembly’s housing developments have created 168
affordable housing units (at a mix of 50 and 80 percent
of area median income). These units were created under
Somerville’s 1990 IHP, which required developments of
Assembly’s size to include 12.5 percent affordable housing.
In 2016, the IHP increased to 20 percent, ensuring that
all future developments within Assembly will continue to
support the creation of new affordable housing.
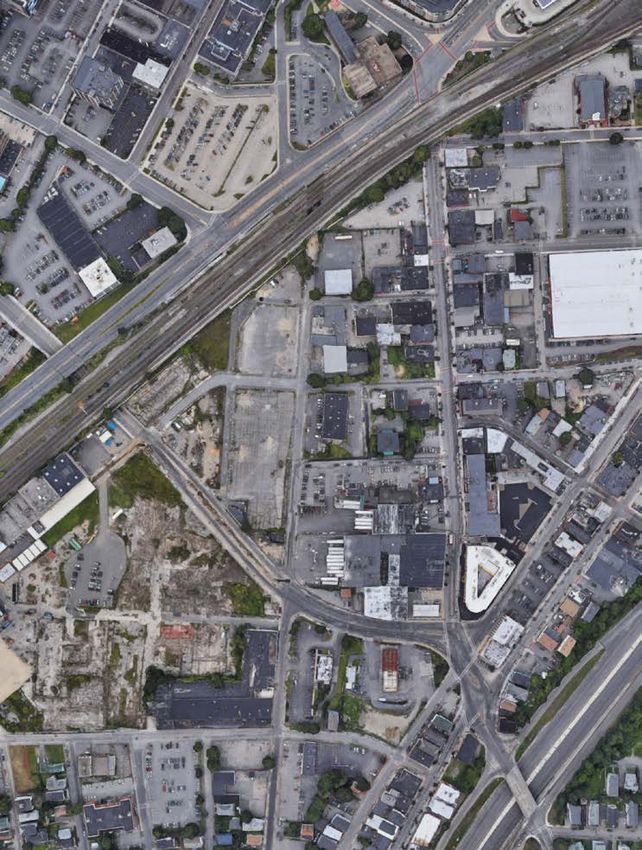
Source: Peter Ciurczak
28 Boston Indicators 15-minute NeighborhoodsLooking south from Grand Union Blvd. and Greater River Rd. illustrates this parking problem. On the
left are two multi-story car parks, and on the right is a 5.6 acre parking lot. (Source: Peter Ciurczak)
“Missing middle” housing and car culture Apart from housing, another major challenge for Assembly
is reducing the sheer amount of space currently given
remain big challenges for Assembly.
over to car infrastructure. The promise of easily finding
a parking space, combined with the relative isolation
When it comes to housing broadly, the district has made
of Assembly behind I-93 and the Fellsway, encourages
critical contributions to addressing Somerville’s housing
visitors to travel to the district by car. This means that
shortage. Just under half of the city’s new units since
Assembly faces many of the problems that come with
2011 have been built at Assembly Row.22 Nevertheless,
high automobile utilization, most notably accidents, vehicle
Assembly has so far only built housing at the top and
congestion, and the parking necessary to serve all the
bottom ends of the market—the top, which has facilitated
visitors (as in the image below).24 Reducing and controlling
Assembly’s continued construction, and the bottom, as
car traffic in and around Assembly will be essential in
required by Somerville ordinance. Absent from these
reclaiming the space for people and allowing the growth
developments are residences targeted at middle-income
of a more equitable neighborhood.
earners—the “missing middle.” These are workers and
families that cannot afford the luxury apartments at the
highest end of the market, nor qualify for Somerville’s
subsidized housing. These are the folks that are running
into difficulty finding housing anywhere within Somerville
or the surrounding cities, forcing them to look further
afield.23
29PART 2
Assembly Square (Source: Pi.1415926535 on Wikimedia Commons)
Assembly’s transformation into an While there is little that can be done to address the
existence of I-93 or the Fellsway, the new neighborhood
equitable 15-minute district hinges on
plan will creatively embrace building height to block
redeveloping away from cars—and it is in the sight and sound of these roadways. By placing
the process of doing so. taller office and lab buildings along the border of the
interstate, and smaller mixed-use buildings in the center
At the beginning of this case study, we noted that of the district, Somerville is hoping to create a more
Assembly is in the midst of a new neighborhood plan, cohesive neighborhood center—one that should have
designing—with resident input—the next phase of the housing available for all income levels. Tied to all this new
district’s growth. Critically, the proposed plan appears to construction are planned expansions of bike infrastructure,
be addressing many of the difficulties facing the district, more and better pedestrian infrastructure that reflects the
first and foremost the complete removal of Assembly best of what Assembly Row already has to offer, and even
Marketplace and its associated parking. Proposed in its greater transit connections. Despite some ups and downs,
place is an entirely new, mixed-use district with plenty of Assembly’s development has consistently followed a path
room for gathering on a central green, with spaces for toward accessibility, and by extension, equitability.
festivals, playgrounds, and other civic uses.
30 Boston Indicators 15-minute NeighborhoodsCANAL DISTRICT (Worcester, MA)
New England’s second largest city is on the move. Public The construction of Interstate 290 in the 1970s
and private investment over the past 20 years has led to demolished much of the housing that had supported
the revitalization of the area now known as the Canal the mixed-use Water Street area and separated it
District, most notably with the recent opening of the from the more residential Vernon Hill and Union
Worcester Red Sox’s Polar Park. With major mixed-use Hill neighborhoods. Coupled with the decline in
developments planned in the next five years, proximity manufacturing, increasing suburbanization, and the closure
to a MBTA Commuter Rail station, and dense residential of Worcester’s Union Station, the area suffered from
neighborhoods nearby, the Canal District presents disinvestment in the late 20th century. Over time, the
a real opportunity to build an equitable 15-minute area’s population shifted as well. Residents in the Canal
neighborhood in the heart of Worcester. District, largely concentrated in the area south of Kelley
Square, are now predominantly Latinx and White, with
However, a few challenges exist. The overwhelming small Asian and Black populations as well.26
presence of car infrastructure separates nearby
neighborhoods from recent projects and challenges In the early 2000s, local residents and stakeholders came
walkability. Much of the commercial area lacks residential together to form the “Canal District Alliance” and build
density, and while new projects promise upwards of interest in the newly rebranded area through personal
700 units, it’s unclear how affordable those units will be. outreach and public events. While an attempt to open
Finally, as development spreads to the other side of Kelley up the covered Blackstone Canal never progressed
Square, it also has the potential to create displacement past a City-commissioned feasibility study, the “Canal
pressures and raises the question of how access to the District” north of Kelley Square took off.27 It became
resources and prosperity from the Canal District will be an entertainment destination with 20–30 new bars,
shared with all residents. restaurants, and clubs opening in the early 2000s. Popular
retail destinations emerged with the renovated mill
Worcester’s Canal District has seen a building in 2013, an envelope factory that was converted
into loft-style apartments, and the busy Worcester Public
lot of recent commercial development
Market that opened in 2020. Finally, Worcester managed
that moves it closer to a 15-minute to lure the top Red Sox minor league affiliate to the city
neighborhood. in 2020. Worcester officials partnered with the team and
developers not only to build minor league baseball’s most
The area now known as Worcester’s Canal District was expensive stadium on an abandoned, formerly-industrial
only briefly home to a canal. Constructed in 1828, the lot, but also redevelop multiple, adjacent brownfields into
Blackstone Canal carried textiles, wire, and machinery housing, commercial, and office spaces.
from Worcester’s factories to the port in Rhode Island
for 20 years until it was rendered obsolete by railroads,
ceased commercial operations, and was eventually
covered over in the 1890s. Originally referred to as
Water Street, the area was then home to a bustling,
predominantly Jewish, immigrant community from the
1880s until the mid-20th century when many families
began to move “up and out” of the neighborhood.25
31PART 2
Union Station
C T
T RI
S
DI
Polar Park Water Street
A L
N
CA
Kelly Square
Union Hill
Green Island
Vernon Hill
Source: Google Earth
32 Boston Indicators 15-minute NeighborhoodsLeaving Kelley Square heading toward Vernon Hill (Source: Anne Calef)
Development in this area north of Kelley Square has Sidewalks and public transit access have
brought many of the commercial aspects of an equitable
improved but car infrastructure still
15-minute neighborhood. Many of the new restaurants
and bars are locally owned and culturally responsive. limits accessibility by walking or biking.
The recently opened Worcester Public Market, right
in the heart of Kelley Square, houses 36 local food Busy roads, the railroad, and Interstate 290 separate
and retail vendors, serving everything from burgers much of the Canal District from neighboring areas,
to Jamaican cuisine to bubble tea. While there is not a but the district has seen recent improvements in
large, comprehensive grocery store in the area, there public transportation as well as pedestrian and cycling
are a number of smaller, more culturally specific markets, infrastructure. While Worcester Regional Transit Authority
including the Vietnamese Binh An market, the Eastern (WRTA) service through the Canal District is relatively
European Golemo’s market, and the Arab Al-Anwar sparse, the WRTA has taken bold steps during the
market. A plumbing store provides hardware, barber pandemic to increase access to public transportation—
shops are sprinkled throughout the Canal District, and the suspending all fares through January 1, 2022, as a result
Worcester Ice Center serves as both a recreation facility of reports by the Worcester Regional Research Bureau
for all ages and the home practice rink for many local and advocacy by the Zero-Fare WRTA Coalition.28 Just
collegiate and professional hockey teams. a 10-minute walk from Kelley Square, Union Station
connects Worcester to Boston and other municipalities
to the east through the MBTA Commuter Rail. The recent
redesign of Kelley Square has increased pedestrian, cyclist,
and driver safety in what was formerly one of New
England’s most dangerous intersections.29 The widened
sidewalks for cyclists and pedestrians do not extend
throughout the Canal District but several side streets
connecting to Kelley Square were also improved with
designated bike lanes and improved sidewalks. Worcester
has signaled an ongoing commitment to shared streets
through its recent Complete Streets Policy.30
33PART 2
A major challenge facing the Canal District is the lack of There are four under- and overpasses that cross I-290
significant residential density in the areas north of Kelley and link the Canal District to the Union and Vernon Hills
Square and feeble connections to nearby residential areas. neighborhoods to its east. However, limited lighting, high
Significant residential density exists in the southern part of traffic speeds, inactive store fronts, and a large amount
the Canal District, Green Island, as well as the neighboring of space devoted to surface parking leave the areas
Union Hill and Vernon Hill neighborhoods but separated unwelcoming to pedestrians or cyclists. Infrequent bus
from the commercial area by I-290 and busy streets. service and the lack of a municipal bike share program
make connections even more difficult without a car.
Source: Massachusetts Housing Partnership analysis of MassGIS
Property Tax Parcels and MassGIS Master Address Data
34 Boston Indicators 15-minute NeighborhoodsTOP Leaving Kelley Square heading toward Vernon Hill (Source: Anne Calef)
BOTTOM Approaching Vernon Hill from Green Island (Source: Anne Calef)
35PART 2
Public Plaza
LVD Winter Street
B
T H
RA
CG
J .M
I S
NC The Cove
F RA 318-unit apartment
building, bowling
Pond Street
et
Washington Stre
Green Street
et
Polar Park
re
St
ing
rd
Ha
M
ad
Table Talk Lofts
Crompton Place
iso
nS
SOMA Ground floor retail
tre
Life sciences lab + 82 units (Phase 1:
et
building, two hotels, affordable, workforce,
market-rate)
VD
parking garage
BL ~318 units (Phase II:
N D market-rate)
LA Worcester
IS Public Market
E N
G RE SOMA
228-unit market-rate
apartment building,
ground floor retail
Kelley Square
0
Lamartine Street
29
I-
36 Boston Indicators 15-minute NeighborhoodsMedian Household Income
$81,215
$48,139
$40,303 $39,969
$32,681
Massachusetts Worcester Vernon Hill Canal District/Green Union Hill
Island
Source: American Community Survey 2015-2019 5-year Estimate, PolicyMap
Compared to the rest of Worcester and Massachusetts, As these new developments bring luxury apartments and
these neighborhoods are overwhelmingly occupied by new life science jobs, it opens opportunities for further
renters and have lower median incomes. Investment in commercial development and raises questions about
the area has been very uneven, with broken sidewalks and rising property values, rents and displacement in the
litter right next to street improvements that have sought surrounding areas, particularly Green Island.32 The City
to fix sidewalks and beautify parts of Union Hill.31 of Worcester has committed $3 million over the next
five years to improve the housing stock in Green Island
New development will close the in exchange for affordability guarantees and $1 million
to improve Crompton Park.33 It has also promised to
perceived division between Green Island
invest $37 million in street and sidewalk infrastructure. As
and the Canal District areas north of development spreads from north of Kelley Square into
Kelley Square, but will present new Green Island, it has the potential to knit the Canal District
challenges to existing neighborhoods. into a walkable, racially diverse, mixed-income whole—or
exacerbate inequity in the city, depending on the path it
takes.
While Interstate 290 is a permanent barrier between the
Union Hill, Vernon Hill, and Canal District areas, perceived
divisions between the area north of Kelley Square and
Green Island will likely disappear as new development
unfolds around Polar Park. New developments such as the
Canal Lofts, the Edge, and Kelley Square Lofts have added
some residential units to the area; however; planned
developments of industrial or vacant lots will potentially
yield another 1,000 units. In addition to the “Table Talk
Lofts” (82 units planned in the first phase, estimated to
have 400 total units) and “The Cove” (318 units planned)
north of Kelley Square, 353 market-rate units, two hotels,
and a life science building are currently planned for areas
south of Madison Street, closer to Green Island. As of
yet, the Table Talk development is the only one to include
affordable units.
37You can also read


