COVID-19 has a postcode: How urban housing and spatial inequality are shaping the COVID-19 crisis - Jeni Klugman and Matthew Moore
←
→
Page content transcription
If your browser does not render page correctly, please read the page content below
COVID-19 has a postcode: How urban housing and
        spatial inequality are shaping the COVID-19 crisis

Research Paper

COVID-19 has a postcode: How urban housing and
spatial inequality are shaping the COVID-19 crisis
Jeni Klugman and Matthew Moore

                                                             December 12, 2020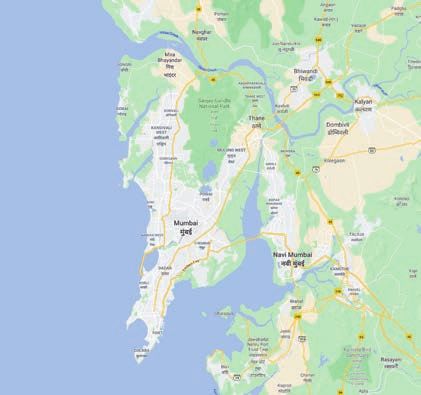
COVID-19 has a postcode: How urban housing and
                      spatial inequality are shaping the COVID-19 crisis

Prepared for the Grand Challenge on Inequality and Exclusion, an initiative of the
Pathfinders for Peaceful, Just and Inclusive Societies.

We are grateful to the Open Society Foundations for supporting this research, and
to the governments of Sweden and Canada for supporting the Grand Challenge on
Inequality and Exclusion. The authors thank Euihyun Bae and Paula Sevilla for their
input and research support.

Cover photo: Jakarta during the COVID-19 pandemic, June 2020 (CC BY-NC-ND 2.0 ILO/F. Latief).   Page 2
COVID-19 has a postcode: How urban housing and
spatial inequality are shaping the COVID-19 crisis
Table of contents
1. Introduction. ................................................................................................................................................. 4
2. How spatial disparities have shaped the brunt of the pandemic . .......................................................... 5
Renters......................................................................................................................................................... 11
Informal settlements..................................................................................................................................... 12
Homelessness............................................................................................................................................... 14
3. Emerging policy and program responses ............................................................................................... 14
Social protection........................................................................................................................................... 16
Legislative actions: rents, evictions, and mortgages...................................................................................... 17
Place-based efforts: informal settlements...................................................................................................... 18
Homelessness............................................................................................................................................... 20
4. Recommended policy directions . ............................................................................................................. 21
5. Political dynamics and long-term reforms .............................................................................................. 22
6. Conclusions and looking ahead ............................................................................................................... 24
Endnotes.......................................................................................................................................................... 26
Figures and boxes
Figure 1: Exposure Hotspots in Three Cities....................................................................................................... 6
Figure 2: Hotspots Overlaid with Service Locations .......................................................................................... 6
Figure 3: COVID-19 Rate of Cases by Zip Code (San Francisco).......................................................................... 7
Figure 4: Intra-Urban Life Expectancy Disparities . .......................................................................................... 11
Figure 5: Share of renter households with at least one member employed in a vulnerable occupation......... 12
Figure 6: Cape Town – Klipfontein Glebe Informal Settlement......................................................................... 13
Box 1: Decentralization and housing................................................................................................................ 10
Box 2: Urban COVID-19 responses – overview of international guidance........................................................ 15
Box 3: Examples of World Bank urban project reallocations to address COVID-19 needs............................... 19
Page 3COVID-19 has a postcode: How urban housing and
spatial inequality are shaping the COVID-19 crisis
1. Introduction
A midst COVID-19, poverty is soaring. Forecasts suggest increases in global poverty for the first time since
1990, which could reverse approximately a decade in the world’s progress in reducing poverty, with
countries in the Middle East and North Africa (MENA), South Asia, and Sub-Saharan Africa especially hard-hit.
In some regions the adverse impacts could result in poverty levels similar to those recorded 30 years ago.1
While many of the world’s poor live in rural areas, about 55 percent of the world’s population presently
lives in cities, and 26 of the world’s 33 megacities are in developing countries, of which 19 are in the Asia-
Pacific region. Urban areas are often the most prosperous parts of a country, but high levels of inequality
are also found within cities—indeed “in most cities, high levels of wealth and modern infrastructure
coexist with areas characterized by deprivation and a dearth of services. Underinvestment in infrastructure
and public transportation prevents some urban residents from accessing good jobs, education, and
services. Furthermore, the concentration of poverty in certain underserved neighborhoods reinforces the
mechanisms that perpetuate disadvantage.”2
Spatial disparities3 have been thrown into stark relief by COVID-19. The pandemic has exposed deep
disparities in power and resources in cities, and revealed how existing forms of inequality can deepen the
spread of global health and other crises. The crisis has also underlined the importance of adequate housing
as a fundamental need for populations in diverse global settings.
Cities pose the most serious challenges, where glaring inequality in housing and other amenities already
existed. The sharpest and most vivid repercussions of COVID-19 have been felt in cities around the world.
The lockdowns, shelter-at-home orders, and social distancing needed to halt the spread of the disease have
hit the urban poor hardest, as pre-existing disparities in residential segregation, access to services, and
homelessness have exacerbated COVID-19’s impacts.
COVID-19 has underlined that spatial inequality is relevant—and costly—everywhere: not only in developing
countries. The pandemic has exposed sharp inequalities in prosperous cities, such as New York and San
Francisco, as well as in slums and informal settlements in developing countries such as Kenya and Iran. For an
estimated 1.4 billion people living in informal settlements, home is crowded, inadequate, and unsafe. In the
words of one observer, “[w]ith COVID-19, we are all in the same storm. We are not all in the same boat.”4
This paper presents the results of a rapid appraisal carried out in May 2020. It surveys how existing urban
inequalities have played out in practice, how spatial inequality has shaped the repercussions of COVID-19,
and how housing-related program and community responses have helped close—or exacerbated—these
gaps. It also outlines the opportunities and prospects for longer term reforms. While data and empirical
analysis are still nascent, academic, government, and civil society groups, as well as news outlets, have
quickly ramped up efforts to document and study the pandemic and its numerous effects. We assess
emerging evidence about how the COVID-19 pandemic’s impacts reflect residential segregation, including
how they differentially affect renters, people who live in informal settlements, and the homeless.
The COVID-19 crisis calls for rapid and innovative responses to address strains on lives and livelihoods.
Our review identifies many promising emergency responses—from temporary eviction moratoria to cash
transfer programs—aimed at mitigating COVID-19’s immediate impact. Among the emergency measures are:
short term social protection benefits, temporary rent or mortgage moratoria, initiatives to extend access
to water and hygiene, and public health outreach in disadvantaged communities. Emergency measures, in
many cases, build on pre-existing programs, such as vouchers and cash transfer systems.
Page 4COVID-19 has a postcode: How urban housing and
spatial inequality are shaping the COVID-19 crisis
It is important to monitor the coverage and distributional impacts of these programs in a timely way.
This can inform both mid-course adjustments and the design of new programs, and the avoidance of
unintended adverse effects of well-intentioned programs. Composite indices are being used to provide
summary numbers, to help predict risks as well as inform responses.5 These types of tools—such as a new
methodology developed by the World Bank to measure COVID-19 exposure hotspots6 and the Oxford
Stringency Index7—can provide insights about the patterns of needs and responses. The Mind the Gap Index
currently under development assesses multiple aspects of urban spatial inequality relevant to the COVID-19
pandemic, most notably disparities in opportunity, access to services, and voice.
As Arundhati Roy has powerfully observed, amidst the pandemic’s terrible despair, there is the opportunity
to rethink what we want the future to look like, not just reverting to the status quo.8 The Pathfinders
framework that encompasses both recognition and redistribution helps to underline the connections
between self-worth, voice, and dignity, and the material consequences of the pandemic— aspects of
inequality that are “distinct and yet related.”9
The rest of this paper surveys how existing urban inequalities are playing out in practice and shaping the
repercussions of COVID-19, and how housing-related program and community responses have offset—or
worsened—these gaps. The focus is on direct impacts on health and mortality outcomes, alongside incomes,
livelihoods and access to services. We present evidence from around the world on the COVID-19 pandemic’s
disparate effects on renters, informal settlements, and the homeless, as well as how these impacts are
shaped by residential segregation. The concluding sections of this paper outline policy directions that would
address the call to “build back better,” to create more inclusive, just, and resilient cities and communities in
the wake of the pandemic.
Before the onset of the COVID-19 pandemic, governments and international actors increasingly
acknowledged disparities in housing as a pivotal social and human rights challenge.10 We hope this note
helps to illuminate how housing and spatial inequality influences the current health crisis, as well as lessons
for the recovery and beyond.
2. How spatial disparities have shaped the brunt
of the pandemic
T o what extent have spatial disparities in access to housing meant that the poorest and most marginalized
in cities bear the brunt of the pandemic? Here we draw on evidence about pre-existing differences and
emerging evidence about the crisis’ impacts. We begin with a discussion of residential segregation and
spatial disparities in the pandemic including the intersection with racial disparities, and then focus on
specific disadvantaged groups—namely renters, residents in informal settlements, and the homeless.
Residential segregation can be defined as the separation of groups of people by characteristics, such as
race and income, into different places within urban space.11 This separation of groups into neighborhoods
of relative and absolute prosperity or disadvantage is often associated with spatial disparities in access to
adequate housing, as well as in income, health, crime, education, and healthcare.
Residential segregation is shaping the impact and experience of the COVID-19 pandemic for people around
the world. This can be seen in direct health impacts as well as in the larger economic repercussions. In this
section, we examine what is known about COVID-19’s disparate risks in terms of residential segregation,
linked to underlying health and economic conditions, as well as the consequences of the pandemic. We
then offer brief analysis of research from before the pandemic that illuminates how housing and health
inequalities influence major public health crises.
Page 5COVID-19 has a postcode: How urban housing and
spatial inequality are shaping the COVID-19 crisis
Spatial analysis is being used pre-emptively to identify locations that are particularly vulnerable to COVID-19
contagion and its effects. A new methodology12 developed by a World Bank team focuses on two dimensions:
first, population density and the inability of people to physically distance; and, second, conditions where
clustering may be unavoidable due the location of necessities like public toilets and water pumps.
This has allowed the identification of “exposure” hotspots—places where population density makes social
distancing infeasible—overlaid with key services (Figure 1):
• In Mumbai, exposure hotspots cover 105 km2 and an estimated 4.5 million people—meaning that about
20 percent of the population would be unable to adequately social distance.
• In Kinshasa, exposure hotspots affected 138 km2 and 5.9 million people—about 53 percent of the total
population.
• In Cairo, hotspots covered 84 km2 and 5.5 million people (25 percent of the total population).
Figure 1: Exposure Hotspots in Three Cities
Mumbai Kinshasa Cairo
Marche Central
Population Density
per sq.m. TFA Population Density
Population Density
per sq.m. TFA poptfa_all per sq.m. TFA
≤ 0.29 ≤ 0.29 ≤ 0.29
≤1.70 ≤1.30 ≤2.30
Source: Cities, crowding, and the coronavirus: Predicting contagion risk hotspots. World Bank (Bhardwaj et al.) (2020)
In each city, the area at risk expanded significantly when location data for key services such as water kiosks and
public toilets was added (Figure 2).
Figure 2: Hotspots Overlaid with Service Locations
Mumbai Kinshasa Cairo
Population Density Population Density per
Population Density Population Density per per sq.m. TFA sq.m. TFA (adjusting Population Density Population Density per
per sq.m. TFA sq.m. TFA (adjusting ≤ 0.29 for water points) per sq.m. TFA sq.m. TFA (adjusting
for toilet services) ≤1.30 poptfa_all for toilets)
≤ 0.29 ≤ 0.29
≤1.70 ≤ 0.29 ≤ 0.29 ≤2.20 ≤ 0.29
≤1.70 ≤1.70 ≤2.20
Source: Cities, crowding, and the coronavirus: Predicting contagion risk hotspots. World Bank (Bhardwaj et al.) (2020)
Page 6COVID-19 has a postcode: How urban housing and
spatial inequality are shaping the COVID-19 crisis
Emerging analysis has also examined the spatial distribution of COVID-19 health outcomes, including death
rates, excess death rates, and positive tests.
The spatial distribution of health outcomes in Californian cities shows how residential segregation and racial
disparities overlap during the COVID-19 pandemic:
• In San Jose, the city’s poorest, and predominantly Hispanic, zip codes had a death rate from COVID-19 by
April 2020 quadruple that in the wealthiest zip codes. Most—70 percent—residents in the hardest-hit zip
codes worked in occupations, such as services, construction, or Uber driving, that preclude working from
home, and many live in multifamily or multigenerational households, where transmission risk is increased.48
• In San Francisco, the city-wide positive rate per 100,000 people was 14.7 but about twice as high in
neighborhoods such as SoMa (29.3) with high levels of homelessness, as well as concentrated low-income
and minority communities (Figure 3).49
Figure 3: COVID-19 Rate of Cases by Zip Code (San Francisco)
Legend
COVID-19 Rate of Cases by Zip Code
Estimated Rate of COVID-19 Cases 94123 94133
per 10,000 Residents 94129
94109 94111
94105
More than 50 94115
45.1 - 50.0 94118
94102
40.1 - 45.0 94121
94117 94103
35.1 - 40.0 94158
30.1 - 35.0
94122 94114 94107
25.1 - 30.0
20.1 - 52.0 94110
15.1 - 20.0 94116
94131
10.1 - 15.0 94127 94124
5.1 - 10.0
Fewer than 5
Less than 10 cases 94132 94134
94112
Source: City of San Francisco (2020)
In New York City, which at the time of writing was the most severely impacted metropolis in the world,
predominantly African-American and Hispanic neighborhoods, as well as those with low-income residents,
have suffered the highest death rates. The death rate in hardest hit zip code—11239—was almost 40
percent higher than the area with the next highest rate.13 The neighborhoods with the highest rates
of confirmed COVID-19 cases were also disproportionately low-income and racially segregated, where
residents are less able to work from home and tend to rely on public transit.14 A separate analysis of mobile
phone data shows that low-income, African-American, and Hispanic neighborhoods have had relatively
more work activity and less sheltering-in-place during the pandemic.15
Page 7COVID-19 has a postcode: How urban housing and
spatial inequality are shaping the COVID-19 crisis
Recent mapping of how socioeconomic and racial disparities intersect with the COVID-19 pandemic has drawn
on US Census data, quantifying death rates at the county and zip code level. Striking findings include that:
• At the county level, people living in the poorest, as well as the most economically and racially polarized,
counties have experienced “substantially elevated rates of COVID-19 infection and death.”16
• There is a strong association between COVID-19 death rates and crowding, defined as the share of
households with more than one person per room.”17
• Another recent study in Milwaukee at the census tract level found that the number of incarcerations
was a strong predictor of COVID-19 cases, suggesting that mass incarceration, which disproportionately
impacts low-income minority neighborhoods, may increase vulnerability to public health crises.18
In Brazil, COVID-19’s spread began in wealthy neighborhoods in Sao Paulo, Rio de Janeiro, and Fortaleza. By
mid-May, however, COVID-19 was most rampant in poor districts such as Brasilandia, which has Sao Paulo’s
highest death toll, and Campo Grande, Bangu, and Iraja in Rio de Janeiro.19 Poor Brazilians, due to disparities in
access to health care and pre-existing conditions, are more likely to die if infected with COVID-19: in Iraja, for
example, the death rate is 16 percent, while in the wealthy Leblon neighborhood of Rio the death rate is 2.4
percent (in line with global trends). In Brasilandia, the death rate is a shocking 52 percent. Preliminary spatial
analysis in Sao Paulo concluded that population density was a key indicator of COVID-19 death rates.20
Spatial disparities in COVID-19’s impact are also evident in South Africa. Cape Town has 60 percent of South
Africa’s cases,21 but within Cape Town, the economically-disadvantaged Tygerberg and Khayelitsha districts
have been the most severely affected. In the more affluent suburb of Hout Bay, the most severe impacts
were in the disadvantaged township Imizamo Yethu, where the most recent census indicated there were
roughly 61 households for each toilet and nearly 400 households share each tap.22
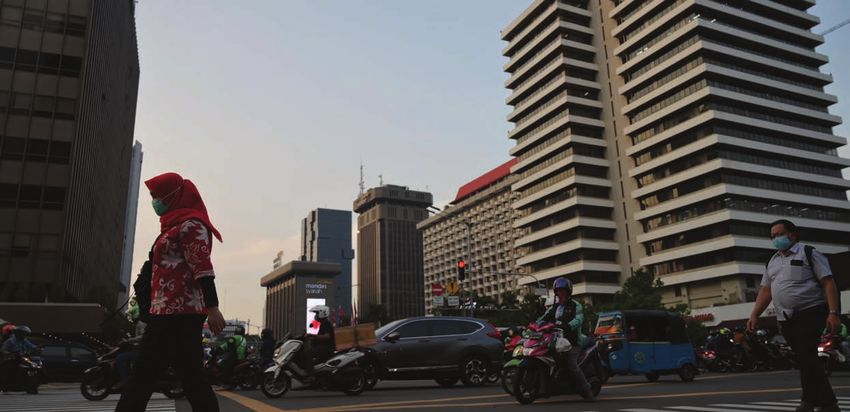
By way of contrast, in Jakarta, Indonesia, a mapping of data from the provincial government’s COVID-19
response website onto Jakarta’s neighborhoods, in April 2020, found that most clusters of infection were
in middle class or affluent neighborhoods. This finding highlights that COVID-19 health outcomes will not
necessarily align with socioeconomic disparities, although the patterns may reflect limits in local COVID-19
testing capacity and disparities in access to tests, leading to underestimated infection rates in poor areas.23
Government policies to address the COVID-19 pandemic, including lockdown/stay-at-home orders, have had
major economic impacts on disadvantaged communities—who are far less likely to be able to telework, and/
or work in high-risk essential frontline services. Evidence on the pattern of job losses suggests that workers
in the services sector, as well as women and young workers, have been especially hard hit.
Nearly all of the world’s workers live in a country with some form of COVID-19 “workplace closure measure”
in place. Among these, informal workers—including 400 million in India alone—as well as young people, are
especially economically at risk.24 The ILO has suggested the emergence of a “lockdown generation” whose
education, employment, and income all stand to be severely disrupted by the pandemic. For example,
nearly 77 percent of the world’s young workers—or 328 million people—worked in the informal sector in
early 2020. In a recent survey, one in six young workers said they had stopped working since the onset of
the COVID-19 crisis.25
Globally, reduced working hours have often affected low-paid workers worst.26 In the United States, poor
workers have been most severely impacted by lockdown orders—about one in four in households earning
$40,000 or less have lost their jobs,27 while women accounted for 55 percent of job losses in April 2020.28
Racial minority groups have been disproportionately affected, with the largest employment declines among
Hispanics, and greater declines for African-American workers than for whites. These disparities may be
partly explained by the concentration of racial minority groups in industries where remote work is infeasible.
29
In early June 2020, the unemployment rate unexpectedly fell for white workers, but rose for African-
Americans to 16.8 percent, its highest point in ten years.30
Page 8COVID-19 has a postcode: How urban housing and
spatial inequality are shaping the COVID-19 crisis
In developing countries, lockdown and stay-at-home orders have devastated the incomes and employment
of poor and migrant workers, who depend on daily wages to meet basic needs, and lack savings to cushion
impacts.31 The World Bank further predicts that remittances to low- and middle-income countries will drop
by 20 percent in 2020.32
Enforcement of social distancing and lockdown orders has, in some cases, led to human rights abuses. Reports
indicate that some such measures have disproportionately targeted poor communities and disadvantaged
neighborhoods when they were enacted in the Philippines33 and Honduras.34 In Nigeria, security forces
have reportedly killed at least 18 people while enforcing a national lockdown in major cities.35 In India, the
nationwide lockdown left tens of thousands of migrant workers stranded, and there have been reports of
police brutality in several states.36 In Nairobi’s Kibera slum, a planned food distribution turned into a violent
confrontation between residents and security forces.37 UN High Commissioner for Human Rights Michele
Bachelet has cited the proliferation of repressive emergency measures as a major human rights challenge.38
Research on residential segregation from before the COVID-19 crisis illuminates how it is deeply connected with
other forms of inequality—and how pre-existing inequality exacerbates health outcomes during the pandemic.
In wealthy countries, residential segregation is reflected in unequal patterns of home ownership and rental,
income and race gaps. These inequalities exist in developing countries, as well, which have the added and
highly visible manifestation of informal settlements, which exist apart—both geographically and in terms of
access to opportunity and services—from urban centers.39
In the United States, neighborhoods with large African-American and Hispanic populations are, among other
things, disproportionately “rent burdened,” meaning that monthly rent for many residents costs at least
30 percent of their monthly income.40 There has been a hollowing out of the middle class over time—in
1970, two thirds of families in large metropolitan areas lived in middle-income neighborhoods in which the
median income reflected that of the larger area, but by 2009 this share had fallen to 42 percent, while the
share of families living in either poor or affluent neighborhoods doubled from 15 to 33 percent.41 In the US
this is highly intertwined with racial disparities and discrimination.42 In the 100 largest metropolitan areas
in 2014, a third of low-income whites lived in high-poverty urban neighborhoods, compared to nearly 72
percent of low-income African-Americans and 67 percent of low-income Hispanics.43
Local land use regulations contribute to residential segregation—including zoning ordinances which limit
neighborhood density and building lot sizes and reduce the supply of affordable housing in predominantly
white neighborhoods.44 In developing countries, decentralization of governmental authority also has
significant impacts on housing market regulation (Box 1). In recent years, major US financial institutions
have been penalized for continuing to engage in discriminatory practices.45 In Indonesia, zoning and land
use regulations have been linked to unequal access to transportation.46 In South Africa, the national Spatial
Planning and Land Use Management Act of 2013 seeks to redress the legacy of apartheid-era segregation.47
Page 9COVID-19 has a postcode: How urban housing and
spatial inequality are shaping the COVID-19 crisis
Box 1. Decentralization and housing
In developing countries, decentralization—the transfer of authority for certain governmental
functions from the central government to sub-national governments—is an important factor in land
market regulation and housing.
Municipal governments are responsible for myriad housing policy areas, including zoning, building
regulation, and project approval, as well as maintaining property registries or cadastral systems. A
review of 49 countries in Africa, Asia, and Latin America found in nearly all these functions were
undertaken at the municipal level.55
Decentralization’s potential benefits include increasing voice and empowering local people and
communities. By placing decision-making authority at a more local level, decentralization promotes
the ability of individuals to influence the policy choices impacting their lives and to hold leaders
accountable.56 In the area of housing, studies suggest that decentralization may incentivize
politicians to oppose evictions and to grant title to the residents of informal settlements.57 At the
same time, decentralization has been identified with challenges in the housing context, including
undermining service delivery, encouraging urban sprawl, and contributing to inequality.58
Emerging analysis suggests decentralization has both aided and, in some cases, hindered
government responses to the pandemic. In Pakistan, decentralization has enabled subnational
governments to pursue tailored policy responses, including in the area of public health, but
has also increased the complexity of coordinating between different levels of government.59 In
Indonesia, the Carnegie Endowment has argued that a disjointed pandemic response—especially
at the district (equivalent to municipal) level—may cause a “reevaluation” of the country’s
decentralization laws.60
While the decentralization policy agenda is beyond the scope of this note, it is clear that
transparency and oversight of electoral processes at the local level are important, as political
accountability has been shown to yield benefits in terms of housing market regulation.61
Residential segregation and housing inequality are an important factor in health disparities along
measures such as life expectancy, childbirth, and infectious disease in the urban context. In Chicago,
average life expectancy varies by as much as 30 years depending on the neighborhood where a baby
is born.50 In Panama City, San José, and Mexico City, among other large Latin American cities, spatial
differences in average life expectancy have been linked with socioeconomic status (Figure 4).51 Residential
segregation has also been linked to the transmission of infectious diseases by concentrating risk
factors, including poverty, poor housing, and lack of access to healthcare, in confined spatial areas.52 In
neighborhoods where residents tend to work in industries that do not permit “work from home”—such
as food service and transportation—risk from the COVID-19 is elevated.53 In Salvador, Brazil, a major
outbreak of leptospirosis most severely impacted the urban poor living in slums on the edges of the city,
due to lack of basic sanitation.54
Page 10COVID-19 has a postcode: How urban housing and
spatial inequality are shaping the COVID-19 crisis
Figure 4: Intra-urban life expectancy disparities: Panama City, San Jose, and Mexico City
Panama City San José Mexico City
61.3 - 70.5
70.6 - 72.2
64.1 - 73.5 74.3 - 76.2 72.3 - 74.1
73.6 - 76.2 76.3 - 77.1 74.2 - 75.4
76.3 - 81.0 77.2 - 77.5 75.5 - 83.9
81.1 - 84.7 77.6 - 78.9
0 20km 0 20km 0 40km
84.8 - 102.6 79.0 - 79.7
Source: Bilal et al. (2019)
The research outlined above, illustrating how residential segregation is associated with disparities in
health and other socioeconomic measures, bolsters the conclusion that COVID-19’s impacts will be felt
disproportionately in disadvantaged areas.
Renters
Renters typically have lower income and savings, as well as less access to credit and less job stability, than
homeowners.62 By definition, renters normally pay for housing on a regular basis, typically monthly—
this means that economic shocks and job losses associated with the COVID-19 crisis can have serious
repercussions on housing security.
In the near-term, renters are more likely to experience job loss and financial dislocation due to economic
consequences of social distancing and stay-at-home orders. For example, the U.S. Federal Reserve
estimates that the poorest 20 percent of U.S. households were spending more than half of their income
on housing costs (classified as “severe” rent burden) even during an economic boom.63 An estimated 16.5
million renter households now have at least one member who works in an industry that is immediately at
risk of job layoffs or pay reduction.64 Nearly half of renters (47 percent) in a nationally-representative US
survey reported that during the pandemic they couldn’t pay their rent or utilities, were experiencing food
insecurity, or couldn’t afford needed medical care.65
In New York City, neighborhoods with the highest shares of economically vulnerable households
were those with pre-existing housing market inequalities, such as a high proportion of rent-burdened
households (Figure 5).
Page 11COVID-19 has a postcode: How urban housing and
spatial inequality are shaping the COVID-19 crisis
Figure 5: Share of renter households with at least one member employed in a vulnerable occupation
New York City,
Sub-Borough Areas
(PUMAs), 2018
Share of renter households
Insufficient Data
>=60%
40% - 60%COVID-19 has a postcode: How urban housing and
spatial inequality are shaping the COVID-19 crisis
official test results.71 One slum in Bangalore is 12 times denser than the city average,72 housing 140,000
people per square kilometer, and only 60 percent of residents could access piped water73—and even then,
only for an average of two hours per day, two to three days a week. In such settings, hand washing means
traveling to a shared tap or drawing from a scarce household supply.
In Cape Town, geographic information system (GIS) analysis shows social distancing may be difficult
or impossible for informal settlement residents during a COVID-19 lockdown. Residents “would be
asked to do the impossible, as they would be unable to leave their homes to access toilets and water
while maintaining a safe 2-meter separation distance.”74 Figure 6 depicts Klipfontein Glebe, an informal
settlement where residents face difficulty in social distancing.
Figure 6: Cape Town – Klipfontein Glebe informal settlement
0 200 400 600 800 1,000 Meters
Source: Gibson and Rush (2020)
Note: Color clusters represent groups of dwellings unable to practice social distancing from neighbors in same color cluster.
Given their heightened risks, knowledge and awareness of the COVID-19 pandemic is critical to
populations living in slums and informal settlements. Available evidence suggests that awareness is good,
but it is very difficult for people to abide by lockdowns.
• A survey of more than 2,000 individuals in five informal settlements in Nairobi,75 where an estimated 60
to 70 percent of the population lives in urban slums,76 found knowledge of COVID-19, such as symptoms
and high-risk groups, was generally high. However, 61 percent of respondents indicated that social
distancing would disrupt their source of income.
• A recent survey in Bangalore—where over 70 percent of work is informal—showed that while many low-
income workers worried about contracting COVID-19, most felt compelled to continue working for fear of
losing income, jobs and the ability to feed their families.77
Informal settlements are often home for migrant workers. In Karachi, an estimated fifty percent of the
migrant population, which totals 2.5 million people, lives in informal settlements.78 Housing in these
settlements is dense and includes accommodations for day laborers where as many as 15-20 people share a
room.79 In early March, many of these economic migrants left the city following the provincial government’s
lockdown order, raising fears that the mass exodus may have contributed to COVID-19’s spread.
Page 13COVID-19 has a postcode: How urban housing and
spatial inequality are shaping the COVID-19 crisis
Due to their political exclusion and discrimination, residents of informal settlements are also at risk of
becoming targets for human rights violations during the pandemic, as has been seen in the actions of
local authorities in South Africa and Ethiopia.
In South African cities such as Cape Town, Durban, and Ekurhuleni, local authorities have demolished
shacks used, according to local rights groups, by people who lost their homes and employment during the
pandemic. Community groups working in informal settlements have pushed back against these abuses. A
legal challenge resulted in the Cape Town High Court ordering the municipal government “to return building
materials to residents so they could rebuild some of the demolished homes on the same land, on the basis
that no additional homes are built.”80 In Durban, Right2Know and the Social Justice Coalition, for example,
have petitioned President Cyril Ramaphosa and Durban’s mayor regarding alleged illegal evictions.81
Municipal authorities in Addis Ababa demolished informal settlements due to fears over the COVID-19
pandemic. Amnesty International estimates at least 1,000 people have been forcefully ejected from their
homes in informal settlements in city’s Bole district.82 Residents report that they were given little or no
notice prior to the demolition.
Homelessness
Homelessness is a key urban challenge during the COVID-19 pandemic.83 Homeless people suffer the most
extreme form of housing deprivation: by definition they cannot “stay home,” to follow the basic directive
issued by many governments in both developed and developing countries. Social distancing is frequently
difficult in shelters, and homeless people tend to have health conditions that can significantly worsen
COVID-19’s impacts. Many have low access to health services.
It is estimated that at least 150 million people—about 2 percent of the world’s population—live on the
street or in shelters.84 In Rome, charitable groups report that many of the city’s 8,000 homeless are going
hungry and lack access to sanitary facilities due to the disruption caused by the pandemic.85 A recent
study of 11 cities in Ethiopia estimated that at least 88,000 Ethiopians currently live on the street—with
about 50,000 in Addis Ababa alone.86 India, which already had one of the world’s largest homeless
populations, saw a massive increase as the government’s lock-down measures rendered millions of
migrant laborers homeless and jobless almost overnight.87 In the US, more than 570,000 people are
currently homeless—with 63 percent living in shelters or transitional housing, and about 211,000
living rough.88 This population is disproportionately older89 and prone to health problems,90 and unmet
healthcare needs.91 Experts predict severe COVID-19 impacts,92 due to such risk factors as overcrowding.93
Women and girls who experience homelessness encounter unique challenges. Although they are
homeless at lower rates than men, the risks and impacts are often tied to such factors as domestic
violence, employment discrimination, and human trafficking. Survivors of domestic abuse, for example,
may face a choice during the COVID-19 pandemic between overcrowded and dangerous shelters or
returning to a violent partner.94
3. Emerging policy and program responses
There is a major long-term agenda to address the foregoing disparities. This includes investments in
infrastructure for water, sanitation, housing, and health care to specifically improve access for those
residents currently being left behind.95 In the absence of fundamental structural reforms, after the
immediate crisis subsides, the housing and social disparities will remain, and possibly worsen, if not
addressed. The politics and prospects for longer-term reforms are addressed further below.
There is also a critical short-term agenda. The COVID-19 pandemic has prompted responses by
governments and civil society at different levels—from the national, state/provincial to the municipal
Page 14COVID-19 has a postcode: How urban housing and
spatial inequality are shaping the COVID-19 crisis
and local, as well as global agencies. Actors at these levels have different capacities but have also worked
collaboratively on policy interventions. There has been a huge range of programs and major expenditures
and extraordinary voluntary efforts within a short space of time, although it is not yet clear that these are
fiscally and otherwise sustainable in the longer term.
The COVID-19 pandemic has prompted guidance and led to global calls for action on the housing and
urban front fronts, motivated by the need to avert the undue fallout on disadvantaged groups. These are
summarized in Box 1. There is clear commonality of themes, with an emphasis on service delivery (water
and sanitation), economic assistance and social protection, as well as the need to collect actionable data
to plan COVID-19 responses.
Box 2: Urban COVID-19 responses—overview of international guidance
The World Bank has issued guidance for local governments during the COVID-19 pandemic based
on six core principles:96
• Assure a coordinated response and incident management structure
• Anticipate and manage health crisis to contain the epidemic
• Assure coverage of basic needs and maintain access to essential services
• Support vulnerable groups
• Adapt institutional and financial management to support COVID-19 response
• Safeguard the economy and development gains to promote swift restoration of normal life
UN-Habitat has issued a COVID-19 Response Plan97 which emphasizes three pillars:
• Support local governments and community-driven solutions
• Scale up urban data and mapping for evidence-based solutions on COVID-19
• Mitigate the economic impact of the pandemic and initiate strategies for recovery
The UN Special Rapporteur on Adequate Housing has called for national and subnational
governments to cooperate and has advocated for a global policy spotlight on key housing
challenges during the pandemic, including evictions, informal settlements, rent and mortgage
payments, and homelessness.98
The World Resources Institute recommends four short-term strategies:
1. City agencies should provide access to basic water and sanitation facilities for free.99
2. National governments should process fiscal transfers to states/cities so they can immediately
distribute cash assistance—through more creative means than usual, if necessary—to those who
need it most.
3. Government and private health care providers must step up efforts to provide access to
emergency services in cities’ most under-served areas.
4. City governments must work more closely with community leaders and NGOs that work in
informal settlements and other at-risk communities.
In this light, we undertook a rapid desk review of responses in terms of both instruments—programs
and legislative actions—as well as place-based approaches and efforts to support the homeless. Sources
of information include OECD, IMF, and World Bank resources, as well as recently developed COVID-19
information repositories at academic institutions.100 The Cities for Global Health initiative101 has usefully
documented nearly 500 city level responses across 31 countries—mainly in Europe and Latin America—as
of late May 2020, and categorized these under several broad headings: prevention, continuity, mitigation
and transformation.
Page 15COVID-19 has a postcode: How urban housing and
spatial inequality are shaping the COVID-19 crisis
A raft of measures and initiatives have emerged—here we limit the focus to housing-related aspects, as well
as social protection, given its more general importance. This section highlights progressive innovations—
where proactive policies were used to support inclusion, or where policy reforms targeted exclusion, with a
focus on Mexico, Indonesia, Sweden, South Korea, Ethiopia, and South Africa, as well as the US.
Social protection
Social protection has been at the forefront of government attempts to mitigate the repercussions of the crisis.
Here we very briefly review the state of play, on what is a vast topic. Further analysis is available on the World
Bank and ILO websites—although evidence of distributional allocations and impact are not yet available.
Many governments have pursued innovative approaches to provide financial support to people hit hard
by the crisis. In Brazil, the government will provide vouchers worth R$600 to informal sector workers not
supported through traditional cash transfer programs. In India, the state government of Uttar Pradesh will
use an online payment system to compensate workers, such as vegetable vendors, rickshaw drivers, and
construction workers who lost work due to the pandemic.102
The World Bank reports that social assistance is already being adapted in several ways—specifically,
expanding coverage, increasing benefits, and making administrative requirements simpler and more user-
friendly—which are all welcome. One especially positive development is that many governments have
moved away from entitlements based on formal employment and linked to previous earnings—instead
providing emergency assistance in the form of lump sum payments, sometimes one off, sometimes on a
continuing basis, some in cash and some in kind (like food). As of May 5, 2020, 159 countries had planned,
introduced or adapted 752 social protection measures in response to COVID-19, which represents a
tripling in the number of countries and an eight-fold increase in measures since March 20, 2020.
The rapidly changing situation is being tracked by the World Bank,103 which reports that among COVID-19-
related social protection programs:
• About one-third are cash transfers—of which about 59 percent are new programs.
• One-fourth of measures are one-off payments.
• Average duration of benefits is about three months.
• The size of transfers is relatively generous, or 25 percent of monthly income per capita—for the 14
countries where data is available, this is about 90 percent higher pre-COVID transfer levels.
Preliminary analysis for a subset of cash transfer programs with comparable data allowed to estimate
the scale up of programs relative to pre-COVID-19 levels shows that the Philippines and El Salvador
are quadrupling their coverage (in the Philippines, more than 70 percent of households will receive
emergency transfers), while Mauritania has almost doubled coverage. In Argentina, Pakistan and Peru,
new programs cover one third of their populations.104
Another key social protection measure is rent subsidies, which help renters to meet rent payments. A
promising example is in Spain, where a microgrant program assists renters to make rent payments while
limiting the impact of rent moratoria on the broader economy.105 The provincial government of British
Columbia has allocated $500 per month for three months to enable renters to pay the rent.106 In Malta,
the government will subsidize rent for people who are unemployed due to the pandemic.107 Italy has
established a National Fund to provide 106 EUR to municipalities to support access to rental housing.108 In
the United States, experts have advocated for COVID-19-related rent subsidies modeled on a pre-existing
federal voucher program.109
Page 16COVID-19 has a postcode: How urban housing and
spatial inequality are shaping the COVID-19 crisis
There are major gaps, however.110 For example, a Yale study recently documented the exclusion of more
than half of the women who were entitled to assistance in India.111 In South Africa, reports indicate
that many workers cannot access income support as their employers have not registered them for a
government-run relief program.112
As of mid-May 2020, the average fiscal support package introduced by African governments amounts
to a meager 0.8 percent of GDP,113 one-tenth the level in developed countries. Moreover, much of the
assistance to date has been immediate but for a short period of time—even though significant social
assistance will likely be needed for several months, if not years.
According to the ILO, developing countries have an average financing gap for implementing an adequate
social protection floor equivalent to 1.6 percent of national GDP, rising to 5.6 percent for low-income
countries.114 The debt relief announced by the international financial institutions could well be directed to
boosting this support, but this is not yet known.
Legislative actions: rents, evictions, and mortgages
Legislative actions at the national, state and local levels have provided protection for tenants as well as
homeowners. Protection for tenants has included restrictions on rental fee increases, moratoria on rent
or evictions in the event of non-payment, and support for homebuyers with mortgages.
As renters face increasing economic stress, rent and eviction moratoria during the COVID-19 pandemic
can provide protection, allowing renters to remain in their homes and create time for the establishment
of other programs, such as rent subsidies. Governments at the national and regional levels have issued
both rent and eviction moratoria:
• In South Africa, the national government ordered municipalities to suspend all evictions and service
cutoffs until the COVID-19 lockdown is lifted. However, legal and civil society groups report that tenants
have been evicted despite the order.115 In Cape Town and Durban, residents of informal settlements
report being violently evicted by police and private security in spite of the government order.116
• In Ethiopia, an eviction moratorium and ban on rental fee increases was issued as part of a state of
emergency order in early April.117 Regional authorities in Tigray State similarly prohibited the eviction of
renters or increase in rental fees in late March.118
• Ukraine has prohibited evictions during the national COVID-19 quarantine.119
• Spain’s national government has ordered a range of measures related to eviction moratoria. For tenants
of “large” real estate owners (defined as owners of ten properties or more), the government also issued
a moratorium on rental payments. Tenants of “small” property owners—85 percent of landlords—may
request government assistance for rental payments. The program includes rental aid of up to 900 euros
per month for vulnerable groups, including domestic violence survivors and the homeless.120
• Eviction moratoria have been issued by France, the United Kingdom, as well as by some Canadian
provinces and municipalities.
• In the United States, residents of federally subsidized apartments are protected from eviction under
national COVID-19 aid legislation.121 A review in late April identified 14 states and 24 major municipalities,
including Los Angeles, New York City, Washington, D.C. with some form of eviction moratorium.122
• In Singapore, the government has prohibited the eviction of persons who are under self-quarantine or
government stay-at-home order, as well as foreign workers, because of discrimination due to COVID-19 fears.123
• In Lisbon, the municipal government has suspended rent payments for about 70,000 residents of
public housing.124
Page 17COVID-19 has a postcode: How urban housing and
spatial inequality are shaping the COVID-19 crisis
Although rent and eviction moratoria have been embraced in the above settings in the early stages of
the COVID-19 pandemic, the Brookings Institution notes that city and local governments that depend on
property taxes from the owners of rental properties can be adversely affected.125
While rent and eviction moratoria provided some temporary relief to renters during the acute stages
of the COVID-19 crisis, the payment of direct subsidies to renters may be a more sustainable means of
support in the period ahead.
Mortgage forbearances grant mortgage holders a short period during which they can defer payment.
During the COVID-19 pandemic, several countries have issued mortgage forbearances for short periods—
usually lasting 3-6 months. Italy, Spain, and the Slovak Republic have provided for temporary deferment
of mortgage payments.126 National legislation in the United States on the COVID-19 pandemic (CARES Act)
provides homeowners whose mortgages are federally-backed the right to request a 180-day forbearance.
The United Kingdom and Ireland have enacted mortgage payment moratoria, while the government of
Hungary has asked banks to provide forbearance (without legislative mandates).127 In El Salvador, the
government ordered a 90-day moratorium for mortgages for those who have been negatively affected by
COVID-19.128
Such measures may enable mortgage holders to handle cash flow challenges during the pandemic.
Additional measures, such as moratoria on late payment penalties and foreclosures often accompany
mortgage forbearances.129
Place-based efforts: informal settlements
As outlined above, people living in informal settlements often face major challenges in terms of
overcrowding and access to services. Policy responses have sought to raise awareness about safety and
health, extend adequate water and sanitation, and blunt economic fallout in vulnerable areas. Collective
and NGO efforts are playing a key role.
Local efforts to promote public awareness, demand recognition, and facilitate service delivery—especially
hygiene and hand washing—covering immediate needs include:
• In Indonesia, the national government program KOTAKU has supported community efforts to produce
and distribute masks, food and disinfectants, and to monitor health conditions in informal settlements—
known locally as kampungs.130 Community groups have reportedly also enforced kampung-level
lockdowns in neighborhoods in Jakarta, encouraging social distancing and providing hand sanitizer at
access points to the kampung.131
• In Rio de Janeiro, favela residents have organized self-help groups to address gaps in the government’s
COVD-19 response. Examples include Redes da Maré, which has distributed food and hygiene supplies in
the city’s north. Other groups have conducted information campaigns to raise awareness regarding healthy
practices during the pandemic, and to demand that local authorities address the needs of favela residents.132
• In Mumbai, Mahila Milan, a network of women’s collectives, has taken the lead in coordinating
information about the COVID-19 pandemic in a cluster of tenements known as Indian Oil. Activities
include campaigning for a local market to be moved to an open space where social distancing is possible,
and monitoring for the spread of false information about COVID-19.133
• So Shining Hope for Communities (SHOFCO), a community organization supported by the Rockefeller
Foundation, works in Kibera and nine other slum areas in Nairobi. SHOFCO’s COVID-19 initiatives include
provision of open-air hand washing stations, community health workers, as well as cash transfers to the
most vulnerable slum residents.134
• In South Africa, the SDI Alliance, a civil society group, has coordinated with national, provincial, and
municipal governments to jointly develop COVID-19 strategies in Cape Town, Swartland, Stellenbosch,
and eThekwini. A key activity has been the implementation of a public information campaign in informal
settlements to raise awareness of COVID-19 safety and hygiene.135
Page 18COVID-19 has a postcode: How urban housing and
spatial inequality are shaping the COVID-19 crisis
• In Kenya, UN-Habitat is providing assistance to the government’s initiative to enhance access to adequate
water and sanitation in informal settlements, and to collect data in potential urban hot spots.136 UN-
Habitat is also collaborating with governments to enhance sanitary facilities in Cambodia, Egypt, Iraq, and
Myanmar.137
• In Brazil, local committees in the favelas have installed hand washing stations at neighborhood entrance
points. Rwanda has also ramped up creation of hand washing sinks throughout Kigali, including at
restaurants, banks, and shops. Neighborhood resistance committees have made and distributed free
hand sanitizer made from illegal alcohol.138
A number of international agencies have responded to the pandemic, to support governments. Recent
examples from World Bank projects are outlined in Box 3.
Box 3: Examples of World Bank urban project reallocations to address COVID-19 needs
Initiatives to adjust urban projects to tackle the challenges of the pandemic include:
• The Indonesia National Slum Upgrading Program supports primary infrastructure and community
infrastructure grants and targets 6,000 slums throughout the country. Remaining project
resources are being redirected to scaling up cash grants in 1,000 communities and strengthening
monitoring to track program effectiveness and COVID-19’s social and economic impacts in
targeted communities.139
• The Ethiopia Urban Institutional and Infrastructure Development Program (UIIDP) has focused
on three key COVID-19 response strategies: proving essential municipal services, including water,
sanitation, and waste management; providing employment for the urban poor; and financial
support for emergency response and bolstering local government revenue.140
• The Metropolitan Buenos Aires Urban Transformation Project supports communications and
digital connectivity interventions in the city’s most visible informal settlement (Barrio 13).
Communication campaigns are being adapted to focus on COVID-19 relevant information.
The provincial government has requested to use uncommitted funds to construct 3,200 units
of urban social housing for the dual purpose of job creation and providing safe housing to
vulnerable populations.141
The provision of safe water, sanitation, and hygienic conditions is critical to infectious disease responses,
especially in urban slums.142 Promising initiatives to step up service delivery in these areas have occurred
in Syria, Rwanda, and Ethiopia, among other places.143 Recent analysis144 by WRI identifies three strategies
to create gains in service delivery during and after the pandemic crisis, including:
• Substantial increase in investment in clean water and sanitation
• Effective management of water resources, including limits on industrial and agricultural water use, as well
as control of water pollution
• Boost investment in natural ecosystems, such as a natural infrastructure project in São Paulo that reduced
soil erosion by 36 percent.145
Page 19You can also read