CENTRAL EUROPEAN REVIEW OF ECONOMICS & FINANCE - ARTICLES MISCELLANEA 2014 VOL. 5, NO. 2
←
→
Page content transcription
If your browser does not render page correctly, please read the page content below
FACULTY OF ECONOMICS
     Kazimierz Pulaski University of Technology and Humanities
                             in Radom

Central European review
 of economics & finance

                                                                         2014
                                                                 Vol. 5, No. 2

                       Articles
                      Miscellanea
Scientific Board
Chairman
Sławomir I. Bukowski Małgorzata Janicka Antonin Rusek
Bohdan Jeliński Tomasz Rynarzewski
Ewa Bagińska Witold Kasperkiewicz Jüri Sepp
Jan L. Bednarczyk Elżbieta Kawecka-Wyrzykowska Jan Solarz
Wojciech Bieńkowski Anna Barbara Kisiel-Łowczyc Tadeusz Sporek
Janusz Bilski Henning Klodt Wacława Starzyńska
Ewa Bojar Eugeniusz Kwiatkowski Turan Subasat
Paweł Bożyk Pantelis Kyrmizoglou Wanda Sułkowska
Bruno Bracalente Jacek Lisowski Krzysztof Surówka
Giusseppe Calzoni Teresa Lubińska Andrzej Szopa
Pierluigi Daddi Magdalena Majchrzak Bogusław Ślusarczyk
Ivan Dimitrov Monika Marcinkowska Helena Tendera-Właszczuk
Zbigniew Dresler Jarosław Marczak Piotr Urbanek
Leszek Dziawgo Elżbieta Mączyńska Henryk Wnorowski
Stanisław Flejterski Jan Jakub Michałek Grażyna Wolska
Eliza Frejtag-Mika Antoni Moskwa Viktoria Vasary
Grigorios Gikas Marian Noga Spyros Vassiliadis
Jan Głuchowski Leokadia Oręziak Alexander A. Zadoya
Andrzej Gospodarowicz Cristiano Perugini Dariusz Zarzecki
Robin Gowers Krystyna Piotrowska-Marczak Kazimierz Zieliński
Tomasz Gruszecki Jozef Polačko Jerzy Żuchowski
Peter Halmai Fabrizio Pompei Marian Żukowski
Alina Hyż Wiesława Przybylska-Kapuścińska Katarzyna Żukrowska
Editorial Board
Editor Associate Editors Members of Editorial Board
Tadeusz Dyr Katarzyna Kalinowska Urszula Kosterna
(International Economic Integration) Aneta Kosztowniak
Deputy Editor Ayla Ogus Binatli (Economics) Marzanna Lament
Aleksander Lotko Grażyna Olszewska (International Finance) Małgorzata Lotko
Kazimierz Ortyński (Economics of Insurance) Ewa Markowska-Bzducha
Statistical Editor Elżbieta Siek (International Economics, Izabela Młynarzewska-Borowiec
Zbigniew Śleszyński Labour Economics) Ireneusz Pszczółka
Wojciech Sońta (Public Finance) Katarzyna Sieradzka
Marzena Sobol
ISSN 2082-8500
Publishing Cooperation: Printing House:
Instytut Naukowo-Wydawniczy „SPATIUM” Drukarnia Bookpress.eu,
ul. Starowolska 13A, 26-600 Radom, ul. Struga 2,10-270 Olsztyn
tel./fax 48 369 80 74,
e-mail: wydawnictwo@inw-spatium.pl
http://www.inw-spatium.pl
Nakład do 200 egz.
Central European Review of Economic & Finance
Kazimierz Pulaski University of Technology and Humanities in Radom
Faculty of Economics
ul. Chrobrego 31, 26-600 Radom, Poland
www.cer.uniwersytetradom.pl
e-mail: cer@uthrad.pl
Tel. (+48) 48 361 74 59 fax: (+48) 48 361 74 77Contents
Articles
Aleksander Lotko
Classifying Variables with Cluster Analysis when Measuring Quality of Services
in Contact Centers . . . . . . . . . . . . . . . . . . . . . . . . . . . . . . . . . . . . . . . . . . . . . . . . . . . . . . . . . . 5
Izabela Młynarzewska-Borowiec
Convergence tendencies in the EU Member States – a statistical study
for the period 1980-2013 . . . . . . . . . . . . . . . . . . . . . . . . . . . . . . . . . . . . . . . . . . . . . . . . . . . . 17
Magdalena Majchrzak, Paweł Zygarłowski
The contexts of the competitivness in the higher education . . . . . . . . . . . . . . . . . . . . . . 35
Miscellanea
Zbigniew Śleszyński
Using bordered matrices for Durbin-Watson d statistic evaluations . . . . . . . . . . . . . . . 51
Paweł Korneta
What makes customers willing to recommend a retailer – the study on roots
of positive Net Promoter Score index . . . . . . . . . . . . . . . . . . . . . . . . . . . . . . . . . . . . . . . . . 61Articles Articles Articles Articles Articles
CENTRAL EUROPEAN REVIEW
OF ECONOMICS & FINANCE
Vol. 5, No. 2 (2014) pp. 5-16
Aleksander Lotko1
Classifying Variables with Cluster Analysis
when Measuring Quality of Services
in Contact Centers
Abstract
The goal of the paper was to discover, whether using one of multidimensional exploratory tech-
niques - cluster analysis in quantifying quality of services in contact centers brings logical clas-
sification of variables and if this classification can be used and measure quality of these services.
On a basis of literature studies important attributes of services delivered by contact centers
were identified. They were examined as observable variables with the use of a computer assisted
telephone interview method on a sample of 1000 contact center customers. Then, variables were
classified using cluster analysis. Clusters link observed data into meaningful structures, that is,
develop taxonomies.
Using factor analysis to quantify and measure quality of contact centers allowed to distinguish
the following clusters: „answer”, „empathy”, „availability” and „time”. The profile of contact center
services quality obtained from cluster analysis shows that the highest quality assessment is for the
cluster „answer”, then for „availability”. The quality concerning cluster „empathy” is visibly lower,
while the cluster „time” is of decidedly the lowest quality assessment.
Proposition of classifying variables into clusters creates a theoretical model which quantify
quality of services delivered by contact centers and make its structure more comprehensible.
In practice, a proposed classification allows to identify quality gaps and design contact centers
services with a special attention paid to the matters of quality to meet customers’ expectations.
The paper’s contribution is a novel way of quantifying and measuring quality of services
in contact centers.
JEL Classification Code: C380, M310 .
Keywords: contact center, service quality, cluster analysis, communication, ICT.
1
Associate Professor, Ph.D., Kazimierz Pulaski University of Technology and Humanities in Radom,
Faculty of Economics.6 Central European Review of Economics & Finance Introduction The service sector is expanding at an increasing rate and is becoming intensely competitive (Chen, Gupta and Rom, 1994; Johnson, Dotson and Dunlap, 1988). The growth has been occurred as many service providers are now seeking to lower the cost of providing services while increasing the time period access is available (Sta- ples, Dalrymple and Phipps, 2001). It also reflects the desire of companies to improve access to their services, in a cost-effective manner, and retain satisfied customers (Bird, 1998). This can be done via a contact center. Contact center can be defined as an office in which large numbers of telephone calls are handled, especially one pro- viding the customer services functions of a large organization, helped by advanced IT solutions. The contact center industry is one of the most rapidly growing service industries in the developed world today (Dalrymple and Phipps, 1999; Upal, 2008). As an integral part of most organizations, today contact centers play a key role in the service delivery chain. Presently in many industries, contact centers are the primary source of contact for customers. This important role implies that the per- formance management of contact centers is of critical importance to organizations, especially the delivery of customer satisfaction. Beside the others, it is possible by harnessing information technology into providing services (Gilmore, 2001; Lotko, 2009). Still, the role of people is not to be underestimated (Marr and Schiuma, 2001; Bowen and Lawler, 1992; Wallace, Eagelson and Waldersee, 2000; Bittner, 1990). The goal of the paper was to discover, if attributes describing quality of services delivered by contact centers can be grouped into some logical items. From this goal the following 2 hypotheses were drawn: H1: attributes of service quality in contact centers can be grouped into few logical items. H2: there are between cluster differences of assessed quality. Then, the results of measurement of the quality of contact center services with the use of the discovered clusters are presented. Role of a contact center in modern organizations The essential condition for an organization's functioning is having customers and maintaining contacts with them. This task is very difficult on strongly competitive markets. Hence, the main aim of an organization should be building and improving a relationship with a customer. Currently, stress is put on the importance of loyalty, responsibility and emotions, particularly satisfaction (Mazur, Jaworska and Mazur, 2001). This concept requires a departure from the traditional (i.e. transactional) at- titude towards the customer. According to the classification of encounters proposed by V. Zeithaml and M. Bittner (Zeithaml and Bittner, 2000), which are: (1) the re- mote encounter (e.g. ATM, WWW, where there is no direct human contact between organization and the customer), (2) the phone encounter and (3) the face-to-face
A. Lotko, Classifying Variables with Cluster Analysis ...                             7

encounter (e.g. cashier’s desk, where the customer physically interacts with service
provider or his personnel), contact center encompasses the two first types.
    One of the methods that can be used by the organization to gain advantage over
its competitors is providing the client with a wide range of services connected with
the product, forming a relationship in which the client feels respected, appreciated
and important for the organization, as well as treating the client in the most individu-
alized manner possible (personalization of contacts). To do so, organizations have
been implementing a single central contact point (organizational unit) whose task
is to deal with calls, inquiries, problems and other matters connected with customer
service. This contact point is most commonly named a contact center. It can be said
that contact center is „an organization or organizational unit in which each contact
with a customer (phone call, personal contact) may be dealt with by one or many
employees with access to common information” (Kostecki, 2002). So contact center is
a centralized office used for the purpose of receiving or transmitting a large volume of
requests by telephone or other method of distance communication. Trying to come up
with a concise and precise definition of the term one may say that the contact center is
a team of people, equipment and technology facilitating contacts between the supplier
and the customers via all available means of communication (Lotko, 2003).
    Separating the operations of a contact center is based on the following assumptions:
–– all customer inquiries reach a single place, i.e. a contact center (the customer has
    to know only one phone number, fax number, web page or email address),
–– communication with the customer takes place via various channels, e.g. telephone,
    fax, email,
–– contact center is equipped with suitable software which serves to access all the
    information needed for efficient customer service.
    Contact centers today not only provide customers with information but also func-
tion as a source of information for telemarketers (Wardaszko, 2001). Apart from
playing an important informative role, the centers are becoming a significant link in
the sales chain.
    Nowadays the contact center industry expands powerfully. According to Deloitte
(Deloitte, 2013):
–– 77% of organizations expect to maintain or grow in size within 12-24 months,
–– all contact channels expect growth of volume within 12-24 months,
–– 62% of organizations view customer experience provided through contact centers
    as a competitive differentiator,
–– 56% of organizations believe cost and quality management are equally important.
    Summing up, the global call center industry is set to continue witnessing strong
growth moving forward. This growth should be driven primarily by increasing focus
on providing efficient customer service as a part of business development. However,
industry players will need to continue investing in technology, human resources and
quality of services to differentiate themselves from competitors.
8 Central European Review of Economics & Finance Service quality in contact centers – the state of the art Research on service quality began in the beginning of the eighties of the 20th cen- tury. Two trends are noticeable in this research: (1) elaboration of conceptual models and (2) elaboration of measurements scales. They are connected with each other and the first trend very often triggers the second one (Seth, Deshmukh and Vrat, 2005). Recommendations concerning organization of the work of contact centers and an exemplary general classification of the dimensions of the service quality perceived by the customers (Anton, 1997) were found in the literature together with the re- sults of the study in customers’ satisfaction of the used contact channels (Kostecki, 2006). J. Horovitz (Horovitz, 2006) and N. Lake and K. Hickey (Lake and Hickey, 2006) discuss the issue of the quality of customers’ attendance, however they do not distinguish the attendance through the telecommunication interface. K. Mazurek- Łopacińska gives some of the solutions improving the quality of the remote custom- ers’ attendance, however without pointing out the use of centers of contact with the customer (Mazurek-Łopacińska, 2003). P. Kotler observes the issue of providing high quality of services within the scope of customers attendance (Kotler, 1994). A broad comparison of the most popular tools of the measurement customers satisfaction and service quality is presented by Hill and Alexander, however there are no tools dedicated to the measurement of the quality of services provided by the telecom- munication interface (Hill and Alexander, 2003). Some results of researches performed with the use of traditional service quality models are available (Gilmore, 2001; Upal, 2008), but these seem lacking the specificity of contact centers. It is underlined, that there is a need for accurate measurement of service quality in contact center and it should be treated as a priority (Gilmore, 2001). Some clues on measuring customer satisfaction and managing service quality in con- tact centers can be concluded in works by R. Feinberg, K. de Ruyter and L. Bennington (Feinberg, de Ruyter and Bennington, 2005) and S. Bartsch (Bartsch, 2012), in both books based on case studies. Other researches underline that the quality of contact center services is highly influenced by personal engagement and attitudes of the stuff (Bowen and Lawler, 1992; Wallace, Eagleson and Waldersee, 2000; Bittner, 1990). In the face of the stated research gap, author took an effort to construct a service quality model with the use of one of multidimensional exploratory techniques – cluster analysis. Remarks on methodology On the basis of literature analysis a set of observable variables composed of sixteen elements was elaborated. Three potential suggested dimensions of service quality were derived directly from the literature: availability (Dalrymple and Phipps, 1999), quality of the answer (Anton, 1997) and empathy (Parasuraman, Berry and Zeithaml
A. Lotko, Classifying Variables with Cluster Analysis ...                                      9

1988; Burgers et al., 2000). Among information quality attributes mentioned in the
literature (Stefanowicz, 2004), the following were selected: comprehensibility, com-
pleteness, accuracy and relevance (variables from 9-12). Variables number 5, 6 and 8
are derived from the analysis of the literary output (Anton, 1997). Four variables (13-
16) originate from the SERVQUAL scale (Parasuraman, Berry and Zeithaml 1988).
The analysis of other literature positions (Anton, 1994; Horovitz, 2006; Kostecki,
2006; Burgers et al., 2000) and sessions with the managers allowed for the creation
of the supply of the remaining variables.
   Subsequently a questionnaire for the measurement of the values of 16 latent vari-
ables was built. 10-point Likert scales were used to register the results.
   The sample size was 1000. For the reliability coefficient 1-α = 0,95 (z α = 1,64) an
acceptable level of error – d = 2,59% was reached. The study was carried out with the
use of infrastructure and human resources of the company Call Center Poland S.A.
The method of Computer Assisted Telephone Interview (CATI) was applied. Tel-
ephone base was selected by means of the RDD method (Random Digit Dialing).
   Observable variables considered in the study and obtained results of descriptive
statistics are presented in Table 1.
   To identify items describing quality of contact center services, cluster analysis was
applied.

Table 1. Observable variables and their descriptive statistics
Var. no.                                   Statement                            Mean   Std. dev.
   1       Contact data of contact center are easily accessible                 6,36     2,51
   2       Contact center offers convenient ways of contact                     6,47     2,46
   3       Contact center is available in convenient hours                      7,39     2,52
   4       Time for waiting for connection with contact center is short         5,52     2,93
   5       Contact center employees quickly solve my problems                   6,72     2,67
   6       Contact center employees are interested in my problems               6,58     2,70
   7       Contact center employees’ behavior builds trust                      7,40     2,42
   8       Contact center employees have knowledge allowing to give an answer   7,41     2,39
   9       Contact center gives comprehensive answers                           7,74     2,27
  10       Contact center gives complete answers                                7,28     2,38
  11       Contact center gives precise answers                                 7,20     2,36
  12       Contact center gives relevant answer                                 7,05     2,37
  13       Contact center employees treat me individually                       7,11     2,53
  14       Contact center employees give special attention to me                6,62     2,57
  15       My matters are close to contact center employees’ harts              6,29     2,61
  16       Contact center employees understand my special needs                 6,48     2,53
Source: autor’s own study.
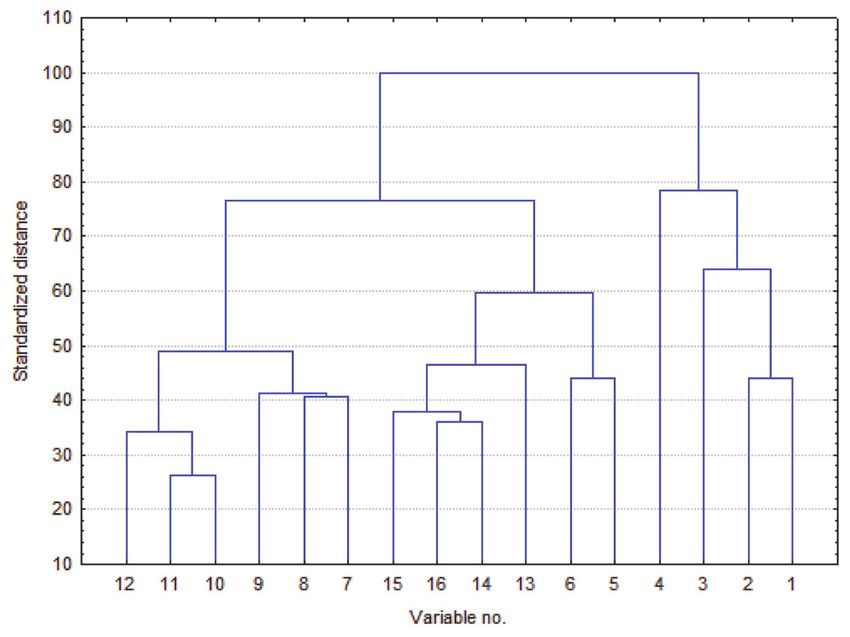
10                                     Central European Review of Economics & Finance

Using cluster analysis
   The term cluster analysis was introduced by R. Tryon (Tryon, 1939) and then
developed by R. Cattell (Cattell, 1944). The use of cluster methods has increased dra-
matically in the last 30 years (Gore, 2000). Cluster analysis encompasses a number of
different algorithms and methods for grouping objects of similar kind into respective
categories. A general question facing researchers in many areas of inquiry is how to
organize observed data into meaningful structures, that is, to develop taxonomies. In
other words cluster analysis is an exploratory data analysis tool which aims at sort-
ing different objects into groups in a way that the degree of association between two
objects is maximal if they belong to the same group and minimal otherwise (StatSoft,
1997). The objective of cluster analysis is to group objects into clusters such that ob-
jects within one cluster share more in common with one another than they do with
the objects of other clusters. (Gore, 2000).
   Cluster analysis can be used to discover structures in data without providing an
explanation and interpretation. In other words, cluster analysis simply discovers
structures in data without explaining why they exist (StatSoft, 1997). This method
is unsupervised, which means that all the relationships are found only on a basis
of input variables. It should be added, that cluster analysis is not as much a typical
statistical test as it is a collection of different algorithms that put objects into clusters
according to well defined similarity rules. The point here is that, unlike many other
statistical procedures, cluster analysis methods are mostly used when we do not have
any a priori hypotheses, but are still in the exploratory phase of our research.
   Clustering techniques have been applied to a wide variety of research problems.
Whenever it is needed to classify a large amount of information into manageable
meaningful piles, cluster analysis is of great utility. The methods used in cluster anal-
ysis encompass (StatSoft, 1997):
–– joining (tree clustering),
–– k-means clustering,
–– two-way joining,
–– expectation maximization clustering.
   Two types of clustering algorithms can be distinguished: hierarchical and non-
hierarchical. Hierarchical methods lead to creating a hierarchical tree-like structure
of the elements of the analyzed set, which in its horizontal version is called a tree
plot, and in its vertical version - an icicle plot. So, the effects of the algorithm can
be presented as a tree, which shows the next steps of the performed analyses (Mi-
gut, 2009). This way a final segmentation can be obtained, which means an orderly
combination of a breakdown into segments. Different methods can be used here.
Owing to the efficiency of reproducing the real data structure, the Ward method
is recommendable. It uses the rule of minimizing variation (Migut, 2009). These
methods do not require an earlier assumption on the number of clusters – a plot can
be „cut off ” on a proper height in the end of an analysis and then interpreted. As
A. Lotko, Classifying Variables with Cluster Analysis ...                            11

a criterion for specifying an optimal number of segments, the first distinct growth
of the distance, implying from the analyses of the distance graph for the next stages
of bonding can be acknowledged. However, for the large data sets they require high
computing power. The most popular method here is joining (tree clustering). In
turn, non-hierarchical methods are quick to calculate, but they require to declare
the assumed number of clusters in advance, which strongly influences the quality of
obtained segmentation. Here, a method of k-means is very popular.
   In the paper, for clustering variables (columns) the Ward method was used. It was
enough to identify clusters and rationally interpret them.
   Vertical tree graph (icicle plot) in Figure 1 shows clusters for service quality ob-
tained in another steps of analysis, while graph in Figure 2 shows the growth of link-
age distance in another steps (iterations).
   From Figure 2 it can be seen that cutting a plot off at a standardized linkage dis-
tance e. g. 70, 4 clusters are obtained. Figure Y shows that the substantial increase in
linkage distance took place in 11 and 13 out of 15 analysis steps.
   Interpretation of the obtained clusters is as follows (the order of linking variables
was preserved, hence they are not sorted):
–– cluster 1, „answer” (A), encompasses variables no. 12, 11, 10, 9, 8 and 7, that is
   relevancy, precision, completeness and comprehensiveness of an answer, as well as
   contact center employees knowledge and trust they are able to build,

Figure 1. Icicle plot for service quality cluster analysis
Source: authors’ own study.
12                                      Central European Review of Economics & Finance

Figure 2. Linkage distance in another steps for service quality cluster analysis
Source: authors’ own study.

–– cluster 2, „empathy” (E), encompasses variables no. 15, 16, 14, 13, 6 and 5, that
   is sympathy, understanding special customer needs, giving special attention to
   a customer, individual treating, interest in and quick problem solving,
–– cluster 3, „time” (T), encompasses variable no. 4 (time of waiting in a queue for
   connection),
–– cluster 4, „availability” (AV), encompasses variables no. 3, 2 and 1, that is avail-
   ability of contact center services in convenient hours, using convenient contact
   channels and easiness of finding contact data.
   The results of quality measurement (quality profile) for each cluster are shown
in Figure 3.
                          10

                                7,35
                          8

                                                                          6,74
                          6
                Quality

                                          6,63
                                                            5,52
                          4

                          2

                          0
                               Answer   Empathy             Time   Availability
                                                  Cluster

Figure 3. Service quality for quality clusters
Source: authors’ own study.
A. Lotko, Classifying Variables with Cluster Analysis ... 13 In Figure 3 the profile of contact center services quality obtained from cluster analysis is drawn. At this figure it can be observed that the highest quality assess- ment is for the cluster „answer” (A) – 7,35. Then, for „empathy” (E) quality reaches 6,63. The quality concerning cluster „availability” (AV) is at the level of 6,74. Cluster „time” (T) is of decidedly the lowest quality assessment (5,52). Comparing these re- sults to the results of the previous research performed with the use of factor analysis (Lotko, 2009), it seems an advantage of cluster analysis to distinguish this cluster, as meaningfully important for improving quality of services provided by contact cent- ers, as this variable has visibly the lowest quality of all. Summary Today’s information and communication technology offers possibilities to com- municate with customers in mass, yet customized manner with the use of multiple contact channels. This is done via contact centers, which are a tool for fulfilling the relationship marketing assumptions. Taking advantage on technology, organizations are seeking contact with their customers to inform them, offer additional services and learn about their behavior. Still, a problem of technology-intermediated service qual- ity arises, contradicting a traditional face-to-face relationship during service delivery. As a result of the empirical research it can be stated that the results obtained by applying cluster analysis to assessment of the quality of contact center services are sensible and logical. The results show that service quality in customer contact cent- ers can be successfully measured using the set of the four clusters: „answer”, „avail- ability”, „time” and „empathy”. In more detail, it can be concluded, that the results obtained using cluster analysis are as follows: –– cluster 1, „answer” (A), covers relevancy, precision, completeness and comprehen- siveness of an answer, as well as contact center employees knowledge and trust they are able to build, –– cluster 2, „empathy” (E), covers sympathy, understanding special customer needs, giving special attention to a customer, individual treating, interest in and quick problem solving, –– cluster 3, „time” (T), covers time of waiting in a queue for connection with contact center, –– cluster 4, „availability” (AV), encompasses availability of contact center services in convenient hours, using convenient contact channels and easiness of finding contact data. The highest quality assessment is for the cluster „answer” (A). Then, for „empa- thy” (E) it reaches 6,63. The quality concerning cluster „availability” (AV) is at the level of 6,74. Cluster „time” (T) is of decidedly the lowest quality assessment (5,52).
14                                   Central European Review of Economics & Finance

   The applied approach makes the measurement of contact center services quality
more comprehensible. The results of the research are of both cognitive and utilitarian
character. The first explain the structure of the construct „quality of services in con-
tact centers”. The second can be used to design contact centers services with a special
attention paid to the matters of quality to fully meet customers’ expectations.
   As further research, it is predicted to compare the achieved results with the results
achieved with the use of other multidimensional exploratory techniques.

References
Anton, J. (1994). Call Center Design and Implementation. Houston: Dame Publications.
Anton, J. (1997). Call Center Management: By the Numbers. Purdue University:
  Ichor Business Books.
Bacher, J. (1996). Clusteranalyse. München: Oldenburg.
Bartsch, S. (2012). Superior Customer Experience in Voice-to-Voice Encounters.
  Munchen: FGM-Verlag.
Bird, J. (1998). Dial O for Opportunity. Marketing, 29 (October).
Bittner, M. (1990). Evaluating service encounters: the effects of physical surroundings
  and employee responses. Journal of Marketing, 54 (April).
Bowen, D. and Lawler, E. (1992). The empowerment of service workers: what, why,
  how, and when. Sloan Management Review, 33.
Broderick, A. and Vachirapornpuk, S. (2002). Service quality in internet banking: the
  importance of customer role. Marketing Intelligence & Planning, 20(6).
Burgers, A., et al. (2000). Customer expectation dimensions of voice-to-voice service
  encounters: A scale development study. International Journal of Service Industry
  Management, 1(2).
Cattell, R. (1944). A note on correlation clusters and cluster search methods. Psycho-
  metrica, 9.
Chen, I., Gupta, A. and Rom, W. (1944). A Study of Price and Quality in Service Op-
  erations. International Journal of Service Industry Management, 5(2).
Dalrymple, J. and Phipps, K. (1999). Call Centres – an Innovation in Service Quality:
  Access is a Quality Issue. In: TQM & Innovation - Proceedings of the 4th Interna-
  tional Conference on ISO 9000 & TQM. Hong Kong Baptist University, Hong Kong.
Deloitte (2013), Global Call Center Survey Results 2013.
Feinberg, R., de Ruyter, K. and Bennington, L. (2005). Cases in Call Center Manage-
  ment. Purdue University: Ichor Business Books.
Gilmore, A. (2001). Call Centre Management: is service quality a priority. Managing
  Service Quality, 11(3).
A. Lotko, Classifying Variables with Cluster Analysis ...                               15

Gore, P. (2000). Cluster Analysis. In: Tinsley, H. and Brown, S. (Ed.). Handbook of Ap-
  plied Multivariate Statistics and Mathematical Modelling. San Diego: Academic Press.
Hill, N. and Alexander, J. (2003). Pomiar satysfakcji i lojalności klientów. Kraków:
  Oficyna Ekonomiczna.
Horowitz, J. (2006). Strategia obsługi klienta. Warszawa: PWE.
Johnson, L., Dotson, M. and Dunlap, B. (1988). Service Quality Determinants and Ef-
  fectiveness in the Real Estate Brokerage Industry. Journal of Real Estate Research, 3(2).
Johnston, R. (1997). Service Quality. Warwick: Warwick Business School.
Kostecki, M. (2002). Call centers i ich pracownicy. In: Call/contact center jako dobre
  narzędzie konkurowania i budowy relacji z klientem. White Paper. Computerworld
  Custom Publishing/IDG Forum.
Kostecki, M. (2006). Efektywność i skuteczność w call center. Warszawa: Moimzdaniem.pl.
Kotler, Ph. (1994). Marketing: Analiza, planowanie, wdrażanie i kontrola. Warszawa:
  Gebethner i S-ka.
Krebs, D., Berger, M. and Ferligoj, A. (2000). Approaching Achievement Motivation –
  Comparing Factor Analysis and Cluster Analysis. In: Ferligoj, A. and Mrvar, A. (Ed.).
  New Approaches in Applied Statistics. Ljubljana: FDV.
Lake, N. and Hickey, K. (2006). Podręcznik obsługi klienta. Gliwice: Helion.
Lotko, A. (2004). Call Center as a Perspective Form of Improving Customer Service
  Quality. Regionalna Ekonomika, 2.
Lotko, A. (2009). Ocena jakości usług w centrach kontaktu z klientem. Warszawa: PWN.
Lotko, A. (2003). Zarządzanie relacjami z klientem. Strategie i systemy. Radom:
  Wydawnictwo Politechniki Radomskiej.
Marr, B. and Schiuma, G. (2001). Measuring and Managing Intellectual Capital and
  Knowledge Assets in New Economy Organisations. In: Bourne, M. (Ed.). Handbook
  of Performance Measurement. London: Gee.
Mazur, A., Jaworska, K. and Mazur, D. (2001). CRM. Zarządzanie kontaktami
  z klientami. Zabrze: MADAR.
Mazurek-Łopacińska, K. (2003). Zachowania nabywców i ich konsekwencje market-
  ingowe. Warszawa: PWE.
Migut, G. (2009). Zastosowanie technik analizy skupień i drzew decyzyjnych do seg-
  mentacji rynku. Kraków: StatSoft.
Parasuraman, A., Berry, L. and Zeithaml V. (1998). A Multiple-Item Scale for Meas-
  uring Customer Perceptions of Service Quality. Journal of Retailing, 64(1).
Rzepecki, W. (2000). Wrota firmy. Businessman Magazine, 9.
Sagan, A. (2003). Analiza rzetelności skal satysfakcji i lojalności. In: Analiza satysfak-
  cji i lojalności klientów. Kraków: StatSoft.
Seth, N., Deshmukh, S. and Vrat P. (2005). Service quality models: a review. Interna-
  tional Journal of Quality & Reliability Management. 22(9).
16                                   Central European Review of Economics & Finance

Sokołowski, A. (1992). Empiryczne testy istotności w taksonomii. Zeszyty Naukowe
  Akademii Ekonomicznej w Krakowie, Kraków.
Staples, W., Dalrymple, J. and Phipps K. (2001). Excellence in Call Centres: Access
  is a corporate responsibility. In: Proceedings of the 6th International Conference on
  ISO 9000 and TQM. School of Business – HKBU, Paisley Business School.
Stefanowicz, B. (2004). Informacja. Warszawa: SGH.
Taylor, S. and Baker, T. (1994). An Assessment of the Relationship Between Service Qual-
  ity and Customer Satisfaction in the Formation of Consumers’ Purchase Intentions.
  Journal of Retailing, 4 (2).
Tryon, R. (1939). Cluster Analysis. New York: McGraw-Hill.
Upal, M. (2008). Telecommunication Service Gap: Call Service Quality Perception
  and Satisfaction. Communications of the IBIMA, 3.
Wallace, C., Eagleson, G. and Waldersee, R. (2000). The sacrificial HR strategy in call
  centres. International Journal of Service Industry Management, 11(2).
Wardaszko, M. (2001). Klient obsługiwany elektronicznie. PC Kurier, 14.
Zeithmal, V. and Bittner, M. (2000). Services Marketing: Integrating Customer Focus
  across the Firm. New York: McGraw-Hill.
CENTRAL EUROPEAN REVIEW
OF ECONOMICS & FINANCE
Vol. 5, No. 2 (2014) pp. 17-34

Izabela Młynarzewska-Borowiec1

              Convergence tendencies
    in the EU Member States – a statistical study
               for the period 1980–2013
                                             Abstract
    The aim of the article is empirical analysis of convergence process in the European Union espe-
cially after extending it by the groups of less developed countries („cohesion” countries after their
accession in the 1980s and Central and Eastern Europe countries after 2004). The econometric
methods, based mainly on regression growth models, are implemented, first of all, to verify the
hypothesis about the existence of beta convergence and its impact on sigma convergence; second-
ly, to verify the theoretically proved statement that capital accumulation become less important
in convergence processes as compared to the increasing role of technological progress. The results
of the investigation point at the existence of beta convergence and its important but decreasing
impact on reducing income disparities among European Union Member States. An additional
survey on the existence of convergence clubs, conducted using the approach based on polynomial
functions, , confirms, that all the analysed countries were approaching the same steady state and
creating a common convergence club.

JEL Classification Code: G10, G15.
Keywords: convergence, economic growth, convergence club, catching-up process.

Introduction
   As early as the mid-eighties of the twentieth century, economic literature started
to challenge the hypothesis of real convergence on a global scale and, therefore,
the existence of the phenomenon of absolute convergence (Baumol, 1986; Dowrick,
Nguyen, 1989; de Long, 1988). Most economists, however, agree with the view on the
existence of convergence of per capita income within countries which differ in initial

1
 Assistant Professor, Ph.D., K. Pulaski University of Technology and Humanities in Radom,
Poland, Faculty of Economics, Department of International Business & Finance.
18 Central European Review of Economics & Finance
capital resources but have identical production functions and levels of savings and
strive for the same „goal”, i.e. a long-term equilibrium called the steady state. These
groups of countries are referred to as convergence clubs.
According to the concept of conditional convergence, a country with low initial
capital resources is characterised by larger increments in income due to a high rate of
return on investment. The increase in income in richer countries with larger capital
resources is lower, leading over time to aligning the income levels in both countries
(Barro, Sala-i-Martin, 1991.1992; Mankiw, Romer, Wail, 1992). It has been theoreti-
cally and empirically proved, however, that this „catching up” (convergence β) does
not guarantee real convergence of income levels in economies in the long term or the
reduction of disparities in the level of development, and therefore, it does not guaran-
tee the so-called convergence σ (Friedman, 1992; Quah, 1993). The differences in the
level of GDP per capita between countries may even increase if during the process of
reaching the steady state random and asymmetric shocks occur (Sala-i-Martin, 1996).
Type β convergence is thus a necessary condition for the existence of convergence σ,
but it is not sufficient. Moreover, theoretically speaking, the assumption about the de-
creasing revenues from capital implies the inability to continuously increase produc-
tion by expanding capital resources. It turns out that in the long run, the importance
of capital accumulation decreases, and the only source of growth of per capita income
is technical progress, thanks to which the economy is able to produce more with the
same capital resources. The existence of convergence is dependent, inter alia, on dif-
ferences in total factor productivity or TFP (Hulten, 2000; Caselli, Tenreyro, 2005).
The convergence of countries to a common steady state and belonging in the con-
vergence club is undoubtedly conditioned by their similar level of economic and
technological development, complementarity of economic structures and institu-
tional interrelationships. Convergence is therefore more likely in integration groups
such as the European Union (Bukowski, 2011). In the history of integration within
the European Union, there are cases of accession of countries that are at a relatively
lower level of economic development, such as the accession of Greece, Spain and
Portugal in the 1980s, or the countries of Central and Eastern Europe in 2004. Taking
into account the above theoretical discussion, the logical consequence of the acces-
sion of this type of countries should be β convergence, which is a gradual process of
„catching up” with relatively richer countries by these countries. Thanks to the pro-
cess of integration in the „underdeveloped” countries, key channels of accelerating
economic growth are opened, i.e. restructuring of the economy, the development of
competition, the influx of technology, investments in infrastructure and the liber-
alisation of trade and the exchange rate regime. These changes manifest themselves
even before the official accession as a result of the so-called integration anchor (Ra-
packi, Próchniak, 2012). The process of „catching up” is also affected by EU poli-
cies focused on reducing disparities in the level of development, reflected in intense
influx of aid funds to relatively less developed countries (Fayolle, Lecuyer, 2000,I. Młynarzewska-Borowiec, Convergence tendencies in the EU ... 19 Beugelsdijk, Eijffinger, 2003).The existence of β convergence within EU Member States may, but does not have to, translate into eliminating development disparities within the group (σ convergence). In addition, the existence of a negative correlation between the initial level of GDP per capita and the average growth rate in a group of integrating countries does not guarantee that each of them „moves” toward the same steady state. It may happen that some of them even show divergence. On the other hand, a positive correlation between both economic values within a group as a whole does not exclude the possibility that some of them show convergence of income, thereby forming a convergence club (Bernard, Durlauf, 1996). The purpose of this paper is to analyse the processes of convergence in the Euro- pean Union (and EEA), taking place especially during the period of expanding the group with countries which are at a relatively lower level of economic development. Particular attention is paid to the processes of growth occurring after the accession of Greece, Spain and Portugal in the eighties of the twentieth century and in the period of preparation and after the accession of CEE countries. The study verifies the exist- ence of type β convergence and its impact on reducing development disparities in the analysed group of countries, i.e. σ convergence. An attempt is also made to check whether in the case of the European Union, the statement, proved on a theoretical basis, about the declining importance of capital accumulation (β convergence) in the creation of convergence processes is confirmed. In addition, by performing appropri- ate tests for the existence of convergence clubs, it is examined whether all Member States follow the same path of growth, striving for the same long-run equilibrium point, hence belonging in the same convergence club. 1. The phenomenon of real convergence of European Union Member States in the different periods of their integration 1.1. Metodology Studies on the convergence processes can be conducted using panel data, average data obtained from 10 or 5-year sub-periods or averaged data for the entire analysed period. The methods mentioned above have advantages and disadvantages (Rapacki, Próchniak, 2012). Taking into account a large number of observations and various methods of es- timation, it may be said that studies based on panel data are more solid. However, from the economic point of view, an analysis that uses that kind of data is distorted by the influence of business cycles and other irregular fluctuations of the economy. A better solution is to use average data for sub-periods. The connection between the initial income and middle- and long run growth processes can be then investigat- ed. The longer the sub-period is (e.g. 10 years), the more reliable the results are from the economic point of view (business cycles, lasting usually less than 10 years, are
20                                   Central European Review of Economics & Finance

eliminated), and less significant from the statistical point of view. Furthermore, the
following method including relatively short 20-year period is difficult to implement.
   Taking into account the method based on average data for the entire analysed
period, one should be aware that a limited number of observations influences the
statistical credibility of the obtained results. However, from the economical point of
view, the mentioned approach seems to be more adequate. It focuses on the long-run
relations between variables, in other words, gives an opportunity to investigate the
relation between initial conditions of economies and their long-run growth pro-
cesses. In research based on average (thus stationary) data, the simple linear regres-
sion model and the classical least squares method of estimation can be implemented.
   The study of real convergence of the European Union Member States in the dif-
ferent periods of their economic integration, used the two most popular measures
of real convergence, β convergence and type σ convergence.
   The easiest way to verify the hypothesis of conditional β convergence is estimating
the structural parameters of the following equation:
                      1   Y
                        ln T = α 0 + α 1 ln Y 0 + ε                               (1)
                      T   Y0
   The left side of the equation represents the average growth rate of GDP per capita
between the period T and the base period 0. The explanatory variable is the loga-
rithm of the initial level of per capita income. The negative value of the parameter
α1 means the occurrence of convergence, whose rate is reflected by the coefficient β
defined by the following formula:
                                    1
                            β = −     ln( 1 + α 1 T )                             (2)
                                    T
   The higher the coefficient β value (between 0 and 1), the higher the convergence
rate (Barro, Sala-i-Martin, 2003; Próchniak, 2006).
   Due to the fact that the β convergence can be treated as one, but not the only,
determinant of the convergence process manifested by a reduction in disparities
in GDP per capita of a certain group of countries, i.e. σ convergence, it appears
reasonable to investigate the existence and the rate of this type of convergence in
the analysed group of countries. A relatively simple way to verify the σ convergence
hypothesis is to estimate the trend lines for the difference levels of income between
countries (measured by the standard deviation of the GDP per capita logarithm):
                        sd (ln Y T ) = α   0   + α 1t + ε                         (3)
   A negative α1 coefficient value (ranging from -1 to 0) indicates the occurrence of
σ convergence.
   The above mentioned formulas were used to conduct a study of real convergence
in a group of 15 (in the period 1980- 2004) and 27 (in the periods 1993- 2004 and
I. Młynarzewska-Borowiec, Convergence tendencies in the EU ... 21
2004-2013) European Union Member States. Data on GDP per capita in the Member
States was obtained from the International Monetary Fund World Economic Outlook
Database, 2014 (data in USD, current prices).
1.2. Beta convergence of European Union Member States – results
The analysis of the process of „catching up” (type β convergence) among the Eu-
ropean Union Member States was conducted for several periods. This is due to the
EU expansion (and earlier EEC) to other countries and the associated difficulties in
providing a general overview of convergence in the group. The first studied period
covers the years 1980-2004, starting with the accession of the relatively less devel-
oped Greece, then Spain and Portugal, and ends before the accession of the next
group of countries with relatively lower GDP per capita, i.e. the countries of Central
and Eastern Europe. The second area of analysis relates to the period 1993-2013 and
is associated with the preparation of the above group of countries for the accession,
i.e. after signing association agreements (sub-period 1993-2004) and their function-
ing in the EU as Member States (sub-period 2004-2013).
The results in Table 1 confirm the existence of a negative correlation between the
initial level of wealth and the growth rate of GDP per capita of the EU Member States
(EEC) of that time, and therefore, the β type convergence in the period 1980-2004.
Greece, Spain and Portugal, which at the time of accession had approximately half
the level of GDP per capita compared to the average for the EU-15, in the analysed
period approached the most developed EU countries at a rate of about 2% per year.
Analysing, on the other hand, the European Union after 1993, i.e. including the then
candidate countries, a much faster pace of „catching up” (3.5%) may be observed.
CEE countries, which in 1993 were characterised by significantly lower than those
„cohesion countries” GDP per capita of only about 30% of the average level of this
ratio for the whole group, showed a high rate of developmental catching up, which is
fully compatible with the concept of convergence arising directly from Solow’s model
(1956). The process of „catching up” was particularly evident within the EU-12. These
countries, during the period 1993 – 2013, were drifting towards a common steady
state at a rate of 5.2%. This observation confirms the validity of the concept of con-
ditional convergence, and therefore the importance of homogeneity of countries in
shaping the convergence processes and their dynamics.
For a more detailed analysis of the convergence process, which, as has been proved
above, took place in the European Union after 1993, new models were constructed
for the EU-27 and EU-12 in the periods 1993-2004 and 2004-2013. Results of the
estimation and evaluation of the quality of the models are presented in Table 2.
Generally, the official membership of the so-called „new” EU Member States,
whose accession took place in 2004 and 2007, did not significantly influence their
catching up process in terms of developmental distance to both the richest countries
in the Union and to one another. The rate of convergence in the EU-27 and EU-1222 Central European Review of Economics & Finance
after 2004 was even lower than in the period of intensive preparation of the CEE
countries for the EU membership.
Table 1. Estimation results of growth regression models describing absolute conver-
gence β among the European Union Member States (EU-15, EU-12, EU-27)
in the period 1980-2013; dependent variable: ln (Yt / Y0)/ T; classical least
squares method estimation
EU-15 EU-27 EU-12
Variable / model diagnostics
1980-2004 1993-2013
constant 0,20101 0,29035 0,342989
stand. error 0,0466337 0,0190009 0,030827
Student’s t 4,3104 15,2809 11,1262
p value 0,00085I. Młynarzewska-Borowiec, Convergence tendencies in the EU ... 23
Table 2. Estimation results of growth regression models describing absolute conver-
gence β among the European Union Member States (EU-27, EU-12) in the
period 1993-2013; dependent variable: ln (Yt / Y0)/ T; classical least squares
method estimation
EU-27 EU-12
Variable / model diagnostics
1993-2004 2004-2013 1993-2004 2004-2013
constant 0,368147 0,338949 0,405581 0,419077
stand. error 0,055004 0,0636833 0,0547132 0,0608094
Student’s t 6,6332 5,3224 7,4128 6,8917
p value24 Central European Review of Economics & Finance
EU countries capital accumulation ceases to be the main cause of convergence and
its place is gradually overtaken by changes in total factor productivity (TFP). The
above hypothesis is confirmed by the fact that significantly lower coefficient β was
observed in the EU-15 and the entire EU-27.
The diagnostic tests of individual models included in Table 1 and Table 2, i.e.
the F-Snedecor test and White's test for heteroscedasticity 2, allow to consider them
sufficient in studying the phenomenon of convergence. Also satisfactory values of
determination coefficients were obtained (R2 and adjusted R2).
1.3. Sigma convergence of European Union Member States – results
In light of the results of the study on the existence of σ convergence presented in
Table 3, it can be concluded that developmental disparities between Member States
decreased during the analysed 34-year period of the operation of the group.
Negative values of the structural parameters of the time variable t in each of the
estimated equations indicate a gradual decrease in the standard deviation of the
logarithm of per capita GDP in the analysed groups. Neutralising developmental
differences was particularly evident in the expanded European Union (EU-27) and in
the group of the „new” Member States. It was observed to a much lesser extent in the
„former fifteen”. Therefore, in the case of the European Union one can observe a clear
correlation between the rate of „catching up” and type σ convergence. A higher rate
of β convergence translates into faster reduction of the disparities in income per
capita in the analysed groups of countries and vice versa.
Table 3. Estimation results of models describing sigma convergence among the Euro-
pean Union Member States (EU-15, EU-27, EU-12) in the period 1980-2013;
classical least squares method estimation
Variable / model diagnostics EU-15 EU-27 EU-12
Dependent variable sd_UE_15_1980_2004 sd_UE_27_1993_2013 sd_UE_12_1993_2013
constant 0,457403 1,17749 0,874513
stand. error 0,00814288 0,0181603 0,0115022
Student’s t 56,1722 64,8386 76,0299
p valueI. Młynarzewska-Borowiec, Convergence tendencies in the EU ... 25
Table 3 continued.
Variable / model diagnostics EU-15 EU-27 EU-12
F- Snedecor’s test1
F- statistic 77,52050 360,7705 648,0133
critical value 4,27934 4,41387 4,41387
p value 7,97e-09 2,34e-13 9,34e-14
result rejection of H0 rejection of H0 rejection of H0
White’s test2
test’s statistic 5,07429 8,30839 7,17272
critical value 5,99146 9,21034 9,21034
P value 0,0790919 0,0156985 0,0276989
result acceptance of H0 acceptance of H0 acceptance of H0
Adjustment of models
R2 0,771191 0,952478 0,977376
Adjusted R2 0,761243 0,949838 0,975868
Convergence analysis
Sigma convergence yes yes yes
Number of observations 25 21
1 – F-Snedecor’s test: H0: α1 = α1 = ...... = αk ; rejection of hypothesis H0 indicates that the
estimated model includes significant variables.
2 – White’s test: H0: random component is homoscedastical; acceptance of the hypothesis H0
indicates the existence of homogeneousness of variance.
3 – calculated according to formula (2).
Source: own calculations using GRETL software.
The study achieved high significance of the structural parameters. Diagnostic tests
included in Table 3 indicating a relatively good quality of the models allow to con-
sider the adopted method of testing this type of convergence as sufficient.
2. Test on the existence of convergence clubs among European Union
Member States in the different periods of their integration
The concept of convergence clubs refers to the notion of the existence of the mul-
tiple equilibria in the global or regional range. Similar countries converge in the
long–run towards each other and their initial conditions move towards the same
stationary equilibrium (Galor, 1996). The cross-country regressions, implemented
above, do not account for the existence of multiple equilibria. If we estimate a nega-
tive correlation between the average growth rate and initial GDP per capita, it’s im-
possible to know if all the countries are converging (and creating a convergence club)
or only some of them. Moreover, the conducted study on sigma convergence in UE
Member States concerns the analysis of income dispersion mostly by looking at the26 Central European Review of Economics & Finance
development of income standard deviation over time, not at the relative income
levels. The hypothesis of the convergence club can be more efficiently tested using
nonparametric methods, e.g. introducing polynominal functions in the growth equa-
tion (Chatterji,1992; Quah, 1996).
2.1. The model of convergence clubs- an approach based on polynominal functions
To test the existence of the convergence club among the EU Member States the ap-
proach of Chatterji and Dewhurst (1996) has been implemented. The starting point
of the model construction is the following equation proposed by Barro and Sala-i-
Martin3 (1995):
൬ ൰ െ ൬ ൰ ൌ ୧ ൬ ൰ ɂ (4)
୧ǡ୲ ୧ǡ୭ ୧ǡ୭
In the model constructed by Chatterji and Dewhurst, the development of income
dispersion is analysed by determining all variables in equation (4) as gap forms by
subtracting all the logarithmic levels from the maximal level and rearranging the
same year gaps to the same side (equation 5).
൬ ൰ െ ൬ ൰ ൌ ሺͳ ሻ ቈ ൬ ൰ െ ൬ ൰ ɂ (5)
୫ୟ୶ǡ୲ ୧Ǥ୲ ୫ୟ୶ǡ୭ ୧ǡ୭
Ln (Y/L)max,t and ln(Y/L)max,0 are GDP per capita in the richest country in the ter-
minal year t and the initial year 0. Ln (Y/L)i,t and ln(Y/L)i,0 are GDP per capita in all
other economies in the terminal year t and the initial year 0, respectively. To model the
possibility of multiple equilibria, Chatterji and Dewhurst included in the above equa-
tion variables measuring wideness of the gap between the initial income of the „leader”
country and that of the country i. Describing this gap as GAPGDP = ln(Ymax) – ln(Yi),
the convergence model can be written as:
୩
୩
ୋୈǡ୲ ൌ ୩ ൫ ୋୈǡ ൯ ɂ (6)
୩ୀଵ
The number of convergence clubs will depend on the value of k. When k=3 a cubic
function is taken into account that stands for two mutually exclusive convergence
clubs. The convergence model is the following:
ଶ ଷ (7)
ୋୈǡ୲ ൌ ଵ ൫ ୋୈǡ୭ ൯ ଶ ൫ ୋୈǡ୭ ൯ ଷ ൫ ୋୈǡ୭ ൯
3
where: ai = xi + (1 – e-β) ln (y*i + xi,o); b = –(1 – e-β); xi – the speed of technological process, y*-steady
state point, β – the speed of beta convergence.I. Młynarzewska-Borowiec, Convergence tendencies in the EU ... 27
In the equilibrium of function (7) the gap is constant (GAPGDP,t = GAPGDP,0). There-
fore, three possible equalibria exist4 and two different cases may appear (see Fig. 1).
A11
Figure 1. Possible convergence clubs: case A11
Source: own work.
If A1 1, the only one stable equilibrium is E2. All countries that
have an income gap with the „leader” below the E3 level E3 converge to the E2 level E2.
Countries with the initial gap between E2 and E3 actually also converge to the „lead-
er” country. In turn, countries that have a gap between E1 and E2 diverge from the
„leader”, similarly to the economies with the gap greater than E 3. The last group of
countries diverges from all other economies.
2.2. Results
To test the existence of a convergence club among the EU Member States in the
different periods of their integration the following equations are estimated:
ൌ ൫ ൯ ൫
ଶ
൯ ൫ ൯
ଷ (8)
ୋୈǡଶସ ଵ ୋୈǡଵଽ଼ ଶ ୋୈǡଵଽ଼ ଷ ୋୈǡଵଽ଼
4
in the points where function (7) line cuts 45 degree line (benchmark line).28 Central European Review of Economics & Finance
ଶ
ୋୈǡଶଵଷ ൌ ଵ ൫ ୋୈǡଵଽଽଷ ൯ ଶ ൫ ୋୈǡଵଽଽଷ ൯ ଷ ൫ ୋୈǡଵଽଽଷ ൯
ଷ (9)
ଶ
ୋୈǡଶସ ൌ ଵ ൫ ୋୈǡଵଽଽଷ ൯ ଶ ൫ ୋୈǡଵଽଽଷ ൯ ଷ ൫ ୋୈǡଵଽଽଷ ൯
ଷ (10)
ଶ
ୋୈǡଶଵଷ ൌ ଵ ൫ ୋୈǡଶସ ൯ ଶ ൫ ୋୈǡଶସ ൯ ଷ ൫ ୋୈǡଶସ ൯
ଷ (11)
Equation (8) tests the existence of a convergence club within „the former UE-15”
in the period 1980- 2004. The gap variable (for the year 1980 and 2004) was formed
by taking a natural logarithm of GPP per capita in the leader country (in that case
Luxembourg) over the GDP per capita in each other country. Models (9), (10) and
(11) test the club convergence of 27 members of the EU (respectively in the periods
1993-2013, 1993-2004 and 2004- 2013). The gap variables in the analysed year t and
initial year 0 were constructed with Luxembourg as a benchmark country. The ob-
tained results of the regressions are included in table 4. Each row of the table reports
the coefficients, t-statistics, the fit of the regression and the equation standard errors.
Table 4. Convergence clubs in the European Union from 1980 to2013 (classical least
squares method estimation)
A1 A2 A3 F-statistic R2
Model GAPGDPt GAPGDPo (stand. error) (stand. error) (stand. error) (p value) Corr. R2
Student’s t Student’s t Student’s t
(8) GAPGDP2004 GAPGDP1980 2,8902*** -3,11322*** 1,1383** 72,1423 0,9516
(0,4592) (0,8877) (0,3916) (1,61e-07) 0,9428
6,2944 -3,5072 2,9069
(9) GAPGDP2013 GAPGDP1993 1,6881*** -0,5263*** 0,0640*** 610,7661 0,9876
(0,1189) (0,0924) (0,0167) (4,65e-22) 0,9865
14,2019 -5,6960 3,8236
(10) GAPGDP2004 GAPGDP1993 1,14319*** -0,137537* 0,0089* 498,2717 0,9848
(0,1408) (0,1095) (0,0198) (4,67e-21) 0,9835
8,1166 -1,2562 0,4484
(11) GAPGDP2013 GAPGDP2004 1,60713*** -0,50026*** 0,0820067*** 1823,991 0,9958
(0,09364) (0,09582) (0,02303) (1,76e-27) 0,9955
17,1625 -5,2208 3,5607
***/**/* statistically significant at the level of 1%, 5%, 10%
Source: own calculations using GRETL software.
Based on a preliminary analysis of the results, it can be concluded that in the case
of the EU Member States at different stages of integration, there exists one steady
state (values of A1 coefficients for each of the estimated equations are higher than 1)
to which the analysed countries converge or (possibly) from which they diverge.
A graphical interpretation of the results broken down by sub-periods is shown below.You can also read