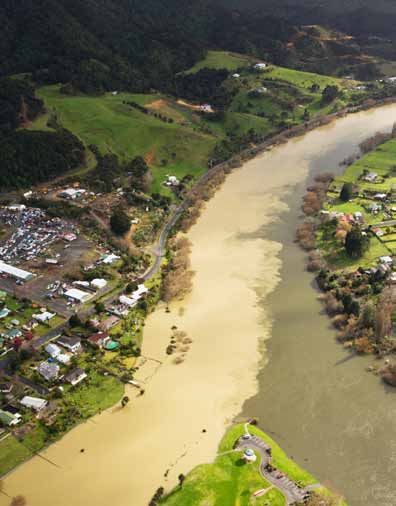
Water quality in New Zealand: Understanding the science March 2012
←
→
Page content transcription
If your browser does not render page correctly, please read the page content below
1

Water quality in New Zealand:
       Understanding the science

                       March 2012
2

    Acknowledgements
    The Parliamentary Commissioner for the Environment would like to express her
    gratitude to those who assisted with the research and preparation of this report,
    with special thanks to her staff who worked so tirelessly to bring it to completion.

    Photography
    Cover: Erin Currie
    This document may be copied provided that the source is acknowledged.

    This report and other publications by the Parliamentary Commissioner for the
    Environment are available at: www.pce.parliament.nz
3

Contents

Commissioner’s overview                                        5

1    Introduction                                              9    3
     1.1   Purpose of the report                               10

     1.2   Structure of the report                             10

     1.3   What the report does not cover                      11

2    The story of water quality in New Zealand                 13

     2.1   Settlement of New Zealand                           13

     2.2   Town sewage causes disease and death                14

     2.3   Deforestation leads to erosion and flooding         15

     2.4   Factories, towns, and farms raise nutrient levels   18

     2.5   Recent developments                                 20

3    Pathogens                                                 21

     3.1   How pathogens get into water                        22

     3.2   What pathogens do in water                          23

     3.3   Measuring pathogens in water                        24

4    Sediment                                                  25

     4.1   How sediment gets into water                        26

     4.2   What too much sediment does in water                27

     4.3   Measuring sediment in water                         29

5    Nutrients                                                 31

     5.1   How nutrients get into water                        31

     5.2   What too many nutrients do in water                 32

     5.3   Measuring nutrients in water                        37
6 Natural vulnerability to water pollution 39
6.1 Lakes are especially vulnerable 40
6.2 Rivers and streams have varying vulnerability 41
6.3 Wetlands and estuaries have some resilience 45
6.4 Aquifers can trap and accumulate nitrate 47
4 6.5 Summarising vulnerability 48
7 Protecting and improving water quality 49
7.1 Reducing end-of-pipe pollution 50
7.2 Reducing diffuse pollution 53
7.3 Dealing with trapped pollutants 56
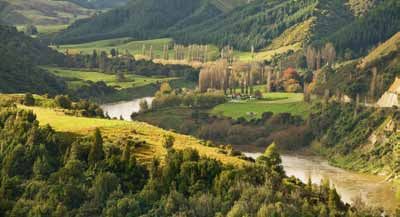
8 A case study: The Manawatū River 57
8.1 The catchment of the Manawatū 57
8.2 Water quality in the past 59
8.3 Water quality today 60
8.4 The worst river in the Western world? 66
9 In conclusion 69
9.1 Revisiting the three big pollutants 69
9.2 Vulnerability matters 70
9.3 Protecting and improving water quality 71
9.4 Thinking through water quality problems 71
9.5 Illustrating the approach 74
9.6 A final comment 75
Glossary 77
Notes 83
References 89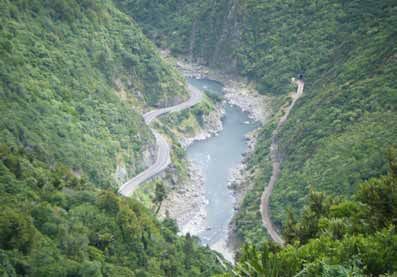
5

Commissioner’s overview

When Parliament appointed me to the position of Environment Commissioner five
years ago, I came into the job knowing a great deal about some environmental
matters and relatively little about others. Water quality was one area in which I had
to work rapidly to come up to speed. I clearly recall an evening with Professor David
                                                                                        5
Hamilton from the University of Waikato when he patiently did his best to give me
a rapid grounding in the basic science.

In 2010 I had the rewarding experience of speaking about water quality science
to Members of Parliament. A request from several MPs for more led to developing
greater expertise within my office on water quality and eventually to this report.

The aim of this report is to provide a guide to water quality science covering those
aspects which are most useful for the many New Zealanders who are engaged in,
and concerned about, this high profile environmental issue. Water quality science is
indeed complicated, much is unknown, and the devil often really is in the detail.

There is effectively no limit to the different aspects of water quality that could be
covered, so this report is not intended as a complete reference on the subject. Its
scope is confined to fresh water – in rivers and streams, lakes, wetlands, estuaries,
and aquifers – and to the three main water pollutants of greatest concern in New
Zealand. These three are pathogens, sediment, and nutrients.

Pathogens are invisible microbes that cause disease and obviously deserve being
labelled pollutants. But sediment and nutrients are only water pollutants by virtue
of being in the wrong place. They belong on the land, not in water.

Too much soil and rock washed off land become destructive sediment in water.
Nutrients, specifically phosphorus and nitrogen, should also stay on the land
helping plants grow there rather than in water. We want fertile land not fertile
water.

In a 2011 interview, the incoming President of Federated Farmers, Bruce Wills, was
described as keen to have a frank science-based discussion with the nation about
dairy pollution. “If we’ve got a dirty river let’s understand why it’s dirty and what
science can tell us about fixing it…” 1

I strongly agree with Mr Wills. He has put his finger squarely on the value that
science can provide – understanding cause-effect relationships. And because water
quality is an issue of such widespread public concern, this understanding must also
be widespread.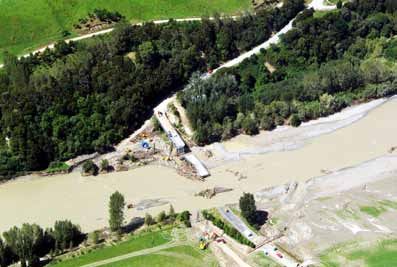
In this report we have sought to go beyond providing lists of sources of water
    pollutants and their damaging effects. The aim is more ambitious – to explain as
    simply as possible why a particular pollutant causes certain effects – and therefore
    lay a basis for how well a particular intervention might improve or protect water
    quality.

    I was interested to learn, for example, about a key difference between nitrate and
6   phosphate – the main forms in which the nutrients nitrogen and phosphorus occur
    as water pollutants. Nitrate is very soluble in water, but phosphate most often is
    not. One intervention aimed at preventing nutrients from moving off land into
    water is a riparian strip – a fenced margin along banks covered with plants that will
    take up nitrogen and phosphorus as they grow. In general, riparian strips are much
    better at reducing phosphate than nitrate because nitrate can elude the roots of
    the plants and travel through groundwater directly into the waterway.

    Concerns over the impacts of nutrients on water quality have grown over recent
    years, but we should not delude ourselves that all has been well in the past.
    Decades of burning of forested hills to create pasture for sheep farming is largely
    responsible for the widespread erosion that continues to carry sediment into our
    rivers and lakes. And while dairy cows are the greatest source of nitrate in many of
    our catchments, sediment from erosion is the greatest source of phosphate. While
    on the subject of phosphate, city dwellers concerned about water quality should be
    aware they can do their bit by switching to phosphate-free detergents and laundry
    powder.

    It is a truism that to be effective, water quality policy and action must be based on
    science. But what does that actually mean? I think it means the following:

        •   Measuring the different parameters of water quality

        •   Understanding the causes of change in those parameters

        •   Designing interventions that are likely to be effective

        •   Measuring the effectiveness of those interventions

    In 1911, there was an outbreak of typhoid among workers in flax mills in the
    Manawatū. The cause was deemed to be the rancid water coming out of the mills,
    but it was actually the sewage from the town of Feilding. While this mistake is not
    one we would make today, we are still capable of wrongly linking cause and effect.
    And once that is done, we cannot design interventions that will be effective.

    We need, however, to know when more science is not needed. A call for more
    science to be done can sometimes be a way of delaying difficult decisions. There
    is, for example, no need for more scientific data or modelling to establish the link
    between the land use change that has taken place in the Waituna catchment
    in Southland and the dire state of the Waituna Lagoon; there simply is no other
    explanation.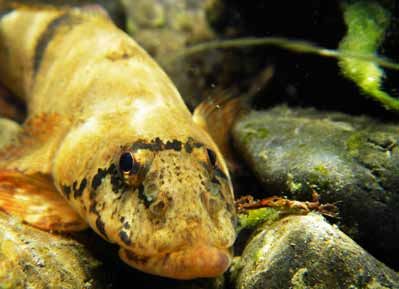
7

Scientists themselves are not always the best people to advise when more science
is required – their basic motivation quite rightly is to continue to explore and gather
new data.

While science is necessary for policy, it is not sufficient. Science does not tell us
how to make trade-offs, and trade-offs will almost certainly be needed. It is very
unlikely that we can have our cake and eat it too. Even if technical fixes were to
become available for dealing with all our water quality problems, they would still        7
cost a great deal of money.

As the writing of this report draws to a close, I am aware that my own knowledge
of the science of water quality has increased hugely since my presentation to
Members of Parliament in 2010. There is no end to the complexity, but the state
of our rivers, lakes, wetlands, estuaries, and aquifers is of great importance to
this clean green country of ours. Increasing our understanding is a worthwhile
investment and will pay dividends for our children and grandchildren.

Dr Jan Wright
Parliamentary Commissioner for the Environment
8
9

1
Introduction

Water sculpted New Zealand. Over millennia, water and ice literally moved
mountains, moulding the land. Mountains rose, but water ground them down. But
for the power of water, the Southern Alps would today be five times the height
of Aoraki Mount Cook. Water eroded peaks, carved valleys, and flushed rock
downstream.

Stones and silt washing down from the hills filled in valley floors, expanded plains,
and built up beaches. Floodwater flushed away sediment, leaving water clean
and clear most of the time. Nutrients also washed down, fertilising the lowlands.
Productive and habitable, these are the places where most people now live and
grow food.

Stony-bedded streams predominated, providing cracks and crevices for fish and
other creatures to shelter, breed and feed, and for native plants to find root. The
forest-cloaked land shaded the water’s edge. Clean, clear, and cool fresh water,
abundant in food, greeted arriving Māori.

Today’s reality is very different – and different for entirely understandable reasons.
For the last century and a half, a great range of economic enterprises have changed
most of the land and the water that flows through it.

Over the years there has been much progress in controlling pollutants entering
water. Many practices that were acceptable in the past would be inconceivable
now. Nevertheless, in the last decade, public concern about water quality has
become very high and for good reason.

This report is aimed at increasing understanding of the cause-effect relationships
that determine the quality of fresh water – in rivers and streams, in lakes, in
wetlands, in groundwater and aquifers, and the catchments within which they sit.
Estuaries also feature since this is where fresh water meets the sea.

The focus is on the three main pollutants of fresh water in New Zealand –
pathogens, sediment, and nutrients. Pathogens make people and animals sick.
Sediment makes clear water murky and blankets stony riverbeds with mud and
silt. Excess nutrients (nitrogen and phosphorus) can lead to rampant weed growth,
algal blooms, and oxygen depletion.

There are other pollutants in water, of course, including heavy metals, toxic
chemicals and pesticides. Much, but not all, is a legacy of past industry. But from a
national perspective, the big three are pathogens, sediment, and nutrients.
Chapter 1 – Introduction

                 A knowledge of the science of water quality provides a basis for understanding
                 where the pollutants come from, how they get into water, and what they do to the
                 water. Relying on perceptions can be very misleading. For example, water that is
                 stained brown from naturally occurring tannins appears polluted, but clear water
                 polluted with pathogens appears clean when it is not.

                 A knowledge of the science of water quality also provides a basis for understanding
10               how effective different ways of improving water quality might be. To a considerable
                 extent, pollutants that get into water from the end of a pipe have been dealt with
                 although there is still some way to go – the pollutants are easy to measure and the
                 responsibility is clear. In contrast, diffuse sources by their very nature come from
                 wide areas and are therefore much more troublesome; the sediment that is washed
                 into lakes and the nitrate that seeps into groundwater are the most intractable.

     1.1         Purpose of the report
                 The Parliamentary Commissioner for the Environment is an independent Officer
                 of Parliament, with functions and powers granted by the Environment Act 1986.
                 Her role allows a unique opportunity to provide Members of Parliament with
                 independent advice in their consideration of matters that may have impacts on the
                 quality of the environment.

                 Water quality is a subject of high public concern and vigorous debate. However,
                 the science of water quality is very complex, and much of the information available
                 required to fully understand it is highly technical. This report is an educative one,
                 written with the intent of providing an accessible guide to the science, in order to
                 support informed debate and decision-making.

                 This report has been produced pursuant to s16(1)(f) of the Environment Act 1986.

     1.2         Structure of the report
                 The remainder of this report is structured as follows:

                 •    Chapter 2 outlines the history of water quality in New Zealand in order to
                      provide the wider context in which this report is placed, including how the
                      concerns around water quality have changed over time

                 •    Chapters 3, 4, and 5 cover the three main pollutants in turn – pathogens,
                      sediment, and nutrients. The sources of each pollutant, the impacts each has
                      on water quality, and how they are measured are described

                 •    Chapter 6 explores the reasons why some water bodies are more vulnerable to
                      the impact of pollution than others. The greater the natural vulnerability of a
                      body of fresh water, the greater the impact of human activities

                 •    Chapter 7 describes methods that are being used to protect and improve water
                      quality

                 •    Chapter 8 is a case study of the Manawatū River, using it to illustrate much of
                      what is covered in earlier chapters

                 •    Chapter 9 begins with a summary of the main points and then presents a series
                      of questions that can be used for considering particular water quality problems
11
1.3 What the report does not cover
This report is about understanding the science of water quality. It is not an analysis
of water policy or water management. And unlike previous investigations, the
Commissioner does not make specific recommendations.
The report is written at a high level, and every effort has been made to ensure that
it is sufficiently accurate for its purpose. The following aspects are therefore not
11
discussed in any detail:
• Pollutants other than pathogens, sediment, and nutrients
• An analysis of what values might be placed on fresh water, including Māori
spiritual values
• Water scarcity and allocation including water storage for irrigation, except to
note that taking water out of a river increases its vulnerability to pollution
• The state of the water in any water body, except in the case study of the
Manawatū
• Standards, guidelines, limits, and targets for water quality
• Governance, legislation, policy or regulation
Source: Wanganui District Council
Figure 1.1: Canoeing the Whanganui river12
13

      2
      The story of water quality in New Zealand

      This is the story of how pathogens, sediment, and nutrients have affected New
      Zealand fresh water, and how society has responded over the years. A range of
      other pollutants like heavy metals have also polluted water, but this chapter focuses
      on the three pollutants that were, and are, the most significant and widespread.

      Since European settlement, each of these three pollutants has taken a turn at
      dominating public concern for water quality. In the late nineteenth century,
      pathogens were the scourge of early New Zealand towns. By the early twentieth
      century, sediment rose to the fore after decades of deforestation accelerated
      erosion and worsened flooding. And later that century, nutrients from factories,
      towns, and farms emerged as the latest challenge alongside the legacy of erosion.

2.1   Settlement of New Zealand
      For Māori, water is a taonga – a treasure. Māori identify themselves in terms of
      their rivers and mountains, along with their ancestors. For instance, someone from
      Ngāti Porou might say “Ko Waiapu tōku awa” – The Waiapu is my river. Whanganui
      iwi identify themselves so strongly with their river that they say:

                                   E rere kau mai te Awanui
                              Mai i te Kahui Maunga ki Tangaroa
                               Ko au te awa, ko te awa ko au

                                     (The Great River flows
                                 From the Mountains to the Sea
                              I am the River, and the River is me)2

      Rivers provided routes through the mountains, and freshwater food including tuna,
      kākahi, and kōura (eels, mussels, and crayfish), as well as edible plants. Māori
      living or travelling away from the coast relied heavily on these resources. Given the
      importance of fresh water as a source of food, it is not surprising that Māori still
      have a particularly strong aversion to sewage pollution.
Chapter 2 – The story of water quality in New Zealand
Early Māori burnt very large areas of forest, mainly to encourage edible plants
and to make travel easier. This increased natural erosion, affecting rivers and
lakes, especially in places like the South Island high country, where forest failed to
regenerate.3
European settlers had a very different relationship to water than Māori and feared
rivers for their power. They did not understand how quickly New Zealand rivers
14 could rise after heavy rainfall, and drowning became known as ‘the New Zealand
death’.
Europeans set out to ‘tame’ the land, leading to widespread impacts on water
quality.
2.2 Town sewage causes disease and death
Town populations in the new colony grew rapidly, and so did their sewage. Urban
streams soon became polluted by human and animal waste containing pathogens
that caused disease and death.
In 1862, one out of every three people living in the gold rush boom town of
Cromwell was infected by typhoid. Two years later Dunedin’s mortality rate
matched the unhealthiest English towns due to poor sanitation. The Otago Daily
Times wrote:
Dunedin is allowed to remain a city which invites pestilence; every sanitary
precaution is neglected; its streets and the surroundings of its dwelling
houses reek with impurity and filth – its inhabitants imbibe poison in the
water they drink…4
Sewage washed into the grounds of Parliament in the 1860s and no well, tank
or stream in crowded parts of Wellington was safe to drink.5 In Auckland, the
channelled stream running down Queen Street was described as “a pestiferous
ditch, the receptacle of every imaginable filth, bubbling in the noonday sun”.6
In response, two laws – the Public Health Act 1872 and the Municipal
Corporations Act 1876 – led to the creation of town sewage and water supply
systems. Collecting ‘night soil’ for disposal replaced backyard cesspits. Eventually
underground sewers replaced open drains and flushing toilets replaced backyard
privies.
Early responses were far from perfect. In Auckland in the 1890s human waste
collected from cesspools and privies was emptied just above the city’s clean water
source at Western Springs.
Unsurprisingly, separating waste water from drinking water led to dramatic health
improvements in cities and towns. Today, typhoid no longer haunts our cities, but
pathogens from town sewage systems and untreated animal effluent continue to
cause illness.15
15
Source: Otago Witness 1906
Figure 2.1: The Dunedin Drainage Board lays sewage pipes in 1906.
2.3 Deforestation leads to erosion and flooding
European settlers deforested vast areas, particularly in the North Island, in a quest
for minerals, timber, and pasture. Over time this caused severe and widespread
erosion, sedimentation, and flooding.
Mining took off following the Otago gold rush in the 1860s. Digging, crushing
rock, and sluicing created a lot of sediment. The effects on erosion and water
quality were immediate and severe, but localised. Later, vast quantities of toxic
sediment containing cyanide were dumped into the Ōhinemuri River, authorised by
the Mining Act 1891.7
Coal mining initially had little impact on water quality compared with mining
for gold and other metals. Acid mine drainage became more significant as large
opencast coal mines on the West Coast of the South Island expanded in the
1990s.8Chapter 2 – The story of water quality in New Zealand
As early as 1840, timber was exported to England and Australia. Extensive areas of
kauri in the north fell to giant saws, and lowland forests of rimu, kahikatea, mataī,
and tōtara followed.
However, by the end of the nineteenth century, pasture for livestock became the
primary pressure on forests. Tussocks had already been burned off much of the
South Island high country to create grazing for great flocks of Merino sheep. In
16 1882, the Dunedin departed for England carrying the first shipment of frozen meat.
With the ability to sell far more meat than the population of young colony could
consume, pasture became more valuable than timber. Forests were burned and
grass seed scattered among the stumps. With the advent of refrigeration, freezing
works and dairy factories proliferated.
Source: Tyree Collection, Alexander Turnbull Library, Wellington
Figure 2.2: Sluicing to separate gold from gravel washed large amounts of
sediment into rivers. Gold mining on the Rocky River, near Collingwood in
Golden Bay.17
From the early twentieth century, the government drained massive areas of lowland
wetlands for conversion into pasture, passing enabling legislation and carrying out
the works. It took 25 years to drain the 36,000 hectares of wetlands on the Hauraki
Plains.9 The light, odourless kahikatea wood cleared from the swamps was turned
into butter and cheese boxes.
‘Breaking in’ hill country blocks granted to returning soldiers led to further erosion,
but often failed to create productive farmland. Governments continued to subsidise 17
the clearance of erosion-prone land until the 1980s.
By the 1930s, the lowland forests and swamps that had once absorbed floodwaters
were largely gone. Rivers in flood spilled across land, lives and homes were lost, and
soils were washed away or buried in mud. The risk of further flooding increased as
sediment built up in rivers.
Source: Northwood Collection, Alexander Turnbull Library, Wellington
Figure 2.3: Two settlers sow grass seed among the stumps of cut-over
forest in Northland.
Concern at the damage from flooding spurred authorities into action. The Soil
Conservation and Rivers Control Act 1941 led to the creation of 17 catchment
boards across the country, the forerunner of today’s regional councils. Reforesting
steep slopes, removing stock, and controlling deer and possums all helped conserve
soil. Constructing stopbanks, straightening and deepening river channels, and
planting river banks helped control rivers.
The historical legacy of deforestation, erosion, and sediment has irreversibly
changed most catchments. The struggle to keep the soil on the hills and the water
in the rivers is far from over.Chapter 2 – The story of water quality in New Zealand
18
Source: Bloomfield Collection, Alexander Turnbull Library, Wellington
Figure 2.4: The Mōhaka River in flood, 1938. Floods in Hawke’s Bay in the
1930s buried floodplains in silt, destroyed bridges, and killed 21 workers at
a railway camp.
2.4 Factories, towns, and farms raise nutrient levels
In the years following the Second World War, New Zealand’s economy grew rapidly
and the pressure on fresh water from factories, towns, and farms increased. The
nutrients nitrogen and phosphorus became new pollutants of concern.
Factory wastes had been a problem since European settlement. Milling flax,
scouring wool, and tanning hides produced large volumes of pungent, nutrient-rich
wastewater, and rivers were a convenient method of disposal.
Freezing works and other animal processing plants discharged wool, fat, blood, and
guts into water, sometimes resulting in mats of bacteria called ‘sewage fungus’.
Sewage fungus uses up dissolved oxygen as it grows, and in severe cases, these
bacterial mats led to oxygen levels so low that significant fish kills occurred.
Town sewage schemes led to great gains in public health, but the outfall had to be
put somewhere and rivers were often convenient. While the treatment of sewage
gradually improved, some urban streams were turned into industrial sewers. Heavy
metals, acids, oils, and other poisons accumulated in streams like Lower Hutt’s
Waiwhetū Stream.19
Three early attempts at passing a law to control water pollution had been
unsuccessful, but in 1953 the Waters Pollution Act created the Pollution Advisory
Council to regulate end-of-pipe discharges into water.10
On farms, effluent containing pathogens and rich in nutrients was routinely washed
from dairy sheds into the closest streams. Basic two-pond treatment systems were
introduced in 1972. Increasingly, effluent is now discharged onto land rather than
into water, recycling the nutrients. 19
Grass grew faster on hill country farms if phosphorus was added to that naturally
present in the soil. In 1949 aerial topdressing of superphosphate fertiliser took
place for the first time in the Wairarapa, providing a new occupation for some who
had been pilots in the Second World War. Phosphate clings to soil, so erosion from
the deforested hills then began to take even more phosphorus along with sediment
into rivers and streams.
In 1982, a plant making the nitrogen fertiliser urea was opened in Taranaki using
natural gas from the Kapuni gas field. Before a ready supply of urea became
available, nitrogen was usually added to soil by growing clover and other
legumes.11 Together with irrigation, urea has enabled the grass growing season to
be extended well beyond the spring and autumn flushes of the traditional pasture
of ryegrass and clover. This is largely why dairy farming has been able to intensify
and expand into new parts of the country.12
Source: Bloomfield Collection, Alexander Turnbull Library, Wellington
Figure 2.5: Whakatū freezing works near Hastings in the 1920s-30s. Blood
and guts from freezing works contained nutrients that created ‘sewage
fungus’, depleting oxygen and killing fish.Chapter 2 – The story of water quality in New Zealand
2.5 Recent developments
In 1991 the ‘sustainable management’ of fresh water was assigned to the new
regional councils under the Resource Management Act. End-of-pipe (point) sources
of water pollution, which require resource consents, became increasingly tightly
controlled, and much has been invested in upgrading wastewater treatment.13
Diffuse sources of water pollutants are a much greater challenge.
20
In 2002, public concern about water quality rose rapidly in response to the ‘Dirty
Dairying’ campaign run by Fish and Game New Zealand. The following year
the Dairying and Clean Streams Accord was signed by the country’s major dairy
company and central and regional government agencies. The Accord sets voluntary
targets, such as excluding dairy cattle from 90 percent of streams, rivers, and lakes
by 2012.
A large amount of public money has been allocated to clean up iconic and
vulnerable lakes and rivers in recent years. In 2004, $81 million was assigned to
the protection of Lake Taupō; in 2008, $144 and $210 million was assigned for the
Rotorua lakes and the Waikato River respectively.14 In 2011, $11.6 million allocated
to clean up Te Waihora/Lake Ellesmere also included contributions from the local iwi
and the dairy industry.
In 2008, the Minister for the Environment established a Land and Water Forum
based on a collaborative governance model used in Sweden and Finland. The
Forum contains representatives of “iwi, agricultural, industrial, urban, and
environmental organisations with interests in water management”.15 In 2011,
the Government released a National Policy Statement (NPS) for Freshwater
Management to guide regional and district council decision making.21 3 Pathogens The word pathogen has its origin in two Greek words – pathos meaning suffering, and gene meaning to give birth. Pathogens are invisible microbes – bacteria, viruses, and so on – that cause disease. Significant outbreaks of typhoid, the waterborne killer of colonial times, have not occurred for many years in New Zealand. But 20,000–30,000 people still get gastrointestinal illness from pathogens in polluted water every year.16 Skin infections are also common. A water sample from the nearest river will almost certainly contain the Campylobacter bacteria, which can cause diarrhoea and vomiting.17 Cryptosporidia and Giardia, protozoa that also cause gastroenteritis, are common too. This chapter is focused on the pathogens in water that come from faecal sources. Cyanobacteria, also known as blue-green algae, are not pathogens – but some can produce lethal toxins that are much more dangerous than most pathogens. Cyanobacterial abundance is related more to nutrients than to faecal sources, so they are discussed in Chapter 5. This chapter describes how pathogens get into fresh water, the impact they have on human and animal health, and how they are measured.
Chapter 3 – Pathogens

     3.1        How pathogens get into water
                The main sources of pathogens in fresh water are human sewage and animal
                manure.

                Most human waste in New Zealand is treated by municipal sewage treatment
                systems before being discharged into water. One aim is to reduce the number of
                pathogens in the wastewater, but the extent and effectiveness of sewage treatment
22
                varies. Storm overflows, broken sewer pipes, and poorly located and maintained
                septic tank systems mean some sewage gets into water without being treated at
                all.

                When livestock manure gets into water, pathogens get into water. Some manure is
                deposited directly into water – cattle and deer are attracted to water. According to
                one study, dairy cows are over 50 times more likely to defecate straight into water,
                when given the opportunity.18

                Around 15 percent of dairy cow effluent is deposited in the shed during milking.
                Traditionally this effluent was run through two-pond treatment systems and
                eventually discharged into water; these systems removed most of the solids, but
                pathogens often survived the process.

                Today, many dairy farmers irrigate shed effluent back onto land, though pathogens
                can still be washed into water if the storage pond overflows, the effluent irrigator
                breaks down, or the receiving land is too wet for the effluent to soak in.

                But the bulk of livestock manure is deposited directly onto pasture. Whenever it
                rains, some manure gets washed off land into streams, rivers, and lakes. Additional
                sources of pathogens, such as Canada geese, dogs, and ducks, are insignificant
                nationally, but can be important locally.19

                                                                  Source: United States Department of Agriculture

                Figure 3.1: Common faecal bacteria, Escherichia coli
23
3.2 What pathogens do in water
The potential for pathogens in water to make people sick should not be
underestimated. In 1984, when a sewer overflowed close to the water supply intake
in Queenstown, 3,500 people came down with gastroenteritis and most of the
town’s pupils were absent from school.20
Eating food from water contaminated with pathogens can make people sick too.
23
Pathogens can remain on the moist surfaces of foods like watercress if the food is not
washed properly. Filter-feeding shellfish such as pipi and mussels grown in polluted
waters can be particularly risky to eat. Since 2009, the public have been advised
to avoid collecting shellfish in the Tauranga and Waihī estuaries due to regular
contamination with norovirus, which causes vomiting.21
Animals also get sick from polluted water. While sick animals are more likely to
directly infect each other, contaminated water can spread disease on to healthy
herds and flocks downstream. Salmonella, a well known cause of food poisoning
in humans, is an emerging problem for livestock. Recent outbreaks have caused
diarrhoea, loss of milk production, miscarriage, and deaths.22
Some waterborne diseases readily jump from animals to people. Leptospirosis, known
as ‘dairy farm fever’, is a typical example. It is often caught directly from infected
animals by farmers and meat workers, but can also be transmitted in water.23
Source: Wiki Commons
Figure 3.2: A sign warns of pathogen risk from freezing works effluent (2004)Chapter 3 – Pathogens
3.3 Measuring pathogens in water
There are two commonly used ways of measuring pathogens in fresh water. Both
are measured in units of the number of live bacteria per 100 millilitres of water.
1. Faecal coliform (FC) bacteria counts measure sewage and manure
contamination in water. This measure can give a false impression of health risk
24 because coliforms of plant (not faecal) origin can grow when water samples are
tested.
2. Escherichia coli (E. coli) bacteria live in the guts of mammals and birds, so
any sewage or manure contains many millions of these bacteria. Most E. coli
strains are not harmful.24 However, high levels of E. coli indicate the presence
of faecal material in the water, and therefore other pathogens too. So the level
of E. coli in a water sample indicates how likely the water is to cause disease.
Water is only deemed safe for drinking if there are no E. coli present. When
E. coli counts in rivers and lakes are detected above 550 per 100 millilitres,
health authorities put up signs stating ‘Swimming or collecting shellfish is not
recommended’.2525
4
Sediment
Forests store up water for gradual distributions; and they prevent the
vegetable mould they form from being washed away. Consequently it
follows that when the bush is cut down, not only do the streams tend to
disappear with it, but the rain, when it comes, carries the fertile soil from
the hillsides down into the valleys.26
Sediment – particles of soil and rock eroded from the land and washed or blown
by the wind into rivers and lakes – is a widespread and serious water quality
pollutant in New Zealand. This is not new – the quote above is from 1909.
The problem is not sediment per se. Erosion is a natural process – it is geology
in action. Even a pristine headwater in a national park turns brown in flood. The
startling blue of Lake Tekapo is due to very fine suspended sediment known
as ‘glacial flour’. Native ecosystems have had plenty of time to adapt to these
conditions.27
The problem is that accelerated erosion produces too much sediment. Removing
most of the original forest cover of New Zealand exposed soil to the elements
and greatly accelerated the natural process.
Particles of sediment range in size from fine particles of clay to boulders.28
Smaller particles of silt and clay tend to float in the water as ‘suspended
sediment’. In calm water, they gradually settle to the bottom forming soft
layers of ‘deposited sediment’. Waves, winds, and floods can stir up deposited
sediment, filling the water with suspended sediment again.
Sediment is also a major source of phosphorus because phosphate sticks to the
surface of soil particles carried into water. Phosphorus is one of the two problem
nutrients discussed in Chapter 5.
This chapter describes what causes excess sediment in water, the impacts it has,
and how sediment is measured.Chapter 4 – Sediment
4.1 How sediment gets into water
Erosion and sedimentation are continual processes that slowly redistribute vast
volumes of material in this geologically young country.
The highest natural rates of erosion occur on the South Island’s West Coast, with its
high rainfall, steep slopes, uplift on the alpine fault and erodible soils. Short, steep
rivers wash most of this sediment straight out to sea.
26
In contrast, the wide alluvial plains of Canterbury were made from alpine sand and
gravel deposited by the Waimakariri, Rakaia, and other braided rivers. Doubtless
the notorious nor’wester winds also played a role.
Before people arrived in New Zealand, it was almost completely forested from shore
to snowline. Under cover of trees, ferns, tussocks, and other vegetation, the land
could cope with heavy rain.29 But human activities have changed the landscape
completely. The greatest rates of erosion in the country are found on the North
Island’s East Cape, in areas where steep, erosion-prone land has been cleared of
native forests.
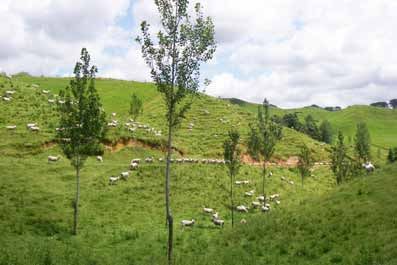
Pasture produces two to five times more sediment than an equivalent area
of forest.30 Animals can break down banks putting soil directly into streams.
Overgrazing leaves soil exposed and sheep tracks along hillsides create channels for
water to carry away soil into rivers, lakes, and wetlands.
Other land uses can also produce large amounts of sediment in waterways. Losses
of soil from production forests are lower than from pasture for most of the forest
rotation. But when the trees are harvested and replanted, erosion rates go up 10
to 100 fold.31 Opencast mining, urban development, and road building can all put
sediment into water.
Overall, every year more than 200 million tonnes of sediment washes down New
Zealand rivers into the sea.32 This soil is lost forever.
Source: Peter Scott
Figure 4.1: Bare hillsides erode while their neighbours hold firm under a
canopy of plantation pine, Hawke’s Bay.27
4.2 What too much sediment does in water
Sediment makes clear water murky (or turbid), smothers aquatic life, alters water
flows, and exacerbates flooding.
Murky water
Sediment in flowing water can damage the native plants that grow on stones 27
and gravels – effectively acting like sandpaper, abrading and scouring them
away. Suspended sediment can also damage the gills and delicate body parts of
invertebrates and native fish like īnanga (one of the five whitebait species).33
Sediment can also have a major impact by reducing visibility. Native freshwater
plants need light and most cannot grow in murky water; while creatures that hunt
their food by sight, such as trout and kōura, can find it harder to catch food.
Swimming in murky water is not appealing and can be dangerous, as logs and
other hazards underwater are not easily seen.
Source: David Peacock
Figure 4.2: The Waipāoa River sends a plume of sediment-laden water into
Poverty Bay.
A blanket of mud and silt
The greatest impact of sediment on water quality comes from its ability to smother
the beds of rivers, streams, and lakes.
The spaces among the stones and gravels on the beds of streams, rivers, and lakes
are an important habitat for aquatic plants, invertebrates, and fish.34 Many animals
use these spaces – that can stretch down many metres – for shelter, feeding, and
spawning. When water flow is slow enough, the sediment settles out, and this
bottom habitat can become choked and buried under a layer of mud and silt.Chapter 4 – Sediment
This blanket of mud and silt can directly kill native plants and animals. And when
the plants disappear, so too can the invertebrates and fish that rely on them. A
thick layer of silt also provides a foothold for exotic weeds.
This problem can be particularly severe in estuaries. When a river mixes with
seawater, the increasing saltiness leads to more sedimentation in the estuary or
just offshore.35 Saltmarsh plants like cordgrass and mangroves accelerate this by
28 trapping sediment.
The Kaipara Harbour is the biggest estuary in the Southern Hemisphere, and where
most of the snapper on the west coast of the North Island originate. Sediment from
the catchment threatens to overwhelm horse mussel beds and seagrass meadows,
which are nursery grounds for snapper.36
Changing water flows
When sediment builds up, it changes water flows and reduces the capacity of
waterways. The impact of excess sediment goes well beyond water quality.
For instance, silt from urban development, pastoral land, forest areas, and quarries
has long accumulated in the Tauranga estuary. Navigation channels are increasingly
shallow, fish habitats and shellfish beds have been buried, and the port must be
regularly dredged.37
Layers of silt can make rivers, lakes and estuaries more vulnerable to flooding
because they are shallower. Flooding along Northland’s Awanui River in 2007 was
made considerably worse by a build-up of silt in the flood channel.38
Figure 4.3: Most New Zealand rivers are naturally stony-bottomed. Native
plants and animals that have adapted to that environment, like this
torrentfish, can be killed by sediment.29
4.3 Measuring sediment in water
There are various methods used for measuring both sediment that is suspended in
water and sediment that has settled on river and lake beds.
Suspended sediment can be measured directly (in grams of sediment per litre of
water), or inferred by measuring the murkiness of the water or its opposite, the
clarity of the water.
29
• Murkiness can be measured by the amount of light scattered when a beam of
light is passed through water. The technical term for murkiness is turbidity. The
unit of measurement is ‘nephelometric turbidity units’ (NTU)39
• Clarity can be measured by the distance through water before a standard
black disk can no longer be seen. Sometimes a ‘Secchi disk’ is used to measure
clarity. A Secchi disk has alternate black and white segments and is lowered
into the water until it can no longer be seen
Deposits of sediment on river, lake, or estuary beds can be assessed by:
• Measuring changes in the percentage of silt and clay in sediments
• Surveying the elevation and shape of the bed30
31

      5
      Nutrients

      Like people, plants need certain nutrients in order to grow. Gardeners are
      familiar with NPK fertilisers that contain the three essential elements of nitrogen,
      phosphorus and potassium.40 Too much of the first two of these – nitrogen and
      phosphorus together – are the cause of the algal blooms and other unwanted
      plant growth in waterways that has become such a concern today. 41

      Both nutrients occur in different chemical forms. The two common forms of
      nitrogen in water are nitrate and ammonia, whereas phosphorus mainly exists as
      phosphate.42

      This chapter describes how phosphorus and nitrogen get into the water, what
      the impacts are, and how they are measured.

5.1   How nutrients get into water
      What nitrogen and phosphorus have in common is that they are both needed
      for plants to grow – they are both essential nutrients. But there is much they do
      not have in common.

      Both common forms of nitrogen – nitrate and ammonia – are highly soluble in
      water. In contrast, phosphorus in the form of phosphate usually clings to soil
      and sediment.43 This difference affects how the two nutrients get into water,
      what happens to them in water, and, as discussed in Chapter 7, how they can
      be prevented from getting into water.

      The biggest source of nitrogen in New Zealand’s waterways is urine from
      farm animals.44 Urine contains urea which is rich in nitrogen. Urine thus acts
      as a nitrogen fertiliser, but urine patches in paddocks can be too much of a
      good thing – the grass cannot grow fast enough to take up all the nitrogen,
      particularly in winter. The soluble excess nitrogen seeps down into groundwater
      or washes off the paddock into streams. Wasted nitrogen fertiliser is a much
      smaller source of nitrogen in fresh water than urine.45
Chapter 5 – Nutrients
Because phosphate usually clings to soil particles, the main way in which
phosphorus gets into water is when soil is washed in and becomes sediment.46
Much of the phosphorus in rivers and lakes is a legacy of erosion caused by forest
clearance and fertilising for sheep farming. Most New Zealand soils are naturally
low in phosphorus, but when washed into water add to the cumulative effect of
decades of erosion and topdressing with superphosphate.
32 Sewage and animal effluent are rich in both nitrogen and phosphorus. Many
smaller sewage plants have limited treatment capability, leaving behind much of
the nitrogen and phosphorus. Some sewers overflow at times and septic tanks
can be poorly located and maintained. Household detergents are also a source of
phosphorus. Animal effluent comes from dairy sheds, piggeries, freezing works,
mole and tile drains, and from animals with access to waterways. Manure can also
wash off paddocks in heavy rain.
Wastewater from dairy factories, freezing works, and pulp and paper plants can be
significant point sources of phosphorus in particular.47
Although point sources of nitrogen and phosphorus can be very significant at
specific places and times, they are much less significant at a national level than the
diffuse sources. The great majority of the nitrogen that gets into fresh water comes
from animal urine. The amount of phosphorus that gets into fresh water with
sediment far outweighs inputs from point sources.
5.2 What too many nutrients do in water
Both common forms of nitrogen in water – nitrate and ammonia – cause problems.
Very high levels of nitrate can make groundwater unsafe to drink.48 Nitrate can
also kill sensitive organisms like young trout and salmon.49 Ammonia is highly toxic
to fish and other creatures that live in water, so direct discharge of ammonia-rich
wastes such as raw sewage or dairy shed effluent can be particularly damaging. But
the main impact of too much nitrogen and phosphorus is the ‘overfertilisation’ of
aquatic plants, leading to excessive plant growth, algal blooms and the depletion of
oxygen dissolved in the water.
Too many nutrients cause excessive growth of three kinds of aquatic plants – large
plants visible to the naked eye called macrophytes, and two kinds of tiny plants
called periphyton and phytoplankton.33
33
Periphyton Macrophytes Phytoplankton
Figure 5.1: Excessive growth of three types of plants degrades water
quality. All three must receive sunlight in order to photosynthesise.
Periphyton tend to grow in shallow water; because they form films on
submerged stones they must be close to the water surface. Macrophytes
grow in deeper water – they are rooted to the bottom and reach up
towards the sunlight. Phytoplankton float and so can thrive in deep water.
Periphyton are tiny plants that grow on surfaces under the water. Growing in
millions, they form the film or slime covering stones and wood in streams, and can
also grow on, smother, and kill larger plants. Excessive growth of periphyton can
carpet the bottom of lakes and rivers, degrading swimming and fishing spots and
driving away creatures that need to spawn, feed, and shelter on the bed.50
Macrophytes generally root into the bottom and send stems and leaves up towards
the light. Some macrophytes emerge above the water, like rushes in a wetland;
others have leaves floating on the surface, like a pond-lily; and still others are
entirely submerged, waving in the current. Native plants are generally adapted to
low nutrients, low sunlight, and low sediment.51 In contrast, invasive exotic weeds,
like hornwort, respond prolifically to excess nutrients, crowding out natives, fouling
pipes, and clogging lakes and streams.
Phytoplankton differ from periphyton in one key way – they float freely in the
water, rather than being attached to surfaces under the water. The term comes
from the Greek word planktos, meaning to wander.Chapter 5 – Nutrients
Both periphyton and phytoplankton come in two forms:52
• Algae that photosynthesise, growing in the same way as most plants on land
by using sunlight and carbon dioxide
• Cyanobacteria or ‘blue-green algae’.53 Strictly speaking, cyanobacteria are
bacteria, but are usually classified as plants because they also grow using a
form of photosynthesis
34
As nutrient levels increase, periphyton generally multiply first followed by
macrophytes, which can shade out the periphyton. Very high nutrient levels then
lead to blooms of phytoplankton – known as algal blooms.
Algal blooms
In slow moving water containing high levels of nutrients, algae can rapidly multiply
forming algal blooms. This is most likely to occur in summer when the water is
warmest and there is plenty of sunlight.
Generally the term ‘algal bloom’ refers to an extremely rapid increase of
phytoplankton. In such a bloom a litre of water can contain millions of algal cells
and the water is often discoloured a vivid green, brown, or red. Some cyanobacteria
produce poisonous toxins that reach dangerous levels during a bloom, with the
danger often persisting for days after the bloom is over.54
Food gathered from toxin-tainted water can be dangerous and cooking does not
destroy the toxins. Filter-feeding shellfish in estuaries, like scallops and mussels,
accumulate algae toxins as well as pathogens. Other wild foods, such as eels, can
also become poisonous when they live in waters infested with algae.55
Colonies of periphyton can also increase very rapidly, forming a dense slimy
mat trailing long tendrils and carpeting submerged stones and wood. ‘Didymo’
(‘rock snot’) is a type of introduced periphyton that can smother an entire river
bed. It was first recorded in the Lower Waiau River in the South Island in 2004,
and is currently confined to the South Island – where it is now found in over 150
rivers and lakes. Like other nuisance species of periphyton, the severity of a didymo
outbreak depends on the ‘flow regime’ of the river, and the amounts of nitrogen
and phosphorus present.5635
35
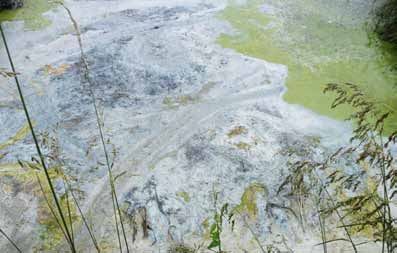
Source: Dr. Max Gibbs, NIWA
Figure 5.2: One of the most polluted lakes in the country is Lake
Horowhenua. This shallow dune lake on the Manawatū coast is in an
area of intensive horticulture. Cyanobacteria regularly bloom in Lake
Horowhenua in late summer. Algae toxins at the edge of the lake have
been measured at up to 36 milligrams per litre – 3,000 times greater than
the recommended action level of 0.012 milligrams per litre.57
Box 5.1: Nutrient limitation
An excess of nitrogen or phosphorus alone will not lead to exorbitant growth
of algae and aquatic weeds. There needs to be enough of both nutrients,
in the right ratio. If a river or lake has plenty of nitrogen to fuel unwanted
plant growth but not enough phosphorus, it is said to be phosphorus-limited.
Conversely, water with plenty of phosphorus but not enough nitrogen is
nitrogen-limited.58
The concept of nutrient limitation is fundamental when it comes to considering
how to keep nitrogen and phosphorus out of water. In theory, if a water body
is phosphorus-limited, then there is less need to control inputs of nitrogen.
However, in many situations controlling one nutrient may be insufficient
because:
• The limiting nutrient in a water body can be different at different
times59
• The limiting nutrient can be different in different parts of the same
water body60
• Cyanobacteria may bloom even in nitrogen-limited waters61Chapter 5 - Nutrients
Oxygen depletion
Fish and other animals that live in rivers and lakes need oxygen to breathe, but
excessive plant growth in water can sometimes cause oxygen levels to plummet
below that needed to sustain life.
When plants photosynthesise they produce oxygen. When they respire they
consume oxygen. Oxygen is also consumed when plants die and are broken
36
down by bacteria. The problem is that plants only produce oxygen during the day
because photosynthesis requires sunlight, but the processes that consume oxygen –
respiration and decomposition – occur day and night.
The result is that excessive plant growth can lead to dramatic drops in oxygen levels
at night, leaving fish and other aquatic creatures unable to breathe.
Box 5.2: ‘Stratification’ and oxygen depletion of lakes
In summer, many New Zealand lakes ‘stratify’ into two distinct layers, a warm
upper layer and a cold lower layer. The two layers do not mix because the
warm layer is lighter than the cold layer.
Bacteria in the bottom layer use up oxygen in the water as they break down
dead plant and animal matter. And because this layer is isolated from the
surface and from the warmer upper waters where plants are photosynthesising,
the oxygen cannot be replaced. This lack of oxygen can kill invertebrates
and fish directly, but also affects the lake by greatly increasing the release of
phosphorus from the sediment into the water of the bottom layer.62
In autumn, the top layer cools, the wind stirs up the water, and the lake waters
mix again. The phosphorus released from the sediment is mixed throughout the
lake, ready to fuel algal blooms the next summer.37
5.3 Measuring nutrients in water
There are many ways of measuring nutrients and their impacts in water. Some are
presented below, including three measures that go beyond just measuring nutrients
to capture the overall health of fresh water.
Indicators of nutrient status
37
Both nitrogen and phosphorus can be measured as totals or just in their dissolved
forms.
Dissolved inorganic nitrogen (DIN)
DIN includes nitrate, ammonia, and other forms of inorganic nitrogen. It is nitrogen
available for plant growth.
Total nitrogen (TN)
TN is the total amount of nitrogen present in water. It includes nitrogen from dead
plants and animals as well as DIN. When dead plants and animals decay, they
release nitrogen into the water, so it becomes available for plant growth.
Dissolved reactive phosphorus (DRP)
DRP is the amount of phosphorus that has dissolved in water and is therefore
readily available for plant growth.
Total phosphorus (TP)
TP is the total amount of phosphorus present in water. It includes the phosphate
that is stuck to sediment as well as DRP. TP is a particularly important measure for
lakes, because over time phosphate that is stuck to sediment can be released and
become available for plant growth.Chapter 5 - Nutrients
Indicators of ecosystem ‘health’
Dissolved oxygen (DO)
The amount of dissolved oxygen gas in water is usually reported as a percentage
of the maximum possible concentration – ‘saturation’.63 Trout begin to be affected
when saturation drops below 80 percent; many native fish and invertebrates are
affected below 50 percent, and killed if oxygen depletion persists for long.64
38
Trophic Level Index (TLI)
The nutrient (trophic) status of a lake is often assessed using the TLI – a composite
index that amalgamates measures of nitrogen, phosphorus, chlorophyll and the
clarity of the water. A low TLI value (2 or less) indicates the lake has low levels of
nutrients and plant growth, as would be expected of many New Zealand lakes
in their natural state. A high TLI (4 or above) indicates the lake is enriched with
nutrients and likely to experience growth of macrophytes and algae.
Macroinvertebrate Community Index (MCI)
The MCI is an ecological index that measures the variety of insects, worms, snails,
and so on, that are present in a stream or river. An MCI score of less than 80
indicates poor ecological health while a score of 120 or more indicates excellent
ecological health.
Figure 5.3: Algae health risk warning, Manawatū-Wanganui region39 6 Natural vulnerability to water pollution The previous three chapters have described the three types of pollutants that are of most concern in New Zealand – what they are, where they come from, and the impacts they can have on fresh water. But how serious those impacts are depends to a large extent on the characteristics or vulnerability of the specific water body where the pollutants end up; that is, the nature of the ‘receiving environment’. The greater the natural vulnerability of a body of fresh water, the greater the impact of human activities. Lakes, rivers and streams, wetlands, estuaries, and aquifers are different receiving environments. Moreover, a shallow warm lake is a different receiving environment from a deep cold lake. A river that meanders on a winding course to the sea is a different receiving environment from a river that flows swiftly straight to the sea. On a larger scale, some catchments are naturally more sensitive than others. How much it rains, how steep or flat the terrain is, and the types of soil and rock present all influence how vulnerable a catchment is to water pollution. And within a catchment, all lakes, rivers and streams, wetlands, estuaries, and aquifers are linked to others, and the impacts of water pollution in them are linked too. This is why water pollution is best understood at the catchment level. This chapter describes how the vulnerability of fresh water to pathogens, sediment, and nutrients is affected by a variety of natural (not human) factors. These factors and their influence on the vulnerability of lakes, rivers and streams, wetlands, and aquifers to pollutants are explained in the following sections.
Chapter 6 – Natural vulnerability to water pollution

     6.1         Lakes are especially vulnerable
                 By their very nature, lakes are generally more vulnerable than rivers. Lakes act like
                 sinks, accumulating the pollutants that come down a catchment. Sediment and
                 phosphate, in particular, become trapped. Lakes – especially small, shallow, warm
                 ones – also provide ideal conditions for weeds and algae to grow.

40               Weeds (macrophytes) can readily grow in sediment that has built up in shallower
                 parts of lakes. The nutrients that so usefully fertilised the plants on land accumulate
                 and fertilise the water weeds. And because lakes are wide open to sunlight, there is
                 plenty of warmth and light for photosynthesis.

                 Algae (periphyton and phytoplankton) growing on surfaces or floating in the
                 water also grow more prolifically in response to light and warmth as nutrients and
                 sediment accumulate in lakes.

                 Lack of oxygen can be a major issue in lakes. In lakes with high nutrient levels,
                 excessive plant growth can lead to wild fluctuations in oxygen levels, including the
                 dramatic overnight drops that can kill invertebrates and fish. Warm shallow lakes
                 are most vulnerable to these fluctuations.

                 Lake stratification (described in Box 5.2) sometimes leads to oxygen depletion in
                 lakes.

                                                                                 Source: Dr. Rohan Wells, NIWA

                 Figure 6.1: Hornwort forms a dense bed in Rotorua’s Kaituna River. A
                 former aquarium plant gone wild, hornwort can spread from a single
                 fragment, thrives in full sunlight or shade, and can even grow under ice.
                 Hornwort readily blocks drains and fills shallow lakes, wiping out native
                 water plants and preventing fishing or boating.
You can also read


