GREENOVATE BOSTON 2014 CLIMATE ACTION PLAN UPDATE - MAYOR MARTIN J. WALSH - Boston.gov

Page created by Audrey Dixon
 
CONTINUE READING
GREENOVATE BOSTON 2014 CLIMATE ACTION PLAN UPDATE - MAYOR MARTIN J. WALSH - Boston.gov
GREENOVATE
BOSTON
2014 CLIMATE ACTION PLAN UPDATE

     MAYOR MARTIN J. WALSH
GREENOVATE BOSTON 2014 CLIMATE ACTION PLAN UPDATE - MAYOR MARTIN J. WALSH - Boston.gov
2014 CLIMATE ACTION PLAN STEERING COMMITTEE MEMBERS

Vivien Li, Co-Chair                                Kelly Saito                                           John Barros
The Boston Harbor Association, President           Gerding Edlen, President                              City of Boston, Chief of Economic Development
Brian Swett, Co-Chair                              Magdalena Ayer                                        Sheila Dillon
City of Boston, Chief of Environment,              Maverick Association of Residents                     City of Boston, Chief of Housing
Energy and Open Space
                                                   Marilyn Swartz-Lloyd                                  Felix Arroyo
Andrew Kendall                                     MASCO, President and CEO                              City of Boston, Chief of Health and Human Services
Henry P. Kendall Foundation, Executive Director
                                                   Mark Liu                                              James Gillooly
Anthony Janetos                                    Chinese Progressive Association, Deputy Director      Boston Transportation Department,
The Frederick S. Pardee Center for the Study of                                                          Interim Commissioner
                                                   Nancy Kilburn
the Longer-Range Future, Director
                                                   Greater Boston Interfaith Organization; Roxbury       Barbara Ferrer
Brian Doherty                                      Presbyterian Church Social Impact Center, Director    Boston Public Health Commission, Director
Building and Construction Trades Council
                                                   Penn Loh                                              Michael Dennehy
Bud Ris                                            Tufts University Masters of Public Policy Program     Public Works Department, Interim Commissioner
New England Aquarium, Former President and CEO     and Community Practice, Director
Christine Poff                                     Rick Dimino
Boston Parks Advocates, Lead Organizer;            A Better City, President and CEO
Franklin Park Coalition, Executive Director
                                                   Robbin Peach
Crystal Johnson                                    MassPort, Program Manager for Resilience
Integrative Sustainability and Environmental
                                                   Rosanne Foley
Solutions, Energy & Sustainability Strategist
                                                   Fields Corner Main Street, Director
Cynthia Loesch
                                                   Stephanie Pollack
Codman Square Neighborhood Council,
                                                   Northeastern University, Dukakis Center for
Vice President
                                                   Urban and Regional Policy, Associate Director
Edward Glaeser
                                                   David Brewster
Harvard University, Professor of Economics;
                                                   EnerNOC, Inc, President
Taubman Center for State and Local Government,
Director; Rappaport Institute of Greater Boston,   Tom McShane
Director                                           Dewey Square Group, Principal; Boston Harbor Island
                                                   Alliance, Director City of Boston Representatives     Mayor Walsh announcing the 2014 Climate Action Plan Steering
Jacqueline Douglas
                                                                                                         Committee in March 2014. He also announced that Boston joined
Livable Streets Alliance, Executive Director       Councilor Matt O’Malley
                                                                                                         the C40 Cities, an invitation-only global network of cities on the
                                                   Boston City Council, Environment and
Jhana Senxian                                                                                            front line of preparing for and helping prevent climate change.
                                                   Parks Committee Chair
Sustainability Guild International, CEO
GREENOVATE BOSTON 2014 CLIMATE ACTION PLAN UPDATE - MAYOR MARTIN J. WALSH - Boston.gov
LETTER FROM MAYOR MARTIN J. WALSH

DEAR NEIGHBORS,

When I took office in January 2014, it was clear that climate and sustainability were top priorities for
Boston. Hundreds of people showed up to the public forums on the environment and open space in January.
Throughout the past year, I’ve been impressed by and grateful for your participation and engagement—from
the Steering Committee, to the Greenovate Boston Community Summit, to the hundreds of ideas and com-
ments submitted along the way. I am proud to launch the Greenovate Boston 2014 Climate Action Plan
Update under my administration.

Boston has long been a leader on climate action, starting with the 2007 Executive Order on Climate Action.
We knew then, and it has only become more clear, that Boston must both dramatically reduce its green-
house gas emissions and prepare for the unavoidable impacts of climate change. Between 2007 and 2012,
we made great progress, from green buildings to single-stream recycling. Then in the fall of 2012, Hurricane
Sandy struck New York and New Jersey, causing unimaginable damage and heartache—73 Americans lost
their lives and the storm caused $68 billion dollars in damage.

Had the storm hit just five hours earlier, Boston could have experienced similar losses. We were not better
prepared than New Jersey or New York—we were lucky, and luck is not a policy we can count on. The
climate continues to change, resulting in rising sea levels and more extreme weather. Boston must focus
its collective will on making sure we do everything possible to be ready, and we need to take the lead on
reducing the well-documented human contribution to climate change.

Addressing climate change is challenging, but if we work together, the steps we take can do more than
protect us; they can create good jobs while improving our health, our public space, and our civic life. And,
with your input and support, plus consistent data to track our progress, that is exactly what this plan is
designed to achieve.

Sincerely,

Martin J. Walsh, Mayor of Boston

                                                                                                          3
GREENOVATE BOSTON 2014 CLIMATE ACTION PLAN UPDATE - MAYOR MARTIN J. WALSH - Boston.gov
CONTENTS

                                                           03 Letter From Mayor Martin J. Walsh         38 Large Buildings and Institutions
                                                                                                            42 2020 Goals and Targets
                                                           06 Executive Summary
                                                                                                            42 Strategies and Actions
                                                           09 Acronyms and Definitions                  		42 Buildings and Energy
                                                                                                          47 Waste and Consumption
                                                           10 Introduction
                                                            11 State of the Climate                     50 Transportation
                                                           		  11 Impacts to Boston                         54 2020 Goals and Targets
                                                               11 National and International Progress       55 Strategies
                                                                                                        		55       Fuel Economy
                                                           13 About the Plan
                                                                                                        		55       Reduce Vehicle Miles Traveled
                                                               16 Cross-Cutting Themes                  		57       Development, Zoning, and Land Use
                                                            16 Social Equity
                                                           		                                             57       Data and tracking systems
                                                            16 Economic Development

                                                            17 Public Health and Safety
                                                           		                                           58 Climate Preparedness
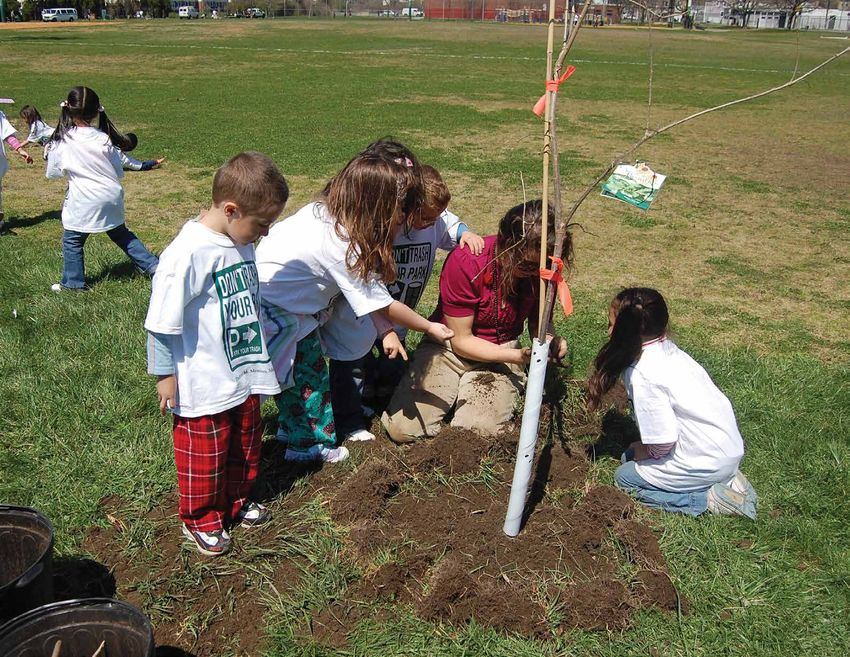
Soliciting community ideas at the 2014 Greenovate Boston    18 Community Engagement                         60 2020 Goals and Targets
Community Summit.                                                                                           60 Strategies and Actions
                                                           19 Boston’s Carbon Footprint
                                                                                                         60 Planning and Infrastructure

                                                               21 Understanding the Trends
                                                                                                         62 Community Engagement

                                                               22 Tracking Progress                      66 Trees and Open Space

                                                            22 GHG Targets
                                                           		                                            67 Buildings and Energy
                                                            24 Participation

                                                            24 Strategies and Actions                   70 80x50
                                                                                                            72 Core Objectives and Long-term Strategies
                                                           25 Implementation and Next Steps
                                                                                                        		72       Carbon-neutral and resilient visioning
                                                           26 Neighborhoods                             		75       Interim carbon target
                                                               30 2020 Goals and Targets                		76       Ongoing research and learning
                                                                                                          77       A transformation of the environmental
                                                               30 Strategies and Actions
                                                                                                                   awareness of all Bostonians
                                                            30 Community Engagement

                                                            32 Buildings and Energy
                                                           		                                           78 Credits and Endnotes
                                                            33 Waste and Consumption

                                                            36 Trees and Open Space

Boston Shines Savin Hill clean up.

4     GREENOVATE BOSTON 2014 CLIMATE ACTION PLAN UPDATE                   CONTENTS
GREENOVATE BOSTON 2014 CLIMATE ACTION PLAN UPDATE - MAYOR MARTIN J. WALSH - Boston.gov
CONTENTS continued

FIGURES                                                  35 Figure 17: Boston’s Residential Waste Stream
                                                                       (infographic)
06 Figure 1: GHG Progress and Goals by Sector,
             2005–2013                                   55 Figure 18: Per Capita Vehicles Miles Traveled
                                                                       (VMTs) vs. Total VMTs
08 Figure 2: Boston’s GHG Goals and Targets by
             Sector (infographic)                        69 Figure 19: Coordinating Climate Preparedness
                                                                       Efforts (infographic)
12 Figure 3: The Greenhouse Gas Effect (infographic)
13 Figure 4: GHG Emissions by Sector, 2013
                                                         ILLUSTRATIONS
14 Figure 5: Boston’s Climate Action Timeline
                                                         28 Neighborhoods
             2011–2014 (infographic)
                                                         40 Large Buildings and Institutions
16 Figure 6: Climate Preparedness Timeline
                                                         52 Transportation
             (infographic)
                                                         68 Climate Preparedness
19 Figure 7: GHG Emissions by Fuel Type, 2013                                                               Boston Bikes Program visits Boston schools and other youth-
                                                                                                            serving organizations with a fleet of bikes and helmets, a team
20 Figure 8: GHG Progress and Goals by Fuel Type,
                                                                                                            of instructors, and an active curriculum that gets kids and teens
             2005–2013
                                                                                                            riding bikes.
20 Figure 9: Per Capita vs. Total GHG Emissions,
             2005–2013
21 Figure 10: Sources of GHG Reductions, 2005–2013
22 Figure 11: Performance Measurement, An Example:
              Residential Sector (infographic)
23 Figure 12: GHG Intensity of Energy Fuels
23 Figure 13: Vehicle Miles Traveled vs. Fuel Economy,
              2005-2013
24 Figure 14: Households Heating with Oil vs.
              Natural Gas, 2005–2013
24 Figure 15: Percent of Residents Living and
              Working in Boston, 2005–2013
24 Figure 16: Driving Mileage: Massachusetts vs.
              Boston, 2013
                                                                                                            Students participating in The Food Project, a non-profit organiza-
                                                                                                            tion that teaches Boston youth about sustainable agriculture.

                                                                                 GREENOVATE BOSTON 2014 CLIMATE ACTION PLAN UPDATE                      CONTENTS                 5
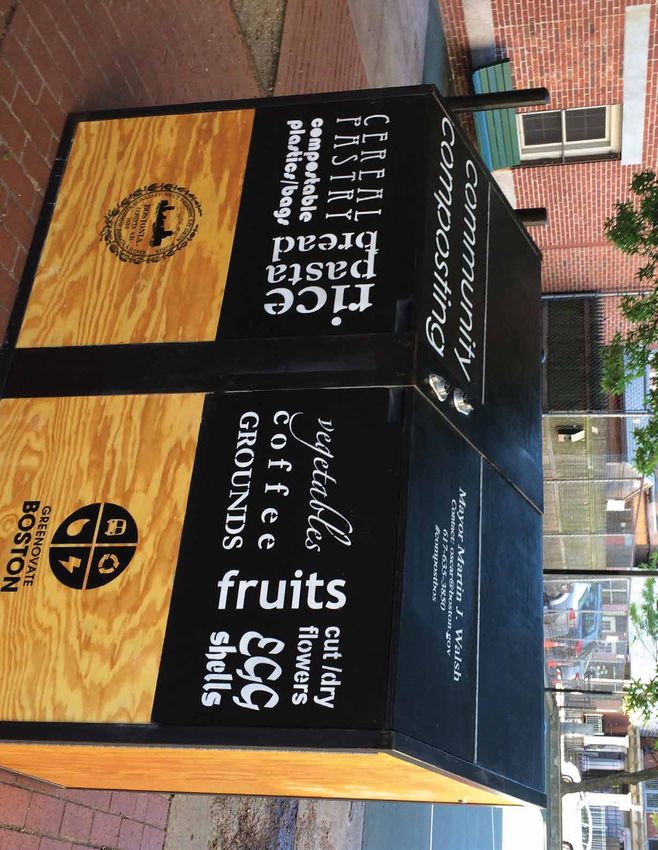
GREENOVATE BOSTON 2014 CLIMATE ACTION PLAN UPDATE - MAYOR MARTIN J. WALSH - Boston.gov
EXECUTIVE SUMMARY

The Greenovate Boston 2014 Climate Action Plan             6. A website that tracks implementation,
                                                                                                                             FIGURE 1: GHG Progress and Goals by Sector,
Update builds upon seven years of work in reducing            performance measures, and lessons learned.                         Boston GHGs by Sector (Fig. 1 graph 1)
                                                                                                                             2005–2013
citywide greenhouse gas (GHG) emissions and prepar-
                                                           The 2014 Plan outlines specific strategies and
ing for the unavoidable impacts of climate change.
                                                           actions across five sections, which comprises                                                8

                                                                                                                      Millions of Metric Tons of GHGe
Beginning with the 2007 Executive Order, the City of
                                                           the body of the Plan:
Boston set GHG reduction goals of 25 percent below
                                                                                                                                                        6
2005 levels by 2020 and 80 percent by 2050 for munici-
                                                           j   Neighborhoods
pal operations, and requires the City to plan and pre-
                                                           j   Large Buildings and Institutions
                                                                                                                                                        4
pare for the impacts of climate change. In 2011, the
                                                           j   Transportation
City released A Climate of Progress, Boston’s first com-   j   Climate Preparedness
                                                                                                                                                        2
munity-wide plan, which set the same GHG reduction         j   80x50
goals for all of Boston, while continuing to prepare for   The strategies and actions in each of these sections                                         0
the impacts of climate change.                                                                                                                              ‘05 ‘06 ‘07 ‘08 ‘09 ‘10 ‘11 ‘12 ‘13    Year       2020 2050
                                                           work toward achieving the sector and the Plan’s over-
Boston has made significant progress toward these          arching goals. These goals, strategies, and actions
                                                           were developed by a Steering Committee, five strategy                                        Total Progress          Transportation        Goal
goals. Citywide, GHG emissions are 17 percent lower                                                                                                     Residential             Progress              Commercial
than they were in 2005. Emissions from City govern-        subcommittees, active engagement of thousands of                                             Progress                Total 2050 Goal       2020 Goal
                                                           people through neighborhood meetings and events,                                             Commercial              Total 2020 Goal       Transportation
ment operations have been reduced by almost 25 per-                                                                                                     Progress                                      2020 Goal
                                                                                                                                                                                Residential 2020
cent since 2005. Meanwhile, it has become increas-         and with support from City staff.
ingly clear that Boston must also prepare for the          In early 2015, implementation plans for the action                Boston reduced GHG emissions by approximately 17% from 2005
unavoidable impacts of climate change. The 2014            items will be developed with continued community                  through 2013. Most of these reductions were due to a cleaner
Update builds upon the 2011 Plan in six key areas:         input and regular progress updates will be included in            electric grid. The next 8% of reductions needed to get to Boston’s
                                                                                                                             2020 goal will be harder to achieve. Reaching the 2050 goal will
1. More comprehensive climate preparedness                 the online version. The online version also includes a
                                                                                                                             require a transformation of our energy and transportation
   strategies;                                             system of rigorous metrics and targets that connect
                                                                                                                             infrastructure.
2. Cross-cutting themes including social                   the strategies to Boston’s carbon footprint.
   equity, economic development, and public                Equally important to reducing Boston’s GHG emissions               The 2014 Climate Action Plan will ensure Boston’s
   health and safety;                                      are the cross-cutting themes that are critical to creat-           continued global leadership in reducing GHG emissions
3. More extensive and inclusive community                  ing a more sustainable city. As the City conducts edu-             and preparing for climate change. With this Plan,
   engagement;                                             cation and outreach on climate change, Bostonians                  Boston will continue to develop as a vibrant and
4. An updated, more rigorous greenhouse gas                must understand how climate action addresses their                 sustainable city for current and future generations
   inventory and emission projections;                     near-term needs. The strategies and actions in the Plan            and champion the actions needed to meet the global
5. A look at Boston’s 80 percent by 2050 GHG               address the importance of community engagement,                    challenges of climate change.
   reduction goal (80x50);                                 social equity, public health and safety, and economic
                                                           development.

6    GREENOVATE BOSTON 2014 CLIMATE ACTION PLAN UPDATE                       EXECUTIVE SUMMARY
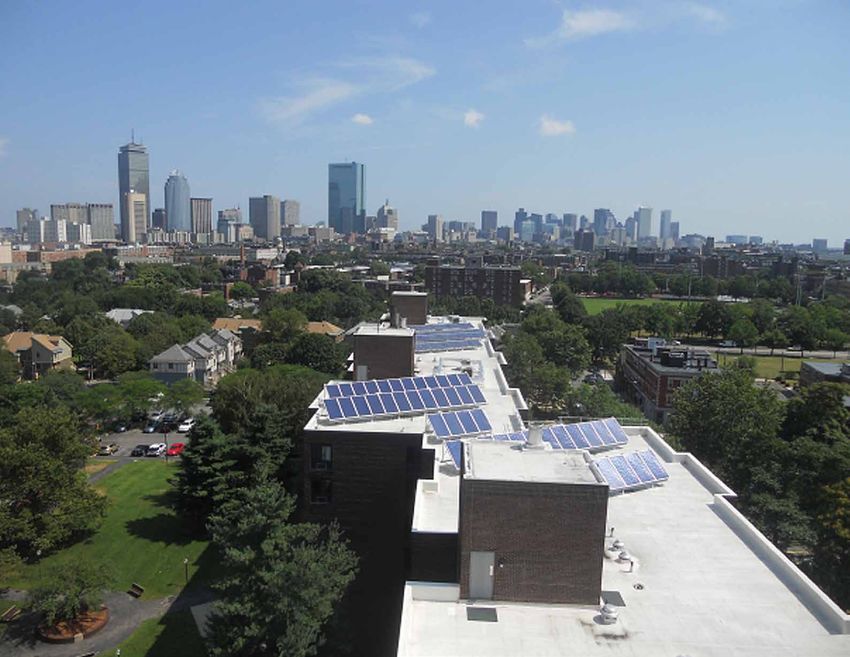
GREENOVATE BOSTON 2014 CLIMATE ACTION PLAN UPDATE - MAYOR MARTIN J. WALSH - Boston.gov
PRIORITIES

 REDUCE GREENHOUSE GAS                              PROMOTE HEALTHY AND                                MEASURE PROGRESS
 EMISSIONS BELOW 2005 LEVELS                        EQUITABLE COMMUNITIES                              j   Track and publicly report on the Climate
 j   25 percent by 2020 and 80 percent by 2050      j   Encourage sustainable development that             Action Plan’s progress year-over-year.
                                                        creates opportunities for current and future       Use performance measurement, targets
 j   Expand energy efficiency programs through                                                         j

                                                        residents.                                         and goals to motivate climate action and
     targeted outreach and new financing
     mechanisms.                                    j   Ensure equitable access to green jobs and          behavior change.
                                                        facilitate job training.
 j   Increase local and low-carbon energy
     sources, including expanding district energy   j   Implement Housing a Changing City, the
     and co-generation.                                 2015–2021 Open Space plans
 j   Re-envision Boston’s transportation system     j   Promote equity in all policies and programs.
     to dramatically reduce emissions from
     this sector.

 PREPARE BOSTON FOR THE                             INCREASE COMMUNITY
 IMPACTS OF CLIMATE CHANGE                          ENGAGEMENT
 j   Work with regional and state agencies, and     j   Support grassroots, community-driven
     surrounding communities to align and               climate
     accelerate regional preparedness planning.         action efforts.
 j   Incorporate climate preparedness into          j   Incorporate sustainability into all aspects
     existing local planning and community              of education.
     engagement efforts.
 j   Ensure public- and private-sector
     developments and major capital projects are
     prepared for expected climate change over
     their projected life.

                                                             GREENOVATE BOSTON 2014 CLIMATE ACTION PLAN UPDATE              EXECUTIVE SUMMARY         7
GREENOVATE BOSTON 2014 CLIMATE ACTION PLAN UPDATE - MAYOR MARTIN J. WALSH - Boston.gov
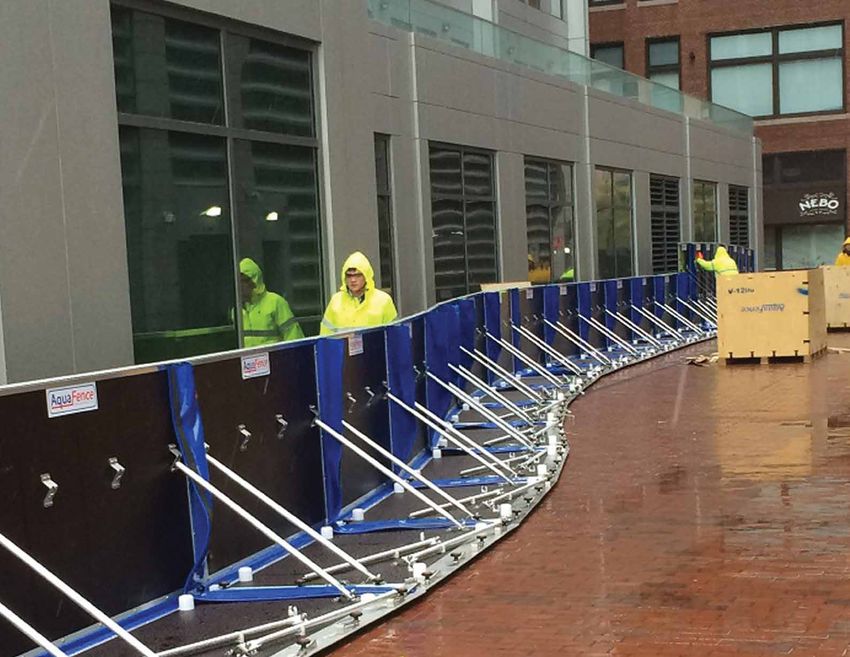
EXECUTIVE SUMMARY continued
FIGURE 2: Boston’s GHG Goals and Targets by Sector

        Greenhouse Gas Reduction:                           Greenhouse Gas Reduction:                              Greenhouse Gas Reduction:
                 2005-2013 = 18%                                   2005-2013 = 21.6%                                         2005-2013 = 8.3%
                     2014-2020 = 8%                                2014-2020 = 12.5%                                         2014-2020 = 17%

          2005                                                    2005                                                2005

          2013                                                    2013                                                2013

          2020                                                    2020                                                2020
                 0     0.5    1    1.5    2                              0   1.25   2.5      3.75                            0       0.5   1    1.5      2

                                                            LARGE BUILDINGS AND
           NEIGHBORHOODS                                                                                               TRANSPORTATION
                                                              INSTITUTIONS (LBI)

                 PROGRESS TO DATE                                  PROGRESS TO DATE                                          PROGRESS TO DATE

       1 Completed 35,858 audits (2009 to 2013)      1 LBI and institutions have decreased energy use by 4.1%   1 Reduced VMTs 0.5% per capita 2005 to 2012
       2    Completed ~18,000 significant actions           2 Steam provides roughly 10% of LBI use             2 Residency rate increased from 35.2% to 37.8%
                       (2009 to 2013)                         3 Installed 14.3 MW of solar citywide                              between 2005 and 2012

                     2020 TARGETS                                    2020 TARGETS                                                2020 TARGETS
                                                        Reduce energy consumption
     72,000 Completed                                   across all BERDO buildings:                                          Improved Fuel Economy
     Home Energy Audits                                 60 million sq. ft. buildings 5%             7%                       Target TBD

                                                        40 million sq. ft. buildings 12.5%
    36,000         Weatherizations,                     20 million sq. ft. buildings 25%
                                                                                                                             5.5% below 2005 VMT
    Heating System Replacements,                       15% energy use from co-generation                                     (Vehicle miles traveled)
    or Other Significant Upgrades                      10 MW of commercial solar

8   GREENOVATE BOSTON 2014 CLIMATE ACTION PLAN UPDATE                 EXECUTIVE SUMMARY
GREENOVATE BOSTON 2014 CLIMATE ACTION PLAN UPDATE - MAYOR MARTIN J. WALSH - Boston.gov
ACRONYMS AND DEFINITIONS

80x50 City of Boston’s goal to reduce GHG emissions             CO2 Carbon dioxide is naturally present in the atmosphere      MAPC Metropolitan Area Planning Council
by 80 percent of 2005 levels by 2050                            as part of the Earth’s carbon cycle—the natural circulation
                                                                                                                               MBTA Massachusetts Bay Transportation Authority
                                                                of carbon among the atmosphere, oceans, soil, plants,
100RC The Rockefeller Foundation’s 100 Resilient
                                                                and animals). CO2 is one of the primary greenhouse gases,      MMBTU Millions of British Thermal Units. MMBTU is
Cities network
                                                                accounting for the majority of all U.S. GHG emissions from     a generic unit of energy that allows apples-to-apples
BHA Boston Housing Authority                                    human activities. The main source of CO2 emissions related     comparisons among different kinds of fuels—for example,
                                                                to human activities is the combustion of fossil fuels (coal,   the amount of electricity versus fuel oil needed to heat
BPHC Boston Public Health Commission
                                                                natural gas, and oil) for energy and transportation.           water, all other things being equal.
BRA Boston Redevelopment Authority
                                                                CO2e/GHGe Carbon dioxide equivalent, which is a term for       Net-zero Building A residential or commercial building
BTD Boston Transportation Department                            describing different greenhouse gases in a common unit.        with greatly reduced energy needs through efficiency
                                                                                                                               gains such that the balance of energy needs can be
BERDO Building Energy Reporting and                             District Energy Local generation and distribution of
                                                                                                                               supplied with renewable technologies—also known as
Disclosure Ordinance                                            thermal and electric energy
                                                                                                                               net-zero—energy building.
BPS Boston Public Schools                                       EEOS Office of Environment, Energy, and Open Space
                                                                                                                               OEM City of Boston’s Office of Emergency Management
C40 C40 Cities Climate Leadership Group                         Emissions Factor A number that determines the amount
                                                                                                                               PV Photovoltaic solar, a technology that generates
                                                                of greenhouse gas emissions generated for every unit of
CAP Climate Action Plan                                                                                                        electricity from sunlight
                                                                fuel consumed. Renewable electricity, for example, effec-
Carbon Footprint The total set of GHG emissions caused          tively has an emissions factor of 0. Natural gas for heating   Resilience The capacity of an individual, community,
directly and indirectly by an individual, organization, event   has a factor of 0.053 metric tons of GHGe/MMBTU, while         or institution to dynamically and effectively respond
or product                                                      electricity in New England has an average factor of 0.123      to change, including unanticipated disruption, while
                                                                GHGe/MMBTU.                                                    continuing to function at an acceptable level.
Carbon Neutrality Achievement of net-zero carbon
emissions by balancing the amount of carbon released with       Greenhouse Gas (GHG) Greenhouse gases are heat-                RGGI The Regional Greenhouse Gas Initiative is a
an equivalent amount through sequestration or offset            trapping gases that lead to global climate change. GHGs        cooperative effort among the states of Connecticut,
                                                                include carbon dioxide (CO2), methane (CH4), nitrous           Delaware, Maine, Maryland, Massachusetts, New
CHP Systems Combined heat and power systems, also
                                                                oxide (N2O), and flourinated gases (hydrofluorocarbons,        Hampshire, New York, Rhode Island, and Vermont to
known as cogeneration, generate electricity and useful
                                                                perfluorocarbons, and sulfur hexafluoride).                    cap and reduce CO2 emissions from the power sector.
thermal energy (heat) in a single generated system. Heat
that is normally wasted in conventional power generation        Greenovate Boston The City of Boston’s community-              USDN Urban Sustainability Directors Network
is recovered as useful energy, which avoids the losses that     wide movement to engage all Bostonians in helping the
                                                                                                                               VMTs Vehicle miles traveled or vehicle miles of travel is
would otherwise be incurred from separate generation of         city reach its climate goals to build a greener, healthier,
                                                                                                                               a measurement of miles traveled by vehicles in a specified
heat and power.                                                 and more prosperous city.
                                                                                                                               region for a specified time period. The United States
Climate Mitigation The collective reduction of                  GRC Green Ribbon Commission                                    Federal Highway Administration (FHWA) compiles monthly
greenhouse gases to slow down and eventually stop                                                                              and yearly VMT statistics nationally and by state.
                                                                USGBC LEED U.S. Green Building Council’s Leadership
disastrous climate change
                                                                in Energy and Environmental Design system for rating
Climate Preparedness Preparing for the near- and long-          and certifying green buildings.
term vulnerabilities to the natural and systemic impacts
                                                                LBI Large Buildings and Institutions
of climate change. This term is used synonymously with
climate adaptation.

                                                                 GREENOVATE BOSTON 2014 CLIMATE ACTION PLAN UPDATE                           ACRONYMS AND DEFINITIONS                     9
GREENOVATE BOSTON 2014 CLIMATE ACTION PLAN UPDATE - MAYOR MARTIN J. WALSH - Boston.gov
INTRODUCTION

Climate change presents one of the greatest chal-
lenges of our time, for both Boston and the world. The                                                                         What is Climate Preparedness?
Greenovate Boston 2014 Climate Action Plan Update                                                                              Climate preparedness ensures that our community
lays out concrete steps and a vision for Boston to play                                                                        is ready to live with the changes that have already
its part in reducing global greenhouse gases (GHG),                                                                            occurred and those that are coming in the next
while preparing for the impacts of climate change that                                                                         hundred years. Also known as climate adaptation
are already occurring, as well as those that will occur                                                                        or climate resilience, climate preparedness
in the next 100 years.                                                                                                         involves modifications that can be made to
                                                                                                                               the built environment—our buildings, roads,
This Plan does not represent the beginning or the end                                                                          water pipes, and electrical cables—as well as
of Boston’s climate action efforts. Across the entire                                                                          to our “green infrastructure”—the types of trees
city, from the neighborhoods, to the private sector, to                                                                        planted, the space given to brooks and rivers,
City government, significant progress has been made.                                                                           and the shape of the landscape. Furthermore,
                                                                                                                               preparedness applies to the social and economic
Plummeting solar prices are accelerating residential
                                                                                                                               environment, how and when businesses operate,
and commercial installations across the city. In addi-
                                                                                                                               how well neighbors know each other, and what
tion, more than 32,000 homes in Boston, the equivalent
                                                                                                                               resources are available to help those in need.
of 12 percent of all homes in the city, have received     More than 500 residents, businesses, and community leaders from
their no-cost energy assessments. Large buildings         all over Boston participated in the first Greenovate Boston Commu-
have made substantial headway in cutting energy use,      nity Summit held on May 31, 2014.
and district energy planning efforts are underway. The
                                                                                                                               City of Boston:
City has accelerated its climate preparedness efforts     The Greenovate Boston 2014 Climate Action Plan
                                                                                                                               Leading by Example
with, for example, a municipal vulnerability assess-      Update builds upon this progress, setting a clear path
                                                                                                                               j   #1 city for energy efficiency programs and
ment, the launch of an international design competi-      for reaching Boston’s 2020 GHG goals, creating a vision                  policies in the country, 2013 (American Council
tion, and the incorporation of climate preparedness in    for a carbon-neutral city, and preparing Boston for the                  for an Energy Efficient Economy)
development design review.                                impacts of climate change.                                           j   #3 walkable city in the U.S., 2014 (WalkScore)
                                                                                                                               j   Invited to join C40 Cities Climate Leadership
                                                                                                                                   Group, 2014
                                                                                                                               j   Recognized by the Obama Administration as a
                                                                                                                                   Climate Action Champion, 2014
                                                                                                                               j   Selected by the Rockefeller Foundation to join
                                                                                                                                   100 Resilient Cities, 2014

10   GREENOVATE BOSTON 2014 CLIMATE ACTION PLAN UPDATE                          INTRODUCTION
INTRODUCTION continued

STATE OF THE CLIMATE                                        j   Boston has been ranked the eighth most-at-risk
The Earth’s climate is changing, and evidence of                coastal city in the world in terms of annual eco-
man-made climate change has increased in the past               nomic impact from projected flooding.7
few years.1                                                 j   Sea-level rise in Boston is likely to be greater than
                                                                the global average because Boston’s land is sub-
j   2012 was the second costliest year in U.S. history
                                                                siding, or sinking, at about six inches per century,
    for natural disasters, amounting to $110 billion in
                                                                and changing ocean currents and other features
    damages.2
                                                                are affecting the distribution of ocean water.8
j   Global annual average temperature has increased
                                                            j   By 2047, Boston’s coldest years will likely be
    more than 1.5 degrees Fahrenheit since 1880
                                                                warmer than the warmest years Boston has
    (through 2012).3
                                                                experienced since 2005.9
j   Globally, 2014 was the hottest year on record.4
                                                            j   In the past 24 months, Boston experienced four
j   Minimum Arctic sea ice extent, which occurs                 near-miss 100-year floods: Superstorm Sandy,
    in early to mid-September, has decreased by more            Winter Storm Nemo, and two other Nor’easters.
    than 40 percent since satellite records began
                                                            j   Boston’s coastal neighborhoods and the majority
    in 1978.5
                                                                of the Harbor Islands would flood if sea level rises
j   Global average sea level was 1.5 inches above               five feet—equivalent to Superstorm Sandy hitting
    the 1993-2010 average in 2013. The rise has                 Boston at high tide.10
    accelerated to the rate of one-eighth of an inch
                                                            j   By the end of the century, Boston may experience
    per year.6
                                                                up to 62 days above 90 degrees Fahrenheit, up
                                                                from the current average of 10 days.11
Impacts to Boston                                                                                                       An artist’s depiction of future sea-level rise in Boston.
Many projections indicate that the average annual tem-
                                                            National and International Progress
perature in the Northeast will rise between three and
                                                            Although these facts show the challenges presented
ten degrees Fahrenheit by the 2080s. Climate change
                                                            by climate change, this Plan exemplifies the many
may also result in more intense and concentrated
                                                            ways in which cities are leading by example. Recent
bursts of precipitation (e.g., rain and snowfall), though
                                                            developments at the international and national levels,
they may be less frequent. Boston, as a coastal city, is
                                                            such as new regulations for power plants, and interna-
particularly vulnerable and at high risk to climate
                                                            tional agreements, hold promise for protecting the
impacts.
                                                            planet for present and future generations.

                                                                                GREENOVATE BOSTON 2014 CLIMATE ACTION PLAN UPDATE                                INTRODUCTION       11
INTRODUCTION continued

                                                        FIGURE 3: The Greenhouse Gas Effect
     Sharing Best Practices
     Boston is sharing lessons learned through a
     variety of national and international networks.
     Boston has long been a part of the Urban
                                                                                                                                                                        Reflected
     Sustainability Directors Network (USDN),                                                                                                                             Solar
     a member group of more than 120 North                                                                                                                              Radiation
     American cities dedicated to promoting peer-
     to-peer learning, funding scalable projects, and
     expanding access through regional networks.
     More recently, Boston joined the C40 Cities
     Climate Leadership Group, an invitation-only
                                                                                                                       Build-Up of
     global network of cities on the front line of
                                                                                                                        CO2 in the
     preparing for and helping to prevent climate                                                                      Atmosphere
     change. Cities are invited to join the C40 based
                                                                                                                                                                   Solar Radiation
     on population size, economic output, and
                                                                                                                                                                 Absorbed by Earth’s
     commitment to and leadership in taking action                                                                                                                  Atmosphere
     on climate change. Boston’s participation in
     the C40 will open up greater opportunities for
     sharing what the City has done and benefiting                                                              Trapped
     from insights and partnerships with cities in                                                                Heat
                                                                                                                                                        Solar Radiation
     the C40’s global network.                                                                                                                         Warms the Earth’s
                                                                                                                                                            Surface

                                                               OIL AND PETROLEUM                             CFCs                            OIL, COAL, AND GAS FOR
                                                                     ENGINES                                                                ELECTRICITY AND HEATING

                                                        A build-up of CO2 in the atmosphere causes heat to be trapped in the Earth’s atmosphere, instead of escaping.

12     GREENOVATE BOSTON 2014 CLIMATE ACTION PLAN UPDATE                      INTRODUCTION
ABOUT THE PLAN

Boston’s GHG reduction goals of 25 percent by 2020                As new priorities, the 2014 Plan also incorporates:
and 80 percent by 2050 below 2005 levels were recom-
                                                                  1. More comprehensive climate preparedness
mended by the community and adopted by the City of
                                                                     strategies;
Boston in the 2011 Climate Action Plan, A Climate of
                                                                  2. Cross-cutting themes including social equity, eco-
Progress. This plan set forth that Boston would incor-
                                                                     nomic development, and public health and safety;
porate climate projections into all formal planning and
project review processes, engage all segments of the              3. More extensive and inclusive community
community in climate action, and develop innovative                  engagement;
businesses and workforce skills to take advantage of              4. An updated, more rigorous greenhouse gas
climate action opportunities. The 2014 Plan will also                inventory and projections;
continue its progress on these principles.                        5. A look at Boston’s 80 percent by 2050 GHG
                                                                     reduction goal (80x50);
   GHG by
FIGURE  4:Sector (Fig. 3+5 / graph
           GHG Emissions           2)
                               by Sector, 2013                    6. A website that tracks implementation,
                                                                     performance measures, and lessons learned.
                                                                                                                          Flooding in Christopher Columbus Park on the Boston waterfront
                                                                  After detailing these new features, the rest of the
                                                                                                                          during Nor’easter Hercules, January 3, 2014.
                                                                  plan will be outlining key strategies and actions
                                  20.9%                           for five sections:
               26.9%            Residential
           Transportation                                         j   Neighborhoods                                          Go Boston 2030
                                                                  j   Large Buildings and Institutions                       Go Boston 2030 is a City of
                                                                  j   Transportation                                         Boston initiative to envision a
                         52.2%                                                                                               bold transportation future for
                       Commercial
                                                                  j   Climate Preparedness                                   Boston for the next 5, 10, and
                                                                  j   80x50                                                  15 years. The plan will develop a far-reaching
                                                                                                                             vision that proposes transformative policies and
                                                                                                                             projects to improve transportation for the City’s
                                                                                                                             residents, businesses, and visitors. The two-
Commercial emissions account for over 50% of our GHG
                                                                                                                             year process will be driven by data and steered
emissions, though because of the way data is reported, the
                                                                                                                             through an unprecedented and inclusive public
commercial wedge usually includes emissions for large
                                                                                                                             engagement process. Much of the details of the
residential buildings. Transportation and residential emissions
                                                                                                                             transportation strategy will be developed under
accounted for 7% and 1% of emissions, respectively.
                                                                                                                             Go Boston 2030.

                                                                                   GREENOVATE BOSTON 2014 CLIMATE ACTION PLAN UPDATE                         ABOUT THE PLAN                13
ABOUT THE PLAN continued

FIGURE 5: BOSTON’S CLIMATE ACTION TIMELINE 2011-2014
Boston has made significant progress on many of the actions from the 2011 Climate Action Plan. Below is summary of these actions and their status.
The timeline highlights the work that has been done in each of these areas.

BUILDINGS AND ENERGY SOURCES                                 TRANSPORTATION                                                ADAPTATION                                                     Support a citywide awareness campaign
     Renew Boston and Electric Utility Efficiency               Federal/State Mileage and GHG Standards                       Give adaptation the same priority as mitigation             Equip individuals to take action
     Programs                                                   Vehicle Miles Traveled Reduction Strategies                   Assess vulnerability                                        Continue to lead by example
     Renewable Portfolio Standard                               Mass Transit/Parking                                          Remain flexible
                                                                                                                                                                                       IMPLEMENTATION
     Renew Boston and Gas Utility Efficiency Programs           Car Sharing                                                   Include climate change in all planning and review
                                                                                                                                                                                          Secure sufficient human and financial resources
     Appliance Standards                                        Bike Programs                                                 Review impacts on existing programs and
                                                                                                                                                                                          Develop a detailed plan and monitor
     Building Codes                                             Behavior Change—Transportation                                infrastructure
                                                                                                                                                                                          implementation
     Energy Efficiency Retrofit Ordinances                      Low-Carbon/Renewable Fuel Standards                        ECONOMY
     Behavior Change—Buildings                                  for Gasoline and Diesel                                       Promote good green jobs                                           Implemented or Completed
     Oil Heat Efficiency Program                                Anti-Idling                                                   Promote economic equity                                           In progress
     Benchmarking and Labeling                               SOLID WASTE                                                   COMMUNITY ENGAGEMENT                                                 Not implemented
     Low-Carbon Standard for Heating Fuels                      Commercial Solid Waste Reduction                              Promote climate action at the neighborhood level
     Stretch Code or equivalent                                 Residential Solid Waste Reduction                             Collaborate with community in program
     Cool Roofs                                                                                                               development and implementation

                                                      2012                                MAY 2012                                         2013                                                                        JUN 2013
                                                   State launches                    Boston participates in first                      BPS completes
                                                                                                                                                                               MAY 2013
        CLIMATE OF                                                                                                                                                         DPW increases recycling              Renew Boston launches Whole
                                               RecyclingWorksMA to                      Solarize program and                     implementation of single
        PROGRESS                                                                                                                                                            collection in downtown                Building Energy Incentive,
                                              provide waste reduction                  achieves more than 100                    stream recycling program
         RELEASED                                                                                                                                                              neighborhoods to                    offering up to 90% off of
                                             assistance for businesses                rooftop solar installs in a                  to all 130 schools and
           2011                                                                                                                                                                  twice a week.                      weatherization costs.
                                                  and institutions.                      four-month period.                      administrative buildings.

                                   2011                                  APR 2012                                   AUG 2012                                 MAY 2013                                MAY 2013
                        With DPWs “Recycle More”                   BPS youth Recycling                    Federal government finalizes               Greenovate Boston launches              City passes Building Energy
                         single-stream recycling                Ambassadors host an Earth                  new corporate average fuel                   with a citywide media                 Reporting and Disclosure
                       campaign, Boston residents               Day event to educate Boston               economy standards. By 2025,                campaign and a new website             Ordinance (BERDO). Discloses
                      recycle close to 30,000 tons—              Properties tenants about                 the average new vehicle must                   to enable and inspire               municipal energy use for the
                         45% more than in 2009.                          recycling.                        get 54.5 miles to the gallon.               residents to take action.                      first time.

14      GREENOVATE BOSTON 2014 CLIMATE ACTION PLAN UPDATE                                                  ABOUT THE PLAN
ABOUT THE PLAN continued

                                                                                                  SEP 2013
      JUN 2013                                SUMMER 2013                                  City releases Boston Bike                         JAN 2014                                      MAY 2014
 Boston 500 achieves more
                                              Greenovate Boston brings                     Network Plan, providing a                    RGGI lowers the regional                     Greenovate Boston hosts
                                                                                                                                                                                                                                   JUN. 2014
than 500 energy assessment                                                                 vision to reach a 10% bike                                                                                                            Greenovate Boston
                                               Cool Globes, a renowned                                                                   cap on GHG emissions                        first Community Summit
  sign-ups in one day with                                                                  mode share by 2020 and                                                                                                              hosts first community
                                              climate change art exhibit,                                                              from electric power plants                       with over 500 people
participation from more than                                                                    350 miles of bike                                                                                                                     yard sale.
                                                      to Boston.                                                                                by 45%.                                    in attendance.
40 community organizations.                                                                  infrastructure by 2030.

                                                                     SUMMER 2013                                                                                        APR 2014                               JUN 2014
                           JUL 2013                                Boston Bikes Roll it Forward                         FALL 2013                                Mayor Walsh appoints                       EPA proposes the
                                                                     program breaks record,                         City launches first                         Boston Mobility Advisory                 Clean Power Plan to cut
                         Hubway surpasses
                                                                     distributing 1,081 bikes.                   compost drop-off pilot at                       Committee to envision                   carbon emissions from
                       the 1 million ride mark.
                                                                      City installs 8 0th mile                   select farmers’ markets.                         the City’s long-term                    existing power plants
                                                                            of bike lane.                                                                        transportation future.                    across the country.

                                                   NOV 2014
      NOV 2014                                China and the U.S. sign                            OCT 2014                                    OCT 2014
 Greenovate Boston hosts                     landmark deal on climate                     100th whole building retrofit                 For the first time in MBTA
                                                                                                                                                                                           SEP 2014                           SUMMER 2014
                                                                                                                                                                                    Mayor Walsh re-launches                    DPW expands leaf and
   Mayor’s second Civic                   change, with China agreeing to                  completed under the Renew                    history, ridership in a single
                                                                                                                                                                                    community compost pilot                   yard waste collection into
 Academy on the Climate                   peak GHG emissions by 2030,                    Boston Whole Building Energy                     month tops 37 million
                                                                                                                                                                                       with Project Oscar.                          the summer.
   Action Plan Update.                     while expanding clean energy                           Incentive.                                 passenger trips.
                                            research and development.

                                                                            OCT 2014
                           NOV 2014                                     Hubway announces                                                                                SEP 2014                               AUG 2014
                            Renew Boston                           bike share system will extend                        OCT 2014                              Hundreds of Bostonians join
                                                                                                                                                                                                           DND Main Streets and
                                                                        through December.                               State implements                                                                   NSTAR’s Direct Install
                              surpasses                                                                                                                      approximately 400,000 people
                                                                                                                        commercial food                                                                programs surpass 1,000 small
                             6,000 home                             Truck side guard ordinance                                                               in the People’s Climate March
                                                                                                                           waste ban.                                                                    businesses participating in
                           weatherizations.                            is passed to enhance                                                                         in New York City.
                                                                                                                                                                                                         energy efficiency program.
                                                                           cyclist safety.

                                                               Building and Energy Sources                 Transportation             Waste Reduction                   Community Engagements

                                                                                                              GREENOVATE BOSTON 2014 CLIMATE ACTION PLAN UPDATE                                                       ABOUT THE PLAN                       15
ABOUT THE PLAN continued

                                                                                                                                              Ready, Be Safe, Stay Healthy campaign. Going forward,
FIGURE 6: Climate Preparedness Timeline
                                                                                                                                              the recent designation of Boston as a Rockefeller 100
                                                                                                                                              Resilient Cities (100RC) initiative will allow for a
                                                                                                                                              broader social resilience effort.
                   2013                                                                             DEC 2013
           City’s Hazard Mitigation                                                                                                           The second principle holds that the benefits of GHG
                                                                                              BRA requires all projects
               Plan incorporates
                                                          JUL 2013                             to analyze impacts of                          reduction must be shared equally. Efforts to reduce
            climate impacts, BWSC
                                                      Building Resilience                      climate change in the
          25-year asset management                                                                                                            GHG emissions can also improve social equity by bring-
                                                  in Boston Report released                        review process
                plan, Parks plan
                                                                                                                                              ing additional services and programs to those who
                                                                                                                                              need them most. For example, Action for Boston Com-
                                                                                                                                              munity Development (ABCD), funded in part by federal
                                                                                                                                              fuel assistance programs, has completed more than
                                      FEB 2013                                OCT 2013
                                    In the wake of                                                                                            5,500 audits and nearly 11,000 weatherizations or heat-
                                                                         City releases report,
                                Hurricane Sandy, the
                                                                        Climate Ready Boston:                                                 ing system upgrades in low-income households.
                                City announces set of                                                                      2014
                                                                       Municipal Vulnerability to                                             Another example is the expansion of Hubway bike shar-
                             preparedness actions under                                                            Living With Water Design
                                                                           Climate Change
                                Climate Ready Boston                                                                      Competition         ing stations and adequate bike facilities in all
                                                                                                                                              neighborhoods.

                                                                                                                                              On a global level, climate action and social equity are
                                                                                                                                              strongly linked. Developed nations are responsible for a
CROSS-CUTTING THEMES                                                          disproportionately impacted by climate hazards. The             majority of the world’s carbon emissions, yet developing
                                                                              second principle holds that benefits from climate miti-         countries and their populations are often the most vul-
Each section of the plan recognizes the cross-cutting
                                                                              gation and preparedness efforts should be shared                nerable. On the local level, climate change, if unad-
themes of economic development, social equity, public
                                                                              equally among all groups of people.                             dressed, will disproportionately affect Boston’s most
health and safety, and community engagement.
                                                                                                                                              vulnerable populations. With equity as a guiding princi-
Whereas each action details what the City intends to                          As sea level rise and heat waves increase the threat to         ple, Boston will demonstrate that cities can thrive while
do, these themes answer the question of how these                             human health, the wellness and resilience of vulnerable         transitioning away from a carbon-based economy.
actions should be implemented and how they contrib-                           populations must be prioritized. Boston Public Health
ute to the City’s broader goals.                                              Commission (BPHC), Office of Emergency Manage-                  Economic Development
                                                                              ment (OEM), and other City departments are working              Climate action is inherently local, and through efforts
Social Equity
                                                                              together and with the community to increase commu-              such as energy efficiency, local, renewable energy
The 2014 Update will be implemented with two guiding
                                                                              nity resilience related to both environmental and social        installations, waste recovery, and local agriculture,
principles around social equity. Inspired by the environ-
                                                                              stresses. The BPHC, for example, provides a number              climate action can create safe jobs with living wages
mental justice movement, the first principle holds that
                                                                              of community preparedness resources through its Get             that cannot be exported overseas. From 2010 to 2014,
minority and low-income communities must not be

16   GREENOVATE BOSTON 2014 CLIMATE ACTION PLAN UPDATE                                                 ABOUT THE PLAN
ABOUT THE PLAN continued

jobs in the clean energy sector in Massachusetts grew       Public Health and Safety
by 47 percent, approximately 28,000 jobs.12 In addition     Meeting people’s basic needs, such as clean air and
to jobs traditionally associated with the green econ-       water, access to healthy food, safe and healthy homes,
omy, a diverse array of sustainability-related goods and    and safe places to play and exercise, all require that we
services, from construction to consumer goods               take care of our environment and our communities.
and food, have seen increasing demand and higher            Making this connection between climate change and
margins. Climate action could be a major driver of          public health is crucial, given that many Bostonians
growth in the Massachusetts economy, and Boston             face basic health and safety challenges on a daily
has a key role to play in shaping this growth to be equi-   basis. Community trauma in any form—from the Bos-
table and sustainable.                                      ton Marathon bombing to violence in our neighbor-
                                                            hoods—has profound impacts on individuals. The strat-
Economic development in Boston is also an important
                                                            egies and actions in the Climate Action Plan will help
strategy to reduce overall GHG emissions. Bostonians,
                                                            all Bostonians satisfy these basic needs, while creating
when compared with suburban residents, have a much                                                                      By participating in the Food Project, Boston youth learn about
                                                            a greener, more sustainable city.
lower carbon footprints. They are more likely to take                                                                   sustainable agriculture and gain a personal connection to the issues
public transportation, bike, or walk to work. Homes and     Boston has been praised for the clean-up of the Charles     of food justice.
offices in the city also tend to be smaller, resulting in   River and the Boston Harbor, but the city still faces
less energy use for heating and cooling.                    many other environmental health issues such as
                                                            asthma triggered by poor air quality. Efforts to green
Cities make it easy for people to connect to one
                                                            Boston’s buildings goes beyond energy efficiency to
another, providing not only social and cultural benefits,
                                                            include improving indoor air quality, which can help
but also enabling shared resources. In a city, not every-
                                                            address asthma incidence. Urban farming provides
one needs their own car, bike, or even backyard. These
                                                            healthy, local food, as well as connecting people to
resources are shared among neighbors through, for
                                                            their community and environment. From the built envi-
example, the Hubway bike-sharing program and Bos-
                                                            ronment to the outdoors, climate action can lead to
ton’s parks. Technology also makes sharing easier,
                                                            healthier environments for us all.
expanding the possibilities for exchanging everything
from tools to recreational equipment and small kitchen
appliances.

                                                                             GREENOVATE BOSTON 2014 CLIMATE ACTION PLAN UPDATE                              ABOUT THE PLAN                17
ABOUT THE PLAN continued

                                                                      How we prepare for climate change, or don’t, will also     that all Bostonians will have ownership of the plan and
                                                                      impact the health and safety of our communities. Heat      be empowered to implement it.
                                                                      waves, for example, are the deadliest disasters in the
                                                                                                                                 The 2014 Update process included a Steering Commit-
                                                                      U.S. Warmer weather will also mean increased expo-
                                                                                                                                 tee, appointed by Mayor Martin J. Walsh to advise the
                                                                      sure to potentially harmful diseases that are spread
                                                                                                                                 City. The Steering Committee consisted of representa-
                                                                      through insects, such as West Nile virus.
                                                                                                                                 tives from all sectors of the community, including busi-
                                                                      Health policymakers at the Boston Public Health Com-       nesses, advocacy groups, research institutions, and
                                                                      mission are working on health in holistic, systemic        City officials. The Steering Committee was supported
                                                                      ways. BPHC’s Health in All Policies, for example, abides   by strategy subcommittees for each section of the
                                                                      by two principles. First, it incorporates health consid-   Plan—Neighborhoods, Large Buildings and Institutions
                                                                      erations into decision-making across all the agencies      (LBI), Climate Preparedness, and 80x50. The Large
                                                                      and organizations that influence community design,         Buildings and Institutions subcommittee largely con-
                                                                      including transportation and development. Second, it       sisted of the Green Ribbon Commission’s Commercial
                                                                      engages residents, who best understand the commu-          and Industrial working group. The Go Boston 2030
                                                                      nity context, into these processes.                        Steering Committee constituted the transportation
                                                                                                                                 subcommittee.
                                                                      The Plan incorporates BPHC’s approach and aims to
                                                                      proactively address public health and safety issues we     Community engagement will remain a priority through-
                                                                      face today, as well as those we’ll face in the future.     out implementation. The Green Ribbon Commission
                                                                                                                                 will continue to lead stakeholder engagement in the LBI
                                                                      Community Engagement
                                                                                                                                 sector for both climate mitigation and preparedness
                                                                      In 2010, Boston’s Climate Action Leadership Commit-
                                                                                                                                 The Neighborhoods subcommittee will continue to
                                                                      tee and Community Advisory Committee made clear
                                                                                                                                 meet regularly to work on implementing climate action
                                                                      that community engagement must be a critical com-
In 2011, a 365-foot wind turbine was installed in Charlestown. It                                                                in the neighborhoods.
generates 3 million kilowatt hours per year and provides a $300,000   ponent of Boston’s Climate Action Plan. The commu-
annual savings in electricity costs. The project was funded through   nity’s summary report, Sparking Boston’s Climate Revo-
the American Recovery and Reinvestment Act (ARRA).                    lution, stated that, “Because the costs of inaction are
                                                                      high, because Boston has ambitious goals, effective
                                                                      climate action requires the help of every Bostonian.”
                                                                      With this in mind, the City of Boston involved the com-
                                                                      munity from the onset of the 2014 Update process so

18    GREENOVATE BOSTON 2014 CLIMATE ACTION PLAN UPDATE                                 ABOUT THE PLAN
BOSTON’S CARBON FOOTPRINT

Since 2005, the City of Boston has been measuring its
GHG emissions with data from Boston utilities, fuel oil                                                                   2014 Update Community
data, and modeled transportation data. Data collection                                                                    Participation by the Numbers
methods and availability have steadily improved, and                                                                       j    More than 700 people participated online
the City has revised its inventory process over the past                                                                        through Engage.GreenovateBoston.org.
year.13                                                                                                                    j    Approximately 300 people attended meet-ups
Since 2005, Boston’s emissions have declined by                                                                                 hosted by community groups.
approximately 17 percent, from 7.44 to 6.13 million                                                                        j    More than 500 people attended Greenovate
metric tons of CO2e (carbon dioxide equivalent—a                                                                                Boston’s first community summit, held in
standard unit for measuring GHG emissions.). This                                                                               May 2014.
reduction is equivalent to taking 120,000 homes off the
grid for one year.                                         Members of the Boston the Green Ribbon Commission meet to
                                                           address climate change issues.                              FIGURE 7: GHG Emissions by Fuel Type, 2013
Additionally, per capita emissions has decreased from
                                                                                                                                   GHG by Fuel Type (Fig. 7 / graph ghgfuel)
12.7 CO2e per person in 2005 to 9.5 in 2013. This
decrease has occurred despite the increase in popula-
tion and jobs in Boston.                                      The Green Ribbon Commission
                                                              The Boston Green Ribbon Commission, formed
                                                                                                                                             25.8%
For the first time, each sector has been assigned a spe-      in 2011 and now co-chaired by Mayor Walsh, is a                             Gasoline and
cific GHG reduction goal, as well as targets for program      group of business, institutional and civic leaders                             Diesel               36.4%
                                                                                                                                                                Electricity
participation in order to achieve the goal.                   in Boston working to develop shared strategies
                                                              for fighting climate change in coordination                  3.1%
                                                              with the City’s Climate Action Plan. Many cities            Steam
                                                              have produced similar plans. But few have also                                            26%
                                                                                                                                8.7%
                                                              enlisted the support and leadership of the local                                       Natural Gas
                                                                                                                               Fuel Oil
                                                              business community as effectively as Boston.
                                                              With five working groups—Commercial Real
                                                              Estate, Health Care, Higher Education, Climate
                                                              Preparedness, and Transportation—the Green               Electricity makes up the largest share of Boston’s GHG emissions,
                                                              Ribbon Commission is a platform for Boston’s             but its percentage of the pie has steadily declined since 2005. By
                                                              institutional and business leaders to prepare            2020, steam from co-generation should make up a much larger
                                                              the city for climate change while reducing our           percentage.
                                                              greenhouse gases.

                                                           GREENOVATE BOSTON 2014 CLIMATE ACTION PLAN UPDATE                              BOSTON’S CARBON FOOTPRINT                   19
BOSTON’S CARBON FOOTPRINT continued

        FIGURE 8: GHG Progress and Goals by Fuel Type,                                                       FIGURE  9: PervsCapita
                                                                                                                Per Capita           vs.Emissions
                                                                                                                              Total GHG  Total GHG   Emissions,
                                                                                                                                                  (Fig. 7/ graph 3)
           Boston GHGs by Fuel (Fig. 6 / graph 1b)
        2005–2013                                                                                            2005–2013                                                                            Per Capita Emissions
                                                                                                                                                                                                  Boston’s carbon reduction has outpaced
                                                                                                                                        0

                                                                                                     Metric Tons Per Boston Resident
                                                                                                                                                                                                  the city’s growing population and economy.
                                  8
Millions of Metric Tons of GHGe

                                                                                                                                                                                                  However efforts to reduce our energy
                                                                                                                                       -10                                                        use and carbon footprint have more than
                                  6
                                                                                                                                                                                                  accommodated this growth. As a result,
                                                                                                                                       -20                                                        emissions per person in Boston have decreased
                                  4                                                                                                                                                               from 12.7 CO2e per person in 2005 to 9.5 in
                                                                                                                                       -30                                                        2013. Without this growth, total GHG emissions
                                  2                                                                                                                                                               would have decreased by nearly 25 percent.

                                                                                                                                       -40                                                        Among U.S. cities, Boston has one of the
                                  0                                                                                                          2006 2008     2010 2012 2014 2016        2018 2020   lowest emissions per capita. New York City
                                      ‘05 ‘06 ‘07 ‘08 ‘09 ‘10 ‘11 ‘12 ‘13     Year       2020 2050
                                                                                                                                                                                                  has lower per capita emissions at 6.4, largely
                                                                                                                                       % Change Per Capita         2020 Per Capita Goal           due to its denser population and high public
                                  Electricity Progress    Progress               Total Progress                                        % Change Total Emissions    2050 Per Capita Goal           transportation use. However, European cities
                                  Natural Gas             Fuel Oil Progress      (-CNG)
                                  Progress                                       Total 2020 Goal
                                                                                                                                                                                                  such as Copenhagen and Stockholm have
                                                          Steam Progress
                                  Gas and Diesel                                 Total 2050 Goal             Per capita emission reductions have outpaced absolute emissions                      achieved much lower emissions per capita—4.7
                                                                                                             reduction. If there had been no growth, emissions would have                         and 3.3, respectively, due to both high energy
        A cleaner electric grid and a steady shift away from oil have driven                                 decreased 24.9%. Growth added roughly 7% to GHG emissions                            efficiency, clean electricity generation, and low
        GHG reductions. Though emissions increased slightly in 2013, in                                      between 2005 and 2013.                                                               rates of driving. This proves that low-carbon
        part due to a colder winter, GHG emissions from heating fuels still                                                                                                                       cities with an exceptionally high standard of
        remain substantially lower than in past years (in terms of weather,                                                                                                                       living are possible.
        2013 was comparable to 2007).

        20                            GREENOVATE BOSTON 2014 CLIMATE ACTION PLAN UPDATE                                                                  BOSTON’S CARBON FOOTPRINT
BOSTON’S CARBON FOOTPRINT continued

UNDERSTANDING THE TRENDS                                   Source of Reductions, 2005-2013 (Fig. 8/ graph 4)
                                                           FIGURE 10: Sources of GHG Reductions, 2005-2013
Approximately 40 percent of the reduction in Boston’s
GHG emissions comes from the generation of cleaner
electricity. By replacing coal and oil with natural gas,
                                                           Cleaner Electricity (EF)*
New England power plants are now producing fewer           Cleaner Steam (EF)
GHGs.
                                                           Electricity Use
Cap and trade initiatives under the Regional Green-
                                                           Heating: Oil Use
house Gas Initiative (RGGI), are expected to continue
making Boston’s power supply cleaner and less carbon       Heating: Natural Gas Use
intensive. Going forward, however, these reductions are
                                                           Heating: Steam Use
expected to be at a much slower rate than seen from
2005 to 2013.                                              Better MPG (Fuel Economy)
A significant amount of heating fuel oil has also been     Less Driving (VMTs)
replaced with lower-carbon natural gas. As heating sys-                                              0                   -150                  -300                  -450                  -600
tems are upgraded or replaced, they become much
more energy efficient. As a result, overall energy use                                                                Thousand Metric Tons of GHG Reductions
for heating is decreasing.

Weather also impacts the amount of energy needed to        Over 40% of past reductions were due to cleaner, less carbon-intensive sources of electricity and steam, as power plants have switched
                                                           from coal and oil to gas.
heat buildings. A warmer than usual winter in 2012
resulted in a decrease of GHG emissions specifically       Emissions Factor (EF) denotes the amount of GHGs generated for each unit of energy.
from heating fuel sources. Not only does colder
weather require more energy for heating, but it also
drives up natural gas prices, which often lead power       While most energy and GHG trends are heading in the
plants to switch to oil, as seen in 2013.                  right direction, continued progress will require further
                                                           action. Clean, local generation and energy efficiency
Transportation emissions are declining despite the
                                                           must play a much larger role in reducing emissions,
increase in jobs and commuters in Boston. Miles driven
                                                           if Boston is to reach its 2020 GHG reduction goal.
in Boston has remained relatively constant because
                                                           A fuller discussion of trends can be found online at
the average number of miles driven per person has
                                                           GreenovateBoston.org.
declined. New fuel standards have improved the fuel
economy of cars and trucks in Boston. It is expected
that these federal standards alone will continue to
reduce GHG emissions from transportation by approxi-
mately 1.8 percent per year.

                                                           GREENOVATE BOSTON 2014 CLIMATE ACTION PLAN UPDATE                                      BOSTON’S CARBON FOOTPRINT                         21
BOSTON’S CARBON FOOTPRINT continued

TRACKING PROGRESS
                                                           FIGURE 11: Performance Measurement, An Example: Residential Sector
The City will implement an online performance mea-
surement system with data updated annually and quar-
terly at GreenovateBoston.org. The performance mea-
surement system will track Boston’s GHG emissions,                                                     GHG TARGETS
                                                                                                   Based on past performance,
strategies, actions, and program participation. Going
                                                                                                     the residential sector’s
forward, the website will expand to include additional
                                                                                                     GHG reduction target is
measures and targets around tree planting, equity, and
climate preparedness.                                                                                   100,000
                                                                                                   METRIC TONS OF GHGS
GHG Targets
In order to create targets for reaching Boston’s                      Are we on track?
25 percent by 2020 goal, the City incorporated:                  GHG emissions should be                                                    Boston’s electricity is
                                                               going down. If not, the target,                                           still getting cleaner so not
1. Remaining GHG emissions reduction needed                                                                                             everything has to come from
                                                                 strategy, and actions may
   between 2014 and 2020;                                              need to adjust.                                                         energy efficiency.
2. Macro trends (such as changes in the electric grid
   and population growth);
3. Past program participation trends.

Transportation has the highest percentage reduction                STRATEGIES
target of 17 percent because of the reductions that are           AND ACTIONS                                                             PARTICIPATION
                                                                36,000 is a big number.                                                        Boston needs
expected to occur due to new federal fuel economy
standards. Nearly every new car in 2025 will be a elec-
                                                                  To reach this goal,
                                                                                                                                             36,000
tric hybrid of some sort. The LBI proportion is also                   NEW                                                                  HOUSEHOLDS TO
                                                                                                                                              TAKE ACTION
higher because of the sectors, demonstrated ability to                PROGRAMS
                                                                                                                                        on energy efficiency – solar
make significant reductions over the past eight years.         will need to target renters
                                                                                                                                         panels, heating systems,
Lastly, Neighborhoods has a goal of 8 percent. This               and large apartment
                                                                                                                                            and weatherization.
                                                                       buildings.
lower allocation is due to existing challenges in the
residential sector. For example, in some cases, land-
lords are responsible for making energy improvements
to a triple-decker or apartment building, but only ten-
                                                                                                   The City is tracking and reporting
ants reap the benefits through energy savings on their                                                  these actions quarterly
utility bills. This means landlords are unlikely to make
energy improvements.

22   GREENOVATE BOSTON 2014 CLIMATE ACTION PLAN UPDATE                         BOSTON’S CARBON FOOTPRINT
BOSTON’S CARBON FOOTPRINT continued

    Greenhouse
 FIGURE            Gas Intensity
        12: GHG Intensity           of Energy
                          of Energy Fuels                      Use (Fig. 10 / graph 6)                    FIGURE 13: Vehicle Miles Traveled vs. Fuel Economy, 2005–2013
                                                                                                                                  Boston’s VMT va. Fuel Economy (Fig. 11/ graph 7)
               0.16

                                                                                                                                   3.10                                                      18.00

                                                                                                                                                                                                         Fuel Economy (miles per gallon)
               0.12
mtGHGe/MMBTU

                                                                                                       Billions of miles of VMT
                                                                                                                                   3.04                                                      17.40

               0.08
                                                                                                                                   2.98                                                      16.80

               0.04                                                                                                                2.92                                                      16.20

                0                                                                                                                  2.86                                                      15.60
                      ‘05 ‘06 ‘07 ‘08 ‘09 ‘10 ‘11 ‘12 ‘13                       Year            2020                                  2005       2008   2011    2014      2017        2020

               Average mtGHGe/MMBTU                       Steam Factor                                                            VMT                   2020 VMT Target
               Natural Gas Factor                         Electricity Emissions Factor                                            Fuel Economy
               Oil Factor

 The chart above measures how “clean” each fuel is—how many GHGs are released for each unit               The total number of miles driven (VMTs) in Boston has remained relatively flat, yet fuel economy has
 of energy. Steam has the potential to become much cleaner because of the increasing use of               increased. The number of jobs and commuters may increase in Boston, but increases in fuel economy
 co-generation, where steam by-product from producing electricity is captured to generate heat.           is projected to accelerate because of new standards from the federal government. This fuel economy
 A key goal target is to expand, and a key goal of the Plan is to expand co-generation in Boston to       increase will be one of the most powerful drivers of emissions reductions moving forward.
 cover 15% of LBI energy use reported to the City by 2020.

                                                                            GREENOVATE BOSTON 2014 CLIMATE ACTION PLAN UPDATE                                   BOSTON’S CARBON FOOTPRINT                                    23
BOSTON’S CARBON FOOTPRINT continued

Participation                                                                                                                                                                          Percentage of Boston Workers Living in Boston
                                                                  FIGURE  14:Heating
                                                                  Households  Households      Heating
                                                                                     with Oil vs.       with
                                                                                                  Gas (Fig.    Oil vs.
                                                                                                            9/ graph 5)                                                             FIGURE 15: Percentage of Residents Living and
Given many of the Plan’s strategies are voluntary,
                                                                  Natural Gas, 2005–2013                                                                                            Working in Boston, 2005–2013
reaching Boston’s goals will require substantial partici-
pation from residents and businesses in all relevant                                                                                                                                40%

                                                             Households Using Oil (Census Est.)
                                                                                                                    Households On Fuel Oil
programs, City-administered or otherwise. As such,                                                                  Natural Gas Account
                                                                                                   54,000           Growth                          54,000                          38%
each sector will have specific participation targets.

                                                                                                                                                             Natural Gas Accounts
These participation targets directly affect Boston’s                                                                                                                                                                           Residency Rate
                                                                                                   48,000                                           48,000                          36%                                        2020 Goal
GHG footprint. Program participation by ZIP code will
be shared wherever possible.
                                                                                                   42,000                                           42,000                          34%
One example of how participation affects GHGs is
Renew Boston. Each home weatherization is estimated                                                36,000                                          36,000                           32%
                                                                                                        2005      2007      2009        2011    2013                                  2005       2008      2011       2014      2017       2020
to reduce GHGs by roughly 1.3 metric tons, while heat-
ing system upgrades can reduce GHGs by as much as
                                                                  The number of Boston households on oil heat has been declining                                                    The percentage of Boston workers who also live in Boston
two metric tons. Each audit is estimated to reduce
                                                                  since 2010, while the number of residential natural gas accounts                                                  (residency rate) is an important measure of the City’s greenhouse
GHGs by about 0.3 metric tons of GHGs because of                  has soared. These boiler conversions have driven emissions                                                        gas emissions. By providing current residents with jobs in Boston,
energy efficient light bulbs and programmable thermo-             reductions, as heating oil releases 1.33 times the GHG emissions                                                  while also providing housing in Boston for people work in the
stats that are given during the audit. When combined              as natural gas.                                                                                                   city, people will drive less and live in homes that use less energy.
with a cleaner electricity grid, roughly 72,000 audits and                                                                                                                          Ideally, the residency rate will surpass 40% by 2020.
36,000 weatherizations and heating system replace-                FIGURE  16: Driving
                                                                    Massachusetts VMT Mileage:
                                                                                      vs. Boston Massachusetts
                                                                                                 Resident VMT  vs.
ments will reduce GHGs by 100,000 metric tons.                    Boston, 2013

Strategies and Actions                                                                             10,000
                                                               Vehicle Miles Traveled Per Person

The remainder of the Plan details the strategies and
actions that will help Boston achieve its 2020 goal. The                                            7,500
online Plan and performance measurement system will
include all actions and implementation details, which                                               5,000

will be updated as the City and other entities make
                                                                                                    2,500
progress. The online version will also contain back-
ground information on the actions and will serve as a
                                                                                                       0
resource for both the City and its residents.                                                                  Massachusetts            City of Boston
                                                                                                               Per Capita VMT           Per Capita VMT

                                                                  Living in dense, urban areas enables people to drive less. Vehicle
                                                                  miles traveled (VMTs) per person in Boston is much less than the
                                                                  state average.

24   GREENOVATE BOSTON 2014 CLIMATE ACTION PLAN UPDATE                                                             BOSTON’S CARBON FOOTPRINT
You can also read