Mexico City, Mexico The case of
←
→
Page content transcription
If your browser does not render page correctly, please read the page content below
The case of

    Mexico City, Mexico

                                                                                                                    Source: CIA factbook
    by Priscilla Connolly

    Contact:
    Priscilla Connolly, Dr
    Universidad Autonoma Metropolitana-Azcapotzalco
    Calvario 70-4
    TLALPAN
    14000 MEXICO DF
    Tel. (home) +52 5 54834045
    Fax. +52 5 53825899
    E-mail: pcd@correo.azc.uam.mx

    I. INTRODUCTION: THE CITY

    A.     URBAN CONTEXT

    1. National Overview
       Some time in 2001 Mexico’s total population                  The persistence of extreme rural poverty contrasts
    exceeded one hundred million, of which at least two-         with Mexico’s dubious distinction of also becoming in
    thirds are considered to be urban by virtue of inhabiting    2001 the world’s ninth largest economy2 (measured in
    localities with more than 15,000 inhabitants (Figure 1).     dollars) having ousted Brazil from that position on the
    The urbanisation process has taken place at great            strength of an over-valued peso. Relative to its popula-
    speed, mainly in the latter half of the twentieth century.   tion, the Mexican economy is less impressive, ranking
    Thirty three million Mexicans now live in cities with over   in sixty-ninth place among the developing nations, with
    a million inhabitants, another 20.6 million live in          a per capita GDP of US $5,070 in 20003. Almost a third
    medium cities of between 100,000 and one million,            of GDP is now generated by exports, of which 37.5 per
    while a further 15 million live in the smaller towns and     cent are manufactured goods and a further 43.8 per
    cities. The remaining third of the total population living   cent is bonded industrial production. Tertiary activities
    in localities of less than 15,000 inhabitants is consid-     have always played an important role, but it is industry
    ered to be “rural”, although the distinction between         that has been the driving force of Mexico’s urbanisa-
    “urban” and “rural” is often inappropriate, beyond the       tion, at least until recently (Table 1). A first wave of
    rather arbitrary delimitation of census localities. In       industrialisation occurred during the latter half of the
    some parts of Mexico, so-called “rural” localities are       nineteenth century and beginning of the twentieth,
    physically urbanised, if not actually integrated into        when the basic infrastructure was introduced: railways,
    urban areas. Yet rural localities do include a large         roads, ports, electricity. At the same time, the major
    contingent of marginalized poor, including many indige-      cities acquired the essential items of contemporary
    nous communities and others involved in subsistence          urbanisation: paved roads, water and drainage, public
    agriculture. And the poorest of these –approximately 10      parks and civic centres, street lighting and tramways.
    million people- are dispersed in localities of less than        The Revolutionary struggles of the second decade of
    500, two-third of which are completely isolated from         the century prevented Mexico from fully reaping the
    urban areas1.                                                fruits of this investment until the favourable conditions
1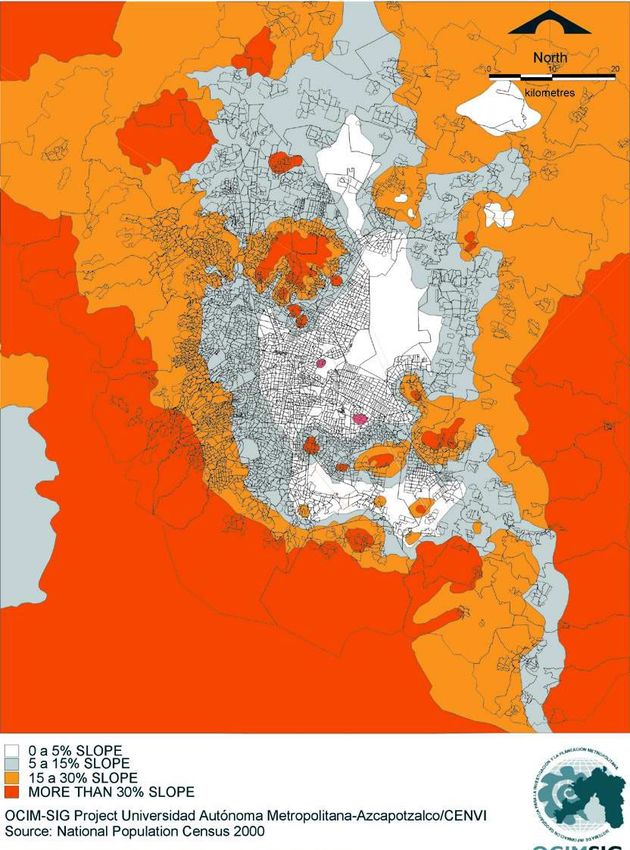
Urban Slums Reports: The case of Mexico City, Mexico
Table 1: Mexico: distribution of GDP 1990-1998 by provided by World War II precipitated rapid industriali-
economic sector sation based on import substitution. The “Mexican
miracle” of unabated economic growth lasted till the
1990 1940 1970 1980 1988 1998
mid 1970’s (Fig. 2), after which a sequence of crises,
Primary sector 23.5% 15.4% 9.2% 6.8% 6.9% 5.8% followed by a ruthless opening up of the economy by
Secondary sector 14.4% 19.9% 26.1% 27.5% 26.4% 28.8% trade liberalisation, privatisation and increased foreign
investment, has produced uneven results in macroeco-
Terciary sector 52.1% 64.7% 64.7% 65.7% 66.7% 65.4%
nomic terms (Fig. 3) and extreme social impacts, espe-
Source: Sobrino, J. (2001) 'Participación económica'. In G Garza cially unemployment. In spite of constant growth of the
(coord.) La Ciudad de México en el Fin del Segundo Milenio,
Gobierno del Distrito Federal/ El Colegio de México, México DF. working population, the total number of formal private
P.163 sector employees (defined by the social security regis-
ter) actually dropped in three distinct periods: 1982 to
Table 2: Mexico: income distribution by decile 1984, 1992 to 1997 and again in 2000 (Figure 4).
1963 to 1992 Correspondingly, income distribution at a national level
has remained extremely unequal (Table 2). The gap
% of Income
Deciles of between the rich and the poor is enormous, both within
Households
1977 1984 1989 1992 regions and across regions. Essentially the country
I 1.1 1.4 1.7 2.1 remains divided between a richer, urban and agricul-
tural, “North” and a poor, rural, South (Map 1).
II 2.3 2.6 3.1 3.1
Dominating both Mexicos from the heart of the central
III 3.3 3.6 3.8 3.9 highlands, the nation’s capital and undisputed solar
plexus combines the lowest level of relative poverty
IV 4.5 4.8 4.7 4.7
with the highest concentrations of urban poor.
V 6 6 5.9 5.8
VI 7.6 7.6 7.2 7.2
VII 9.6 9.5 8.9 8.5 2. Mexico City: origins and metropolitan
growth
VIII 12.5 12.5 11.8 10.8
Mexico –land of the Mexica- takes its name from its
IX 17.6 17.3 15.6 15.4
capital, rather than vice versa. Just before the Spanish
X 35.5 34.6 38 38.5 conquest and the destruction of the city in 1521,
Tenochtitlan and environs, the religious, military and
Source: 1977 y 1984, Cortés, F and R Ma. Ruvalcaba (1991),
based on Encuesta Nacional de Ingresos y Gastos de los economic centre of the Mexica or Aztec empire, had a
Hogares, of respective years; 1989 and 1992: INEGI (1992, 251; population of between 200,000 and 300,000, maybe
1994, 261), Encuesta Nacional Ingreso-Gasto de los Hogares,
1989 and 1992. more: perhaps the largest city in the world2. After
Cortés adopted the ruins of Tenochtitlan as the capital
of New Spain, the territorial domination of México, as
the colonial city was named, extended over a vast
Figure 1
MEXICO: POPULATON DISTRIBUTION BY SIZE OF LOCALITY 1950-1990 hinterland stretching from the Central America to
120000
Oregon. The military, tributary and religious domination
adapted from the Aztec system was reinforced by the
trade monopoly between Mexico City and Cadiz,
imposed by the Spanish until the Borbonic reforms in
100000
the late eighteenth century. After independence from
80000 Spain in 1810 and the subsequent years of civil strife,
POPULATION (thousands)
the economic and political pre-eminence of Mexico
60000 City was enhanced, particularly during the Porfirian
dictatorship from 1870 to 1910, which endowed the
nation’s capital with strong advantages in terms of
40000
social and physical infrastructure. It was, however, in
the aftermath of the 1910-17 Revolution when the city
20000
population began its decisive upsurge; since then it
has grown exponentially to become the archetypical
0
1950 1960 1970 1980 1990 2000
Latin American primate city (Table 3 and Fig. 5).
less than 15,000
100,000 - 499,999
15,000 - 49,999
500,000 - 999,999
50,000 - 99,999
1,000,000 plus The territorial dimension of this growth may be
Figure 1: Mexico: Population distribution by size of appreciated in Map 2: the city having expanded from
locality 1950-1990 around 23 sq. km. in 1900 to about 683 sq. km. in
2
U N D E R S TA N D I N G S L U M S : C a s e St u d i e s f o r t h e G l o b a l R e p o r t o n H u m a n S e t t l e m e n t s 2 0 0 3

    1970, and again duplicating to 1,295
                                                     Figure 2: Mexico: gross national product per capita 1900-1970.
    km2. in 1990. Densities have remained            Mexican pesos at 1970 prices
    stable over 500 years, oscillating
    around 120 persons per hectare as                           35

    the city grows cyclically, in accor-
                                                                30
    dance to the macroeconomic and
    social processes governing urban
                                                                25
    development. As a general rule, the
    city expands horizontally in times of                       20

                                                       deg. C
    recession, when land is cheap, and
    consolidates in times of economic                           15
    growth when credit for building is
    available.                                                  10
       Mexico City, as the republic’s capi-
    tal, has historically been located in the                   5
    Federal District. From the mid 1940’s,
    spurred by the prohibition of new                           0
                                                                     Jan.   March          May           July         Sept.      Nov.
    development here, industrial and
    urban growth to the north spilled over           Source: INEGI (1994) Estadisticas Historicas, vol.Im Mexico, pp. 401-2
    into municipalities belonging to the
    neighbouring state, confusingly called
    “State of Mexico”. By 1970, 11 munic-            Figure 3: Mexico: GDP per capita 1960-1999 Mexican pesos at 1980 prices
    ipalities were totally or partially incor-
    porated into what was defined as the
    Mexico City Metropolitan Area, or
    Mexico City Metropolitan Zone3. The
    process has continued to embrace an
    ever-increasing number of municipali-
    ties as city growth becomes more
    dispersed. At no time, however, has
    there been a single official, functional
    or jurisdictional definition for what will
    be referred to here as “Metropolitan
    Mexico City”4.
       Different academic studies and
    government departments apply their
    own criteria to define -often not explic-
    itly- the metropolitan area at any
                                                     Sources: GDP, Sistema de cuentas nacionales. 1960-1993 Carlos Salinas de Gortari (1994)
    moment in time. In fact, the inclusion           VI Informe p.26; 1994-1999, Vicente Fox (2001) I Informe, p. 146, 1993 deflacted to 1980
    of more or less municipalities does not          prices. Population: Interpolated National Population Census Counts.
    make much difference to the total
    population, 95% of which is concen-              Figure 4: Number of permanently private sector employees with social
    trated in the Federal District and 21            security coverage (excludes temporary workers and self-employed)
    municipalities (Map 3)5.
                                                    12,000
       At present, the broadest definition of
    what is often called the “Mexico Valley         10,000
    Metropolitan Zone” embraces the                   8,000
    Federal District plus 58 municipalities           6,000
    in the State of Mexico and one more in
                                                      4,000
    the State of Hidalgo. Unless otherwise
    stated, all further statistics are based          2,000
    on this definition, as illustrated in Map                   0
    4 and Table 4. The total population of
                                                           19 7
                                                           19 78
                                                           19 9
                                                           19 80
                                                           19 81
                                                           19 2
                                                           19 83
                                                           19 4
                                                           19 85
                                                           19 6
                                                           19 87
                                                           19 8
                                                           19 89
                                                           19 90
                                                           19 1
                                                           19 92
                                                           19 3
                                                           19 94
                                                           19 5
                                                           19 96
                                                           19 97
                                                           19 8
                                                           20 99
                                                           20 0
                                                              01
                                                              7

                                                              7

                                                              8

                                                              8

                                                              8

                                                              8

                                                              9

                                                              9

                                                              9

                                                              9

                                                              0

    Metropolitan Mexico City, thus
                                                           19

    defined, reported in the 2000 census
                                                    Sources: GDP, Sistema de cuentas nacionales. 1960-1993 Carlos Salinas de Gortari (1994)
    was 18,396,677, giving a mean                   VI Informe p.26; 1994-1999, Vicente Fox (2001) I Informe, p. 146, 1993 deflacted to 1980
    annual growth rate between 1995 and             prices. Population: Interpolated National Population Census Counts.

3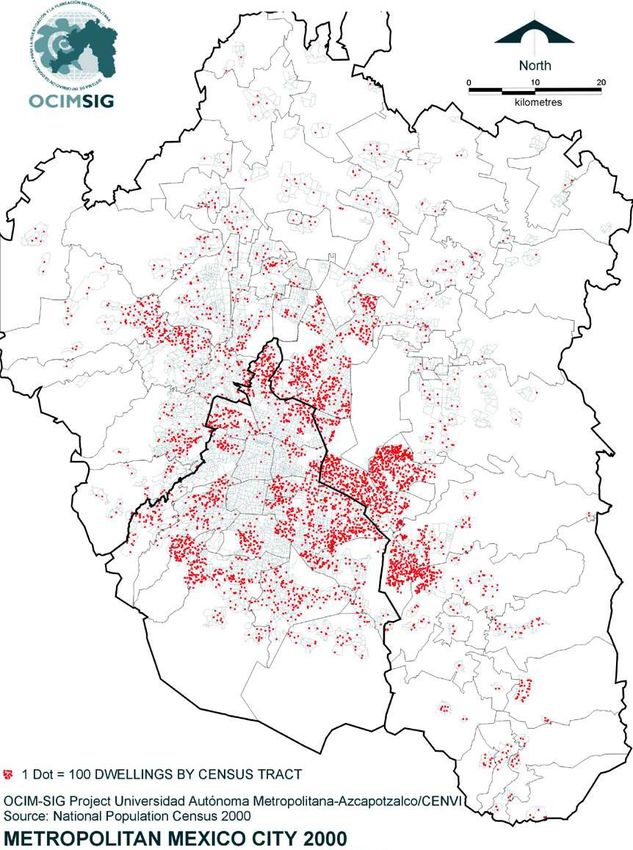
Urban Slums Reports: The case of Mexico City, Mexico

                                                                 3. The Physical City
Map 1: Mexico: localities with very high
marginality levels                                                  Mexico City has most of the poverty and wealth-
                                                                 related environmental problems and hazards to be
                                                                 found in all metropolises. Many of these, however, are
                                                                 made worse by the city’s unique geographical position.
                                                                 First, it is one of the few cities of the world that has no
                                                                 natural drainage outlet, being located in a closed basin
                                                                 on the flat bed of what was once a series of lakes (Map
                                                                 5). These were of varying depth depending on rainfall,
                                                                 most of which is concentrated in the five months
                                                                 between May and September and is highly variable from
                                                                 year to year (Table 5). Rain and spring water running off
                                                                 the elevated slopes to the West and South of the valley
                                                                 collect in the lowest part of the system, lake Texcoco,
                                                                 whose vestiges remain to the East of central Mexico
                                                                 City. The water here is saline due to the intense evapo-
                                                                 ration caused by high temperatures and insolation
Source: CONAPO (2000), Indices de Marginacion, 1995
(Compact disk) / Consejo Nacional de Poblacion                   during the dry season (Figure 7). The Mexica chose
                                                                 their island location for strategic reasons (and no doubt
                                                                 for its agreeable climate), but their expanding city was
Map 2: City growth 1500 to 2000                                  completely flooded on various occasions, while fresh
                                                                 water needed to be brought in via aqueduct. This para-
                                                                 dox of too much and too little water has characterised
                                                                 Mexico City’s growth throughout its history and has
                                                                 been a major factor in urban segregation and the loca-
                                                                 tion of slums. While the higher areas to the West and
                                                                 South of the city are relatively safe from flooding and
                                                                 have enjoyed more immediate access to water supplies,
                                                                 the saline flat lands to the East are more prone to flood-
                                                                 ing when it rains and dust storms in the dry season. Until
                                                                 the end of the nineteenth century, flooding was consid-
                                                                 ered to be the main environmental hazard, exacerbated
                                                                 by deforestation, urban growth and the destruction by
                                                                 the Spaniards of the original hydraulic defence system
                                                                 built by the Aztecs. The solution adopted was to drain
                                                                 the city artificially, first achieved partially under the
                                                                 Colonial administration in the eighteenth century and,
                                                                 finally, in 1900, by means of a 40 kilometre-long canal
                                                                 which drains the Texcoco Lake to the North East and out
                                                                 of the basin through a tunnel under the mountains.
                                                                 Under normal conditions, sewage and storm water are
                                                                 pumped through this system and out of the valley, while
                                                                 30 per cent of the city’s drinking water is pumped in from
                                                                 sources over 100 kilometres away. The remaining 70
                                                                 percent comes from artesian wells within the basin.
                                                                    The over exploitation of the aquifer has caused
 Source: OCIM-SIG Project Universidad Autonoma Metropolitana
 Azcapotzalco/CENVI; Consejo Nacional de Poblacion               severe subsidence in central Mexico City, which both
                                                                 exacerbates the risk of flooding and damages the water
                                                                 and drainage network, causing leakage and contamina-
                                                                 tion of the water supply. When heavy rains threaten
                                                                 flooding, a gravity-fed deep tunnel built in 1975 drains
                                                                 off excess water to the North West. Mexico City’s
                                                                 current paradoxical hydrological balance is quantified in
                                                                 Table 6. Water is undoubtedly the major environmental
2000 of 1.45 per cent. Figure 6 shows the distribution           problem facing the city, as a whole; and the lack of suffi-
of population growth between the Federal District and            cient clean water is one of the major component factors
the State of Mexico.                                             defining slum housing.
                                                                                                                               4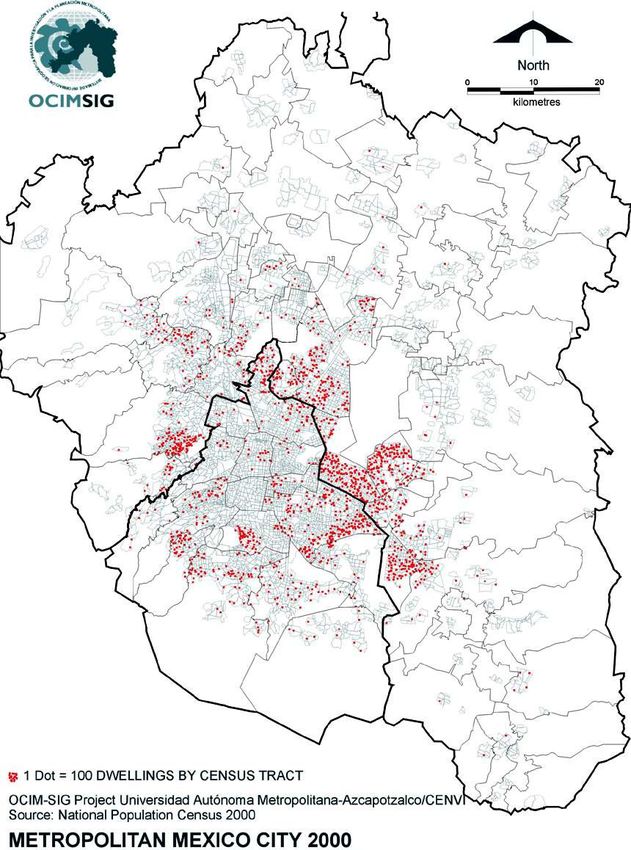
U N D E R S TA N D I N G S L U M S : C a s e St u d i e s f o r t h e G l o b a l R e p o r t o n H u m a n S e t t l e m e n t s 2 0 0 3
Table 3: Mexico City: Population growth and participation in national population 1900 - 2000 (in Thousands)
1900 1910 1921 1930 1940 1950 1960 1970 1980 1990 2000
Population 345 471 662 1,049 1,645 2,952 5,125 8,623 12,995 15,274 17,946
Population as %
2.5% 3.1% 4.6% 6.3% 8.4% 11.5% 14.7% 17.9% 19.4% 18.8% 18.4%
of total national
Mean annual
3.2% 3.1% 5.6% 4.7% 5.9% 5.7% 5.5% 4.0% 1.7% 1.4%
growth rate
Note: from 1950 onwards, the population refers to Mexico City Metropolitan Area, comprising the Federal
Capital and a variable number of municapalities belong to the surrounding State of Mexico (see Table 5).
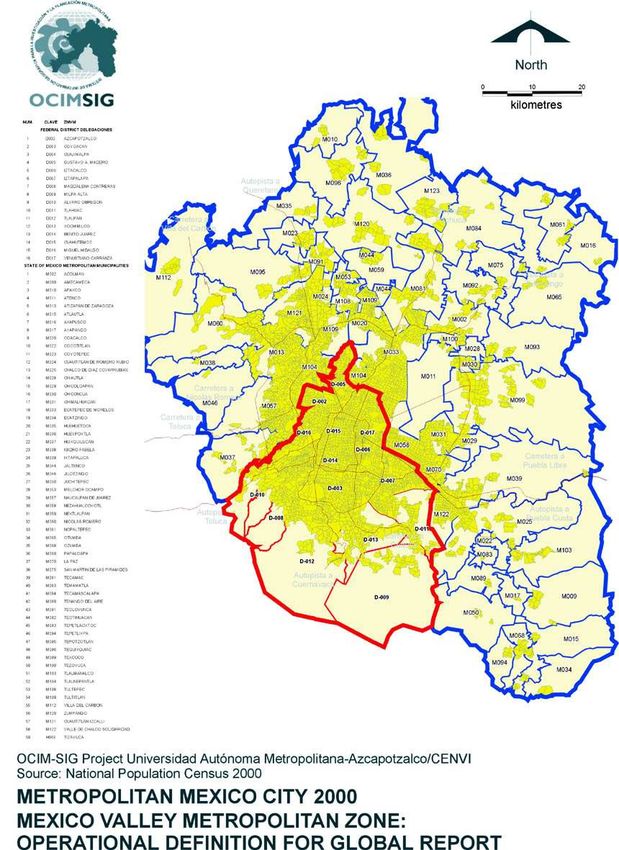
Apart from the complex hydrological situation, the census tract in 2000. In general, higher densities corre-
Mexico City basin’s geological origins affect the location spond to lower income population, often situated in
and conditions of slum housing in other ways. The steep areas, which are vulnerable for one or other of the
slopes surrounding the extinct lakes are undesirable for reasons mentioned.
most conventional building uses, and have provided a
cheap alternative for unauthorised settlement. Some of
these hills have been mined for building materials, 4. Demographics, Population Distribution
compounding subsoil collapse to the existing hazard of and Social Segregation.
high gradients and permanent lack of services. These While basic pattern of urban segregation determined
areas are, however, relatively immune to risk from by historical and physical factors remains unaltered,
Earthquakes, unlike all the inhabitants of the lakebed, recent demographic and economic changes are trans-
with its highly compressible subsoil. Map 6 shows the forming the social structure of the city. First and fore-
built-up area in relation to Mexico City’s topography, most, a revolution in vital statistics: the drastic reduction
while Map 7 shows population density distribution by in the fertility due to family planning policies imple-
Map 3. Metropolitan Mexico City: Distribution of Map 4. Metropolitan Mexico City/Mexico Valle
population by census tract 2000 Metropolitan Zone: Operational definition for Global Report
Source: OCIM-SIG Project Universidad Autonoma Metropolitana
Azcapotzalco/CENVI; Consejo Nacional de Poblacion
5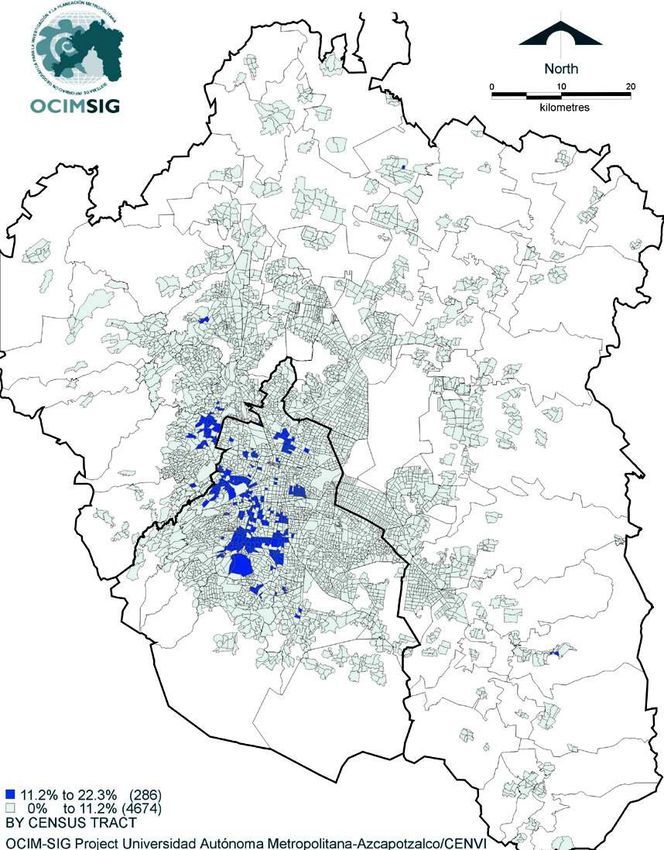
Urban Slums Reports: The case of Mexico City, Mexico

Table 4. Metropolitan Mexico City (zona metropolitana del Valle de México):
         Population by delegation y Municipality 1990 to 2000

                 DELEGACIÓN/                                                                                              MEAN ANNUAL
     NO.                                TOTAL POPULATION                    POPULATION INCREASE
                 MUNICIPALITY                                                                                             GROWTH RATE

                                    1990        1995         2000        1990-95     1995-2000    1990-2000    1990-95    1995-2000    1990-2000

Total
Metropolitan                      15,563,795   7,297,535 18,396,677      1,733,740   1,076,003     2,809,743        1.9         1.4             1.7
Mexico city
Total
Federal                            8,235,744 8,489,007     8,605,239       53,263     2116,232      369,495        0.54        0.32            0.44
District

1                Azcapotzalco        474,688    455,131       441,008      -19,557      -14,123      -33,680      -0.74        -0.73           -0.74

2                Coyoacán            640,066    653,489       640,423       13,423      -13,066         357        0.37        -0.47           0.01

3                Cuajimalpa          119,669    136,873       151,222       17,204      14,349        31,553       2.40        2.36            2.39

                 Gustavo A.
4                                  1,268,068   1,256,913    1,235,542      -11,155      -21,371      -32,526      -0.16        -0.40           -0.26
                 Madero

5                Iztacalco           448,322    418,982       411,321      -29,340       -7,661      -37,001      -1.19        -0.43           -0.86

6                Iztapalapa        1,490,499   1,696,609    1,773,343      206,110      76,734                     2.32        1.04            1.77

                 Magdalena
7                                    195,041     211,898      222,050       16,857      10,152       282,844       1.48        1.10            1.32
                 Contreras

8                Milpa Alta           63,654     81,102        96,773       17,448      15,671        27,009       4.38        4.21            4.31

9                Alvaro Obregón      642,753    676,930       687,020       34,177      10,090        33,119       0.92        0.35            0.67

10               Tláhuac             206,700    255,891       302,790       49,191      46,899        44,267       3.85        4.01            3.92

11               Tlalpan             484,866    552,516       581,781       67,650      29,265        96,090       2.34        1.21            1.85

12               Xochimilco          271,151    332,314       369,787       61,163      37,473        96,915       3.66        2.53            3.18

13               Benito Juárez       407,811    369,956       360,478      -37,855       -9,478       98,636      -1.71        -0.60           -1.24

14               Cuahutemoc          595,960    540,382       516,255      -55,578      -24,127      -47,333      -1.72        -1.06           -1.44

15               Miguel Hidalgo      406,868    364,398       352,640      -42,470      -11,758      -79,705      -1.93        -0.76           -1.43

                 Venustiano
16                                   519,628    485,623       462,806      -34,005      -22,817      -54,228      -1.19        -1.12           -1.16
                 Carranza

Total
Metropolitan
Municipalities                     7,328,051   8,808,528    9,791,438    1,480,477     982,910       -56,822       3.31        2.50            2.96

1                Acolman              43,276     54,468        61,250       11,192       6,782        17,974       4.15        2.78            3.56

2                Amecameca            36,321     41,671        45,255        5,350       3,584         8,934       2.46        1.95            2.24

3                Apaxco               18,500     21,134        23,734        2,634       2,600         5,234       2.38        2.75            2.54

4                Atenco               21,219     27,988        34,435        6,769       6,447        13,216       5.02        4.96             5.0

                 Atizapan de
5                                    315,192    427,444       467,886      112,252      40,442       152,694       5.54        2.13            4.06
                 Zaragoza

                                                                                                                                 (continued)

mented since the 1970’s and increased life expectancy                     highest life expectancy, with the most impoverished
have changed the way people live, especially women,                       states at the other extreme for 1970, 2000 and projec-
thus altering family composition and housing needs. It                    tions for 2020. These changes have important implica-
is also significant that these statistics are converging at               tions for the city’s development. First, the deceleration
a national level: perhaps a better indicator for the                      of population growth has not curbed the expansion of
spread of urbanisation than the size of census locali-                    the city because the household formation remains very
ties. Table 7 compares Mexico City’s Federal District,                    high, with households becoming smaller and older
which traditionally shows the lowest fertility and the                    (Table 8). The ageing of the population is another
                                                                                                                                                  6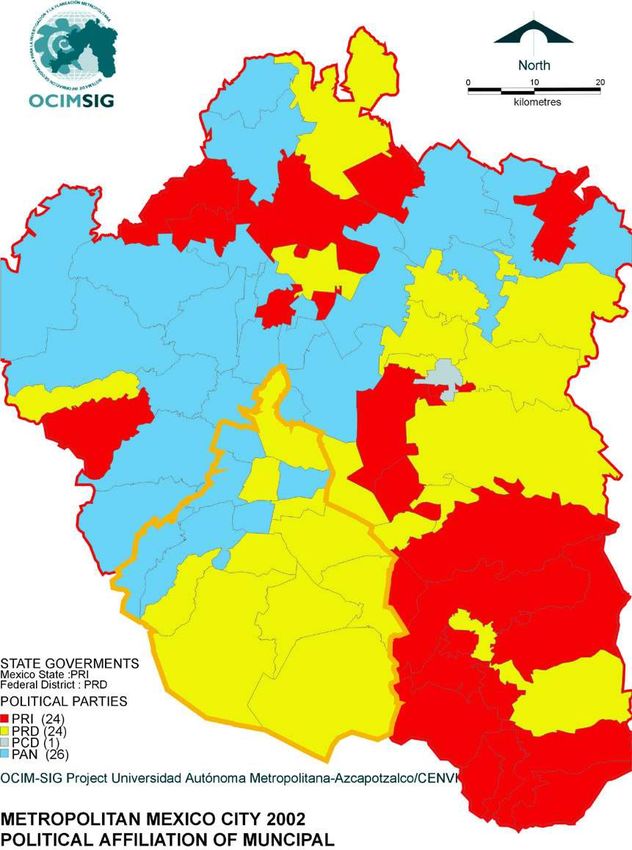
U N D E R S TA N D I N G S L U M S : C a s e St u d i e s f o r t h e G l o b a l R e p o r t o n H u m a n S e t t l e m e n t s 2 0 0 3

    Table 4. Metropolitan Mexico City (zona metropolitana del Valle de México):
             Population by delegation y Municipality 1990 to 2000 (continue)

               DELEGACIÓN/
     No.                                TOTAL POPULATION                   POPULATION INCREASE              MEAN ANNUAL GROWTH RATE
               MUNICIPALITY

                                     1990       1995        2000       1990-95    1995-2000    1990-2000    1990-95    1995-2000    1990-2000

    6      Atlautla                   18,993      22,634     25,950       3,641       3,316         6,957       3.15        3.25          3.20

    7      Axapusco                   15,803      17,848     20,516       2,045       2,668         4,713       2.18        3.31          2.67

    8      Ayapango                    4,239       4,858      5,947        619        1,089         1,708       2.44        4.84          3.47

    9      Coacalco                  152,082     204,674    252,555      52,592      47,881       100,473       5.39        5.03          5.24

    10     Cocotitlan                  8,068       9,290     10,205       1,222         915         2,137       2.53        2.22          2.40

    11     Coyotepec                  24,451      30,619     35,358       6,168       4,739        10,907       4.06        3.42          3.79

    12     Cuautitlan de R. R.        48,858      57,373     75,836       8,515      18,463        26,978       2.88        6.74          4.53

    13     Chalco de Díaz de C.      282,940     175,521    217,972    -107,419      42,451       -64,968      -8.10        5.19         -2.59

    14     Chiautla                   14,764      16,602     19,620       1,838       3,018         4,856       2.10        3.98          2.91

    15     Chicoloapan                57,306      71,351     77,579      14,045       6,228        20,273       3.95        1.97          3.10

    16     Chiconcuac                 14,179      15,448     17,972       1,269       2,524         3,793       1.53        3.60          2.42

    17     Chimalhuacán              242,317     412,014    490,772     169,697      78,758       248,455       9.84        4.17          7.37

    18     Ecatepec de Morelos     1,218,135   1,457,124   1,622,697    238,989     165,573       404,562       3.22        2.55          2.93

    19     Ecatzingo                   5,808       6,949      7,916       1,141         967         2,108       3.22        3.09          3.17

    20     Huehuetoca                 25,529      32,718     38,458       7,189       5,740        12,929       4.49        3.85          4.22

    21     Hueypoxtla                 26,189      31,124     33,343       4,935       2,219         7,154       3.10        1.62          2.46

    22     Huixquilucan              131,926     168,221    193,468      36,295      25,247        61,542       4.39        3.32          3.93

    23     Isidro Fabela               5,190       5,190      8,168       1,416       1,562         2,978       4.36        5.08          4.68

    24     Ixtapaluca                137,357     137,357    297,570      50,333     109,880       160,213       5.68       11.37          8.10

    25     Jaltenco                   22,803      22,803     31,629       3,435       5,391         8,826       2.51        4.46          3.35

    26     Jilotzingo                  9,011       9,011     15,086       3,401       2,674         6,075       5.83        4.66          5.33

    27     Juchitepec                 14,270      14,270     18,968       3,217       1,481         4,698       3.66        1.92          2.91

    28     Melchor Ocampo             26,154      26,154     37,716       7,301       4,261        11,562       4.45        2.84          3.76

    29     Naucalpan de Juárez       786,551     786,551    858,711      53,172      18,988        72,160       1.16        0.52          0.89

    30     Nezahualcoyotl          1,256,115   1,256,115   1,225,972    -22,247       -7,896      -30,143      -0.32        -0.15        -0.24

    31     Nextlalpan                 10,840      10,840     19,532       4,213       4,479         8,692       5.98        6.28          6.11

    32     Nicolás Romero            184,134     184,134    269,546      52,930      32,482        85,412       4.57        3.05          3.91

    33     Nopaltepec                  5,234       5,234      7,512       1,258       1,020         2,278       3.88        3.47          3.71

    implication, creating a disproportionate need for jobs                  independence, among other reasons (Table 10)
    and, progressively, facilities for the elderly. Figure 8                (Esquivel 2002).
    how the age structure of the city’s population has                        The regional convergence of socio-economic indica-
    changed in thirty years. Third, as women have to dedi-                  tors is also a reflection of radical changes in migration
    cate less time to pregnancy and childcare they are                      patterns. The traditional model of massive immigration
    increasingly active economically (Table 9). At the same                 of rural peasants to the major cities is no longer valid;
    time, there has been a rise in the proportion of female                 rural migrants are now attracted more across the border
    headed households, related both to the longer life                      and to other large and medium cities within Mexico
    expectancy of women and their increased economic                        (CONAPO 2001, 95-104). There has also been a rever-
7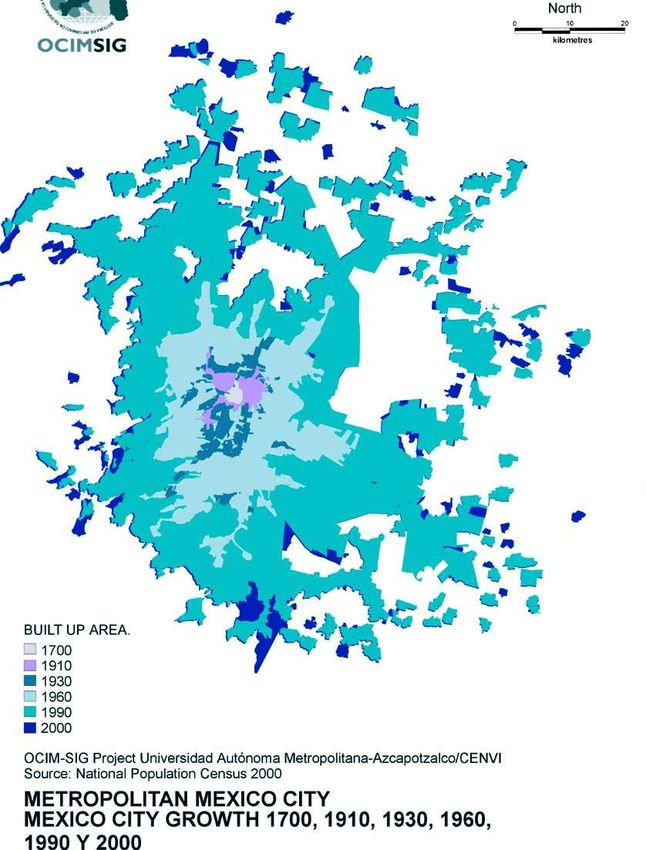
Urban Slums Reports: The case of Mexico City, Mexico

Table 4. Metropolitan Mexico City (zona metropolitana del Valle de México):
         Population by delegation y Municipality 1990 to 2000 (continue)

            DELEGACIÓN/
 NO.                                    TOTAL POPULATION                   POPULATION INCREASE                MEAN ANNUAL GROWTH RATE
            MUNICIPALITY

                                    1990        1995         2000      1990-95       1995-2000   1990-2000    1990-95    1995-2000   1990-2000

34      Otumba                       21,834       25,415      29,097      3,581          3,682        7,263       2.72        3.21        2.94

35      Ozumba                       18,052       21,424      23,592      3,372          2,168        5,540       3.07        2.28        2.73

36      Papalotla                     2,387        2,998       3,469        611            471        1,082       4.11        3.47        3.84

37      La Paz                      134,782      178,538     212,694     43,756         34,156       77,912       5.10        4.18        4.70

38      San Martin de las P.         13,563       16,881      19,694      3,318          2,813        6,131       3.95        3.67        3.83

39      Tecamac                     123,218      148,432     172,813     25,214         24,381       49,595       3.35        3.62        3.47

40      Temamatla                     5,366        7,720       8,840      2,354          1,120        3,474       6.64        3.22        5.16

41      Temascalapa                  19,099       24,440      29,307      5,341          4,867       10,208       4.46        4.33        4.41

42      Tenango del Aire              6,207        7,282       8,486      1,075          1,204        2,279       2.86        3.64        3.20

43      Teoloyucan                   41,964       54,454      66,556     12,490         12,102       24,592       4.72        4.80        4.76

44      Teotihuacán                  30,486       39,183      44,653      8,697          5,470       14,167       4.54        3.10        3.92

45      Tepetlaoxtoc                 16,120       19,380      22,729      3,260          3,349        6,609       3.31        3.79        3.52

46      Tepetlixpa                   12,687       15,181      16,863      2,494          1,682        4,176       3.22        2.49        2.91

47      Tepotzotlan                  39,647       54,419      62,280     14,772          7,861       22,633       5.76        3.20        4.66

48      Tequixquiac                  20,784       24,766      28,067      3,982          3,301        7,283       3.15        2.97        3.07

49      Texcoco                     140,368      173,106     204,102     32,738         30,996       63,734       3.78        3.92        3.84

50      Tezoyuca                     12,416       16,338      18,852      3,922          2,514        6,436       4.97        3.40        4.30

51      Tlalmanalco                  32,984       38,396      42,507      5,412          4,111        9,523       2.72        2.41        2.59

52      Tlalnepantla                702,807      713,143     721,415     10,336          8,272       18,608       0.26        0.27        0.26

53      Tultepec                     47,323       75,996      93,277     28,673         17,281       45,954       8.74        4.90        7.08

54      Tultitlan                   246,464      361,434     432,141    114,970         70,707      185,677       7.01        4.26        5.82

55      Villa del Carbon             27,283       30,726      37,993      3,443          7,267       10,710       2.12        5.09        3.39

56      Zumpango                     71,413       91,642      99,774     20,229          8,132       28,361       2.12        2.01        3.43

57      Cuahutitlan Izcalli         326,750      417,647     453,298     90,897         35,651      126,548       4.51        1.93        3.35

        Valle de Chalco
58                                         -     287,073     323,461             -      36,388            -       4.44        2.83           -
        Solidaridad

59      Tizayuca (HIDALGO            30,293       39,353      46,344      9,060 6,991                16,051       4.74        3.89        4.38

Source: XI Censo General de Población y Vivienda 1990, Conteo de Población y Vivienda 1995, XII Censo General de Población y Vivienda 2000
Elaboration: J. Velázquez, OCIM-SIG Proyect, Universidad Autónoma Metropoolitana-Azcapotzalco.

sal in the equally important influx into the capital city of                These socio-demographic changes have also
the better educated from provincial towns and cities, in                  affected the population’s disposable income; family
search of higher education and professional advance-                      income is now a more important indicator of poverty or
ment. Since 1990, Metropolitan Mexico City has shown                      ability to pay than individual incomes, although access
a negative migration balance, both in absolute number                     to monetary and other resources within families is not
–there are more emigrants than immigrants - and in                        necessarily equitably distributed. The principal wage
terms of human capital; those leaving the city are better                 earner is not always the main contributor to family
qualified and more active economically than those who                     income, for example. Figure 9 compares the male and
do not, while the immigrants are the least qualified                      female economically active population in Metropolitan
(Table 11).                                                               Mexico City. Figure 10, shows the distribution of family
                                                                                                                                                 8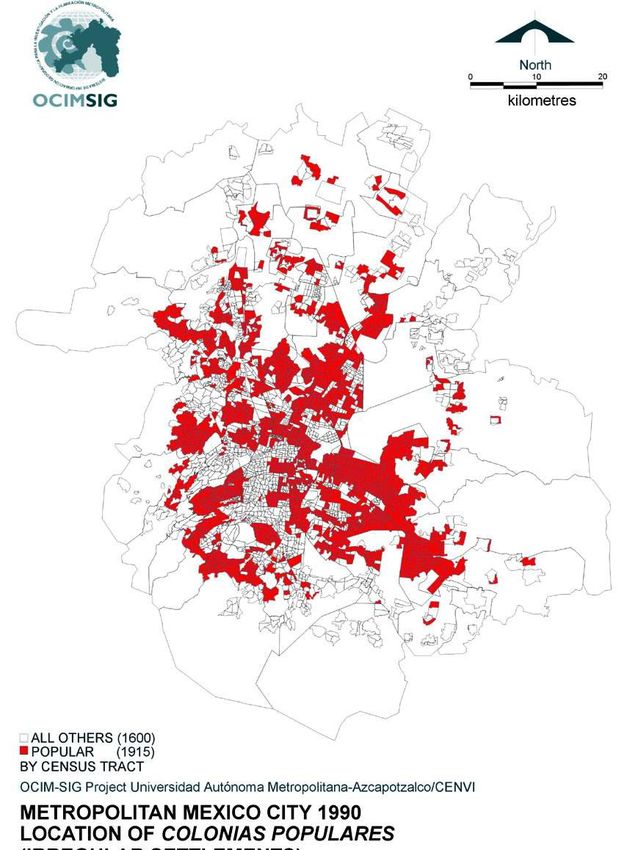
U N D E R S TA N D I N G S L U M S : C a s e St u d i e s f o r t h e G l o b a l R e p o r t o n H u m a n S e t t l e m e n t s 2 0 0 3

    earned income, based the family income and expendi-                     Table 5: Mexico City climate: mean annual rainfall
    ture survey, with approximate correspondence with                       TACUBAYA (1921-2000)                                  787.7 mm.
    access to the housing market.                                                                                                   460.3 mm.
                                                                                Dryest year (1945.)
       The overall convergence at a national level of socio-
    demographic indicators contrasts with strong variations                     Wettest year (1976)                               1,161.5 mm.
    within Mexico City. It will have been noted that the
                                                                            EL GUARDA (1958-2000)                               1,343.7 mm.
    household growth rate is much slower in Federal District
    than in the Metropolitan Municipalities; the population is                  Dryest Year (1960)                                  878.9 mm.
    older, with a higher proportion of women in the work-                       Wettest year (1990                                2,873.0 mm.
    force and as heads of households; mean household
                                                                            Source: INEGI (2001) Cuaderno Estadístico de la Zona Metropolitana
    size is smaller, in general, all socio-economic indicators              de la Ciudad de México, pp. 10,
    relating to education, health and income are better in the
    Federal District. In contrast, the population in the                    Table 6: Mexico City Valley: Hydrological balance 2001
    Metropolitan Municipalities is younger, has lower educa-
    tion levels and is composed of larger families, with a                                 IN                mm3 / year        mm3 /sec.
    lower incidence of female-headed households. Breaking
                                                                            Rainfall                               6,645.58             210.73
    the data down further into the Federal District’s delega-
    ciones and the metropolitan municipalities, a clearer                   Imported from other valleys             625.815             19.844
    picture of population shifts and socio-economic trends                  Extracted from subsoil within
                                                                                                                   1,846.19             58.542
    emerges. By 2000, eight delegaciones and two metro-                     the Mexico City Valley
    politan municipalities were losing population, while the
                                                                                         OUT
    major gains were in certain municipalities to the East
    and South. Map 8 shows the most recent relative and                     Evaporation by transpiration           -5,256.61          -166,686
    absolute population shifts. Disaggregating the 2000
                                                                            Evaporation from surface
    data further, Maps 9 to 16 show the distribution of the                 water
                                                                                                                   -120.468              -3.82
    following socio-demographic indicators by census tract:
                                                                            Infiltration to subsoil                   -788.4               -25
    age, education levels, fertility rates, economic participa-
    tion rates, incidence of female headed households and                   Evaporation from soil                  -1,363.99           -43.252
    income levels. The less-educated lower income popula-                   Removed from Valley by                                     -50.359
                                                                                                                   -1,588.12
    tion is clearly concentrated on the urban fringes, espe-                drainage
    cially to the East of the city, following the historical
                                                                            TOTAL                                         0                     0
    pattern of social segregation. Here also there are more
    people under the age of fifteen and, in general, a lower                Source: Domínguez Mora, E. (2001) "Agua: Escasez y Vulnerabilidad
    economic participation rate. The incidence of female-                   en la Zona Metropolitana del Valle de México", paper presented
                                                                            semina Día Mundial del Agua, Mexico City 22-23 march 2001.
    headed households does not seem relate to poverty,
    quite the opposite: the richer, more central, areas of the
    city, with a more active female workforce and a higher
    incidence of widows, contain proportionally more
    female-headed households (Map 14).
                                                                            Figure 5: Primacy index of Mexico City 1900-2000
                                                                            in relation to the six next largest cities
    5. Mexico City’s Economy
      One explanation of the extraordinary degree of
    economic and demographic concentration in Mexico
    City is the competitive advantage of cumulative invest-
    ment in productive infrastructure, inherited from previ-
    ous eras and enhanced throughout the twentieth
    century (Garza 1985). The influence of the politically
    centralised post revolutionary presidential regimes and
    the consolidation of a one party state, in power until
    2000, are equally important. Economic, political and
    educational opportunities, as well as markets, were
    overwhelmingly concentrated in the capital. Not surpris-                Data sources: 900-1930, Unikel, L (1976) El Desarroillo Urbano de
                                                                            México, México DF, El Colegio de México, p. 57; 1930-1990,
    ingly, it was here that the major part of Mexico’s import
                                                                            CONAPO (1994) CONAPO (1994) Información Básica sobre
    substitution industrial growth took place, at first due to              Migración por Entidad Federativa, México, Consejo Nacional de
    the World War II bonanza for already existing industries,               Población,Consejo Nacional de Población, México DF, p. 30. 2000:
                                                                            CONAPO (2001) La Población de México en el Nuevo Siglo, p. 106.
     and subsequently on the strength of national and,
9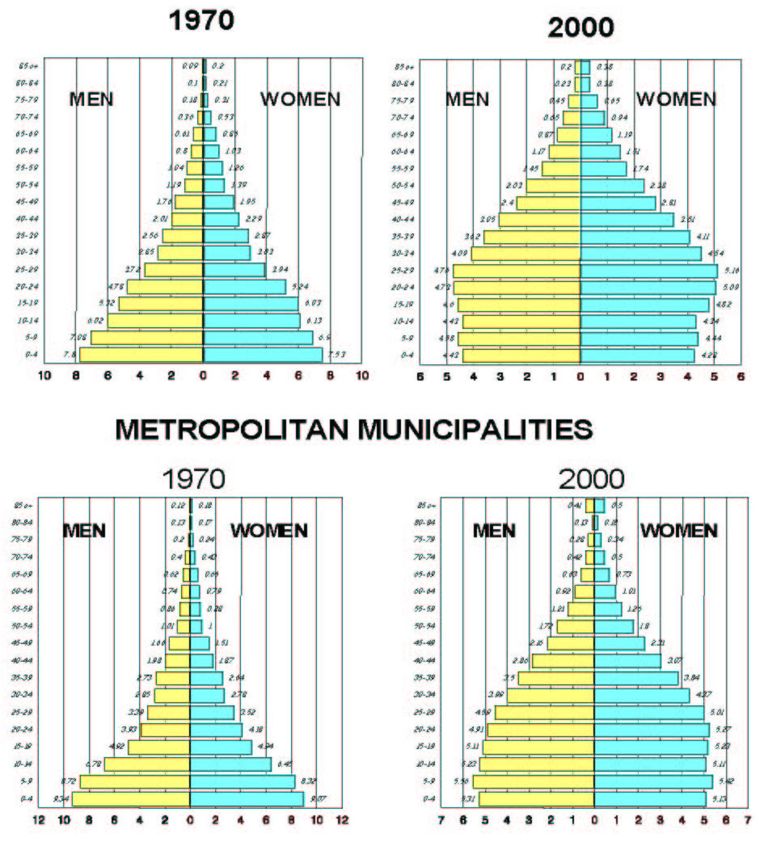
Urban Slums Reports: The case of Mexico City, Mexico

Table 7: Mexico: a revolution in vital statistics                           increasingly, foreign direct investment by multinational
                                                                            companies, all nurtured by monetary, trade and public
GLOBAL FERTILITY RATE                                                       investment policies. As Table 12 shows, Mexico City’s
        1970                   2000                    2020                 contribution to the national economy, already dominant,
                                                                            continued to increase until 1970.
D.F. 5.3               D.F. 1.95               D.F. 1.6
                                                                               After this, Mexico City’s economic pre-eminence
TLAXCALA 8.4           GUERRERO 3.6            GUERRERO 2.0                 began to wane, coincident with the end of the long post
LIFE EXPECTANCY
                                                                            war global boom. The critical effects of world recession
                                                                            were postponed in Mexico, due to buoyant oil revenues
        1970                   2000                    2020                 and public expenditure financed by an escalating
D.F. 68 YEARS          D.F. 76 YEARS           D.F. 81 YEARS                national debt. This included ambitious public works proj-
                                                                            ects for Mexico City: the metro, roads and deep
OAXACA 50              CHIAPAS 70              CHIAPAS 79
                                                                            drainage, which gave a new lease of life to the now
Source: CONAPO (1982) México Demográfico; CONAPO (2002)                     metropolitan-scale city. The incipient recovery of the
http://conapo.gob.mx/                                                       North Atlantic and Japanese economies, the drop in oil
                                                                            prices and the increased interest rates precipitated the
                                                                            still inward-looking Mexican economy into unprece-
Table 8: Mexico City: mean annual growth rate 1990-2000
                                                                            dented fiscal crisis in 1982. The ensuing three-figure
                              POPULATION           HOUSEHOLDS               inflation rates, constant currency devaluations, abrupt
                                                                            substitution of economic nationalism for “free trade” and
 TOTAL METROPOLITAN                        1.70%                  3.72%     stringent cutbacks in public expenditure, particularly
 MEXICO CITY
                                                                            affected Mexico City for a number of reasons. City Hall’s
 FEDERAL DISTRICT                          0.44%                  1.59%     inability to pay its foreign debt curtailed the comprehen-
                                                                            sive public transport programme and public spending in
 METROPOLITAN
 MUNCIPALITIES                             2.96%                  3.99%     general (federal government actually had to take over
                                                                            Mexico City’s debt in 1984). As industries geared to the
 TOTAL NATIONAL                            1.90%                            domestic market went out of business (the city as a
                                                                            whole lost over 385,000 industrial jobs between 1980
Source: Population Census 1990, 2000
                                                                            and 19936), construction protects ground to a halt and
                                                                            bureaucrats were rationalised out of work or decen-
                                                                            tralised, unemployment soared, pushing the rising adult
Table 9: Metropolitan Mexico City: economic
participation rate by gender 1970 and 2000                                  working population into informal occupations; commer-
(population of 12 years and over)                                           cial activities, particularly on-street vending became a
                                                                            particularly viable option in the face of rampant inflation.
                                              1970                          All this, combined with the devastating 1885 earthquake
                                                                            and increasing awareness of other environmental prob-
                                MEN          WOMEN          TOTAL
                                                                            lems, particularly traffic congestion and atmospheric
TOTAL METROPOLITAN                                                          pollution, undermined much of Mexico City’s compara-
                                   79.5%           27.0%          47.6%
MEXICO CITY                                                                 tive advantages causing, among other things, the rever-
                                                                            sal of migration flows.
FEDERAL DISTRICT                   70.6%           28.8%          48.4%

METROPOLITAN
MUNICIPALITIES
                                   69.9%           18.6%          44.0%     6. The Governments of Mexico City
Source: 1970 Garcia, B and O. Oliveria (2001) "El mercado de                   Mexico, or more correctly, the United Mexican States,
trbaajo 1930.1998) in G, Garza (coord,) La Ciudad de México en el
Fin del Segundo Milenio, p. 282; 2000: National Population Census
                                                                            is a federation with a three-tiered system of govern-
                                                                            ment: central government comprised of the executive
                                                                            branch (a six-term presidency and cabinet), congress
                                                                            and senate, elected for a three-year term, and the judi-
Table 10. Metropolitan Mexico City: percentage of
female-headed households 2000                                               cial branch; thirty-one state governments and one
                                                                            Federal District government (GDF), consisting of
                                                           2000             elected governors and congresses (or assemblies); and
                                                                            municipal governments with elected mayors (presi-
 TOTAL METROPOLITAN MEXICO CITY                                   22.3%
                                                                            dentes municipales)and councils (cabildos). All electoral
 FEDERAL DISTRICT                                                 25.8%     terms are non renewable. In spite of recent decentrali-
                                                                            sation policies, power and resources are highly concen-
 METROPOLITAN MUNICIPALITIES                                      18.7%     trated in central government, whose budget is roughly
Source: National Population Census                                          nine times that of all other levels of government
                                                                                                                                           10
U N D E R S TA N D I N G S L U M S : C a s e St u d i e s f o r t h e G l o b a l R e p o r t o n H u m a n S e t t l e m e n t s 2 0 0 3
Table 11. Metropolitan Mexico City: comparison between combined. Throughout most of the twentieth century,
emigrants, immigrants and those who did not migrate political power at all levels of government was virtually
1995 to 2000 monopolised by a single party: the Revolutionary
NON
Institutional Party (PRI). Political reform was started in
INMIGRANT EMMIGRANT
MIGRANT the late 1970’s, slowly at first, with electoral successes
UNDER 30.4% 19.0% 25.1% of opposition parties being limited to lower levels of
15 YEARS OLD government, but gathering momentum towards the end
OVER 69.6% 81.0% 74.9% of the century. The 2000 presidential elections returned
15 YEARS OLD Vicente Fox, representing the centre-right National
OVER 15 WITH ONLY 21.4% 31.7% 19.9% Action Party (PAN). Until 1998, the national President
PRIMARY EDUCATION
OR LESS
designated the Federal District government, like a
ministerial post, and he in turn designated heads (dele-
WITH HIGHER
EDUCATION* 16.8% 15.2% 23.3% gados) of the 16 delegaciones or boroughs. The first
elected Head of Government in the federal District was
ECONOMICALLY
ACTIVE** 40.6% 52.8% 53.8% Cuauhtémoc Cárdenas of the centre-left Revolutionary
* Teacher Training, Technical carreer, University and posgraduate Democratic Party (PRD), son of Lázaro Cárdenas, the
** Population of 12 years and over who work or a looking for work nationalist president of the 1930’s. The delegados were
also elected for the first time in 2000, resulting roughly
Source: 2000 National Population and Housing Census, Microdata of
10% sample with extended questionaire in an even split between the PAN and the PRD, while at
the same time, the Federal District’s electorate’s prefer-
ence for the centre-left was confirmed by the victory of
Table 12. Mexico: contribution of Mexico City to total PRD candidate Andrés Manuel López Obrador. In the
GDP 1990-1998, by economic sector same year, municipal and state government elections in
Mexico State returned a PRI governor and a mixture of
1900 1940 1970 1980 1988 1998 parties at the municipal level. The resulting highly
complex electoral geography Metropolitan Mexico City
Primary
sector
1.3% 2.0% 1.7% 2.2% 1.2% 1.5% is illustrated in Map 17.
The effects of these political and administrative
Secondary
7.9% 35.2% 41.9% 40.3% 31.0% 26.5% reforms are equally complex; the following are only
sector
Terciary
some of the main impacts on the lives of Mexico City’s
12.5% 35.2% 40.8% 40.3% 35.4% 37.9%
sector low-income populations. First, the replacement of the
traditional one-party corporativist clientilism by competi-
9.2% 30.1% 37.5% 37.7% 31.9% 32.5%
total tive electioneering has altered the unwritten rules
Note: from 1950 onwards, the population refers to Mexico City governing access to benefits and basic necessities,
Metropolitan Area, comprising the Federal Capital and a variable such as housing credits, urban services, regularisation
number of municapalities belong to the surrounding State of Mexico
(see Table 6). programmes and social subsidies. The role of political
Source: Sobrino, J. (2001) 'Participación económica'. In G Garza intermediaries, such as the “official” trade unions,
(coord.) La Ciudad de México en el Fin del Segundo Milenio, Gobierno
del Distrito Federal/ El Colegio de México, México DF. P.163
community leaders, professional invaders and other
kinds of grass-roots organisation representatives is
being undermined, though in many cases the same
practices and political culture persists, with different –or
Figure 6 Metropolitan Mexico city: Population growth sometimes the same- social actors on the scene.
1950-2000
Political reform is combined with changes in social
policy, which aims at replacing collective targeting and
aspirations of global coverage by the individualisation of
benefits with a view to “targeting the most needy”. The
practical effects are, however, uneven, given that all
levels of government, and different agencies within each
level of government, implement social policy. For
instance, the whole social policy framework of the new
Federal District Government, in which investment and
subsidies are allocated by committees at a micro territo-
rial level, is a radical departure from the systems oper-
ated by central government. And within the Federal
District, the interaction between the GDF and the dele-
Source: Population census of respective years gaciones varies according to the political colour and
particular policy of each delegación, giving rise to a
11Urban Slums Reports: The case of Mexico City, Mexico
multiplicity of situations regarding social policy imple-
Map 5: Mexico City: approximate location of lakes at
the time of the Spanish Conquest mentation and public participation. All these changes
are extremely recent and, given the wide variety of
outcomes, it is impossible at the moment to describe,
much less evaluate, the new styles of governance of
the various levels and instances of Metropolitan Mexico
City’s public administration.
II. HOUSING AND POVERTY
1. Types of “Slums” and Housing Poverty
in Mexico City: Introduction
Although most housing in Mexico would probably be
considered to be a slum by Northern European stan-
dards, the term “slum” –barrio bajo o tugurio in
Spanish- is not generally used to describe any specific
type of settlement or dwelling in this country today7.
This does not mean that the problem of bad housing is
not recognised; in fact many definitions of poverty
include unsatisfied housing needs8. But unsatisfied
basic housing needs, or “housing poverty”, is spread
throughout large areas of the city and seldom limited to
neighbourhoods identifiable as “slums”. It is also to be
found in a variety of housing types and settlements
including projects, which have been designed to
Source: OCIM-SIG Project Universidad Autonoma Metropolitana provide “decent homes” (una morada digna), all of
Azcapotzalco/CENVI; National Population Census (2000)
which also provide some excellent places to live. The
best way to describe and classify the “slums” of Mexico
Figure 7: Mexico City: mean, maximum and minimum
temperatures 2000 (Tacuba)
City is therefore to identify the main types of housing
and settlements where unsatisfied housing needs are
35 present. Clearly this description must refer to past
30
processes. The nature and extent of these unsatisfied
25
housing needs can then be quantified, together with
other indicators of poverty.
20
deg. C
15
10 2. Irregular Settlements
5 The most critical housing conditions in Mexico City
MEAN
0 MAXIMUM today are undoubtedly to be found in the asentamien-
Jan. March May July Sept. Nov.
MINIMUM
tos irregulares or colonias populares (“irregular settle-
Source: INEGI: Cuaderno Estadístico de la Zona Metropolitana ments” or “popular colonies)9 The term colonias popu-
de la Ciudad de México pp- 8-9
lares –the Mexican equivalent to the Brazilian favelas,
the barrios de rancho of Caracas or the pueblos nuevos
of Lima- is really a residual category: the colonias are
defined not by what they are, but by what they are not.
Essentially, popular denotes not “well to do”, though not
necessarily “poor” or “extremely poor” and “irregular”
means that they were not legally developed. The
causes of their illegality, however, have included a vari-
ety of closely interlinked conditions: unauthorised land
development, non-fulfilment and inexistence of building
permits, initial and sometimes permanent lack of urban
services, high risk of flooding, landslides or other
hazards, dubious or inexistent original and subsequent
property titles, the operation of alternative property
12U N D E R S TA N D I N G S L U M S : C a s e St u d i e s f o r t h e G l o b a l R e p o r t o n H u m a n S e t t l e m e n t s 2 0 0 3
jurisdiction, in this case, agrarian communal property of their population; these still provide extremely precar-
law, with all its ambiguities and contradictions. And, of ious conditions to almost all their inhabitants. Ciudad
course, the definition of illegality depends on legislation, Nezahualcóyotl, a vast agglomeration of irregular subdi-
which is in constant evolution. Most settlements have visions originating in the 1950’s, with a current popula-
become “regularised” to a varying degree, as land titles tion of over 1.2 million, is now highly consolidated, with
were devised and distributed, infrastructure and serv- its own local economy and good services. It still
ices put in, the houses improved, and shops, offices and contains, however, a large proportion of precarious
small or large businesses installed. Yet, except in the dwellings without water and drainage. Perhaps one of
very few cases where blanket gentrification has the advantages of this kind of housing development is
occurred, the colonias populares never become the high degree of social heterogeneity achieved. The
completely regular. Moreover, as time goes by, the regu- majority of irregular settlements existing today in
larised properties become irregular again, through Metropolitan Mexico City were formed between the mid
intestate inheritance, dilapidation or fiscal problems. 1950’s and the 1980’s. Map 18 shows their location;
Perhaps a more important defining characteristic of Table 13 shows some main housing indicators for
irregular settlements is not their multifaceted and Mexico City’s colonias populares in 1990. Boxes 1, 2
confusing legal status, but the order in which they have and 3 describe the origins, development and current
been built. Particularly important is the absence of credit
for building. The plots have often been bought in instal-
ments from the informal developers and landowners, Figure 8: Metropolitan Mexico city: age pyramids
1970 and 2000
but usually without the intervention of any financial insti-
tution. The lack of credit means that the whole process
has been financed, and therefore built, is stages; the
rate of progress depended on the amount of spare cash
each family could muster. More importantly, the urbani-
sation process was also incremental: starting with land
occupation, followed by electricity, road improvements,
water, drainage, telephone lines. The whole process of
consolidation has occurred at different paces and to
variable degrees. In many settlements, especially in the
South of the city, better off people bought plots in colo-
nias where consolidation is well underway, thus acceler-
ating the improvement process. In general, it is true to
say that the colonias which were established in the
fifties, sixties and seventies took longer to achieve serv-
ices than the more recent ones, although the quality of
housing in the latter is not necessarily any better (see
below). The question, often asked, as to whether irreg-
ular settlements and “self-build” housing is a good or
bad solution is too general; they were the solution
during the explosive stages of Mexico City’s develop-
ment but the quality of environment they provide is
extremely varied, both from one colonia to another, and
within a single colonia.
As is often cited, Mexico City’s irregular settlements Figure 9: Metropolitan Mexico City: distribution of
constitute roughly half of the urbanised area and house economically active male and female population by
more than 60 per cent of the city’s population: a fairly monthly income level 2000
wide social spectrum not necessarily limited to the poor-
0.8
est 60 percent. It is misleading, therefore, to classify 0.7
them all indiscriminately as slums (as sometimes is the 0.6
case in international housing literature). Some have 0.5
0.4
become over the years extremely nice places to live. 0.3
Appearances are deceptive, however, and alongside 0.2
high quality houses, very substandard housing condi- 0.1
0
tions subsist. Other Colonias populares, start out poorer TOTAL Men Women
and/or never consolidate or improve for a variety of
FEDERAL DISTRICT METROPOLITAN MUNCIPALITIES TOTAL
reasons, including elevation and topographical condi-
tions, obstacles to regularisation, or simply the poverty Source: Population census 2000
13Urban Slums Reports: The case of Mexico City, Mexico
situation of the three selected municipalities which have quality of habitat for most of the metropolitan population.
been urbanised almost completely by irregular settle- Before turning to the quantitative analysis of housing
ment processes: Ciudad Nezahualcóytl, Valle de conditions in the colonias populares, it is helpful to
Chalco Solidaridad and Chimalhuacán. describe some other types of housing could fall into the
The boxes describe irregular settlements, which were category of “slum” in Mexico City.
formed, on a massive scale before 1990. In more recent
years, the process has continued, but in a more
dispersed manner, and it is unlikely that new Ciudad 3. Vecindades or inner city tenements:
Nezahualcóyotls or Valle de Chalcos will spring up on the traditional slum and present-day
an equal scale as before, for various reasons, including rented housing
the demographic tendencies already mentioned, but In the past, specifically in a study published by the
also because of new tendencies in formal housing (now extinct) National Housing Institute (INV 1958a),
production. Most of the city is already built, and what the area surrounding the Mexico City’s central square
happens within these built up areas will determine the on all sides except to the West was referred to the
herradura de tugurios (“horseshoe of
hovels or slums”) because of the high
concentration of overcrowded rented
tenements:the traditional vecindades
10 This house-type evolved from the
Spanish courtyard building, with
rooms distributed around a central
patio: a model, which dominated
domestic architecture until twentieth
century, both as individual houses or
collective mesones. Many of the late
nineteenth century vecindades were
grand houses, which were abandoned
by the upper classes from the last
decades of the nineteenth century, in
favour of newly urbanised residential
areas; the rooms were then let off to
one or several families or individuals.
A few of these very old vecindades
and mesones survive today, some still
as cheap housing; those contained in
architecturally valuable properties
Figure 10: Metropolitan Mexico City: access to housing by have been mostly converted to other
income level 1988 uses.11
As the city grew during the porfirian
"EXTREMELY POOR" - IRREGULAR PERIPHERY
LESS THAN 1.5 TIMES STREET, RENTED ROOMS 17.00% dictatorship, purpose-built vecindades
MINIMUM WAGE
were built for profit in and around the
"VERY POOR" 1.5-2.5
IRREGULAR PERIPHERY, CONSOLIDATED PERIPHERY, RENTED
Eastern quarters of central Mexico
ROOMS
16.10%
TIMES MINIMUM WAGE
City to meet the increasing demand
CONSOLIDATED IERREGULAR SETTLEMENT, SOCIAL INTEREST HOUSING, RENTED for cheap housing12, the central patio
"MODERATELY POOR" 2.5- ROOMS
5 TIMES MINIMUM WAGE 28.30% having shrunk in most cases to a
CONSOLIDATED IRREGULAR SETTLEMENT,
narrow passage providing access,
"WITH ECONOMIC
PROBLEMS 5-10 TIMES
SOCIAL INTEREST HOUSING, RENTED
APARTMENT 14.90% lighting, ventilation and “semi-public”
MINIMUM WAGE"
space to one and two-roomed houses.
CONSOLIDATED SETTLEMENTS,
"MIDDLE CLASS" 10-25 FORMAL SECTOR RENTED OR Latrines, if there were any, were
TIMES MINIMUM WAGE OWNED HOUSING
15.30%
usually shared; sewage mostly was
"RESIDENTIAL" HOUSES, dumped into open drains, which
"AFFLUENT" 25+ TIMES CONDOS.
MINIMUM WAGE & APARTMENTS 8.50% emptied into the streets. By 1913,
water born sanitary drainage was
% FAMILIES
available in Mexico City and, as the
Source: income Distribution and "poverty definitions": Boltvinik J. “Incidencia e intensidad de
la pobreza en México”, in Boltvinik, J. and E. Hernández Laos (1999) Pobreza y Distribución
twentieth century progressed,
del Ingreso en México, México, Siglo XXI, p. 194. Based on the National Survey of communal tap water and flush lavato-
Household Income and Expenditure. Housing Types: own assessment. ries were introduced into the vecin-
14U N D E R S TA N D I N G S L U M S : C a s e St u d i e s f o r t h e G l o b a l R e p o r t o n H u m a n S e t t l e m e n t s 2 0 0 3
dades, with some of the better acquiring individual serv- 20th century, both as individual houses or collective
ices. But been urbanised almost completely by irregular mesones. Many of the late 19th century vecindades were
settlement processes: Ciudad Nezahualcóytl, Valle de grand houses, which were abandoned by the upper
Chalco Solidaridad and Chimalhuacán (Plates 7 to 12). classes from the last decades of the 19th century, in
The boxes describe irregular settlements, which were favour of newly urbanised residential areas; the rooms
formed, on a massive scale before 1990. In more recent were then let off to one or several families or individuals.
years, the process has continued, but in a more A few of these very old vecindades and mesones
dispersed manner, and it is unlikely that new Ciudad survive today, some still as cheap housing (Plate 13);
Nezahualcóyotls or Valle de Chalcos will spring up on those contained in architecturally valuable properties
an equal scale as before, for various reasons, including have been mostly converted to other uses11
the demographic tendencies already mentioned, but As the city grew during the Porfirian dictatorship,
also because of new tendencies in formal housing purpose-built vecindades were built for profit in and
production. Most of the city is already built up, and what around the eastern quarters of central Mexico City to
happens within these built up areas will determine the meet the increasing demand for cheap housing12, the
quality of habitat for most of the metropolitan population. central patio having shrunk in most cases to a narrow
Before turning to the quantitative analysis of housing passage providing access, lighting, ventilation and
conditions in the colonias populares, it is helpful to "semi-public" space to one and two-roomed houses.
describe some other types of housing that could fall into Latrines, if there were any, were usually shared; sewage
the category of "slum" in Mexico City. mostly was dumped into open drains, which emptied
into the streets. By 1913, water-born sanitary drainage
was available in Mexico City and, as the 20th century
3 Vecindades or Inner City Tenements: progressed, communal tap water and flush lavatories
The Traditional Slum and Present-Day were introduced into the vecindades, with some of the
Rented Housing better ones acquiring individual services. But progress
In the past, specifically in a study published by the here was slow: by 1960, only 54 percent of all dwellings
(now extinct) National Housing Institute (INV 1958a), in the DF had toilets with running water, (43 percent of
the area surrounding the Mexico City's central square all dwellings had only one room!) (VIII General
on all sides except to the west was referred to as the Population Census, 1960) It would be wrong, however,
herradura de tugurios ("horseshoe of hovels or slums") to classify all housing built on the vecindad model as
because of the high concentration of overcrowded "slums". Many better-off vecindades built in the early
rented tenements: the traditional vecindades10. This twentieth century and later still provide good housing
house-type evolved from the Spanish courtyard build- conditions (Plates 14 and 15).
ing, with rooms distributed around a central patio: a Cheap rented dwellings in vecindades continued to
model, which dominated domestic architecture until the be built throughout the century as the city grew,
Table 13. Metropolitan Mexico City 1990*: selected indicators of housing in colonias populares (irregular settlements)
% % % %
% %
dwellings dwellings dwellings dwellings % owner
No. inhabited dwellings dwellings % rented
Vertical % with without without without occupied
dwellings with only 1 without dwellings
"shanty" mains mains mains dwellings
bedroom electricty
roofing (e) drainage drainage drainage
Total Metropolitan
3,119,779 100.0% 20.5% 35.6% 1.8% 17.6% 35.7% 69.2% 21.9%
Mexico City
Total Colonias
1,888,170 60.5% 26.5% 43.0% 2.1% 21.1% 46.2% 66.5% 23.8%
Populares
low density/
193,184 6.2% 40.8% 45.8% 7.4% 55.1% 64.4% 79.0% 11.7%
incipient (a)
medium density/
684,945 22.0% 32.4% 43.5% 2.3% 31.2% 55.5% 73.0% 17.2%
consolidating (b)
high density/
749,918 24.0% 23.1% 43.0% 1.0% 9.3% 42.9% 63.3% 26.8%
consolidated (c)
inner city colonias
260,123 8.3% 9.9% 39.4% 1.1% 3.2% 17.8% 49.5% 41.2%
populares (d)
* Metropolitan Mexico City was defined in this study as the Federal District plus 37 municipalities of Mexico State and one in Hidalgo State.
(a) less than 100 hab./ ha. (b) between 101 and 250 hab./ha. (c) over 250 hab./ha. (d) 4 central delegations (e) asbestos, bituminous corrugatresd
cardboard roofing or galvanised tin.
Source: Centro de la Vivienda y Estudios Urbanos (1998) Escenarios demográficos y Urbanos de la Ciudad de México 1990-2010, Database.
15Urban Slums Reports: The case of Mexico City, Mexico
Map 6: Metropolitan Mexico City: topographic map and although they ceased to provide the profit-motive
present day built up area (urban census tracts) behind new urbanisation from the 1940’s onwards. A
number of reason explain this change, including the
introduction of frozen rents in 1941, the tightening up of
building regulations and the emergence of more lucra-
tive investment opportunities in industry and commerce.
Perhaps more importantly, a new form of urbanisation
emerged as the dominant from housing provision for
everybody except the wealthy: the ever-increasing
supply of cheap unserviced lots in the colonias popu-
lares for owner-occupied “self-built” (or “self-financed”)
dwellings.
The appearance on a massive scale of irregular
settlements did not, however, mean the extinction of the
vecindades. These continue to be built within the colo-
nias populares themselves, especially as these consol-
idate. In appearance, these vecindades are similar to
the traditional ones, except that grey cement blocks with
concrete slab or cardboard roofs have replaced adobe
and traditional forms of techumbre13. According to the
2000 population census, which for the first time included
the house type in its questionnaire, there are 443 thou-
sand dwellings in vecindades in Mexico City, 10 per cent
of the total. Table 14 gives some idea of the varied qual-
ity of housing standards they provide.
As Map 19 shows, the major concentrations of vecin-
Source: OCIM-SIG Project Universidad Autonoma Metropolitana dades are not in the inner city, but in the consolidated
Azcapotzalco/CENVI; National Population Census (2000)
irregular settlements, notoriously in Ciudad
Map 7: Metropolitan Mexico City: population density Nezahualcóytl and other colonias to the East of the city.
by census tract 2000
A major difference distinguishes these peripheral vecin-
dades from the inner city prototypes: unlike the land-
lords of the latter, the owner and builders of the new
generations of rented tenements tend to live in or near
the property, often belonging to the same social class as
their tenants. Unless the property titles are in order and
the dwelling more or less complies with the building
regulations, which is extremely rare in the colonias
populares, there can be no legal contract between land-
lord and tenant; the agreement is usually verbal.
Surprisingly few conflicts arise out if this situation
(Coulomb and Sánchez 199114). Also surprising is the
fact that the renters in consolidated colonias populares
are not necessarily any poorer than the homeowners,
and many are certainly better off than the “home
owners” in new settlements in the far off periphery.
Rented or other forms of non-ownership tenure in colo-
nias populares do, however, show a higher proportion of
substandard indicators, such as lack of inside taps.
Table 15 compares income and housing indicators of
renters and owner-occupiers in Nezahualcóyotl, Valle
de Chalco and Chimalhuacán, three municipalities
largely comprised of colonias populares.
Not all rented housing in irregular settlements is
substandard and not all is in vecindades (in fact only 51
Source: OCIM-SIG Project Universidad Autonoma Metropolitana percent of vecindades are rented in the three selected
Azcapotzalco/CENVI; National Population Census (2000) municipalities). Clusters of rented single-family housing
in one plot and apartments are also to found. Moreover,
16You can also read