City Profile: Ahmedabad - Centre for Urban Equity (CUE) - Darshini Mahadevia Renu Desai Suchita Vyas - CEPT University
←
→
Page content transcription
If your browser does not render page correctly, please read the page content below
Ci
                                                             tyProfi
                                                                   le
                                                                    :
                                                            Ahmedabad
                                                 38009
                                                     0

                                                             Dar
                                                               shi
                                                                 niMahadevi
                                                                          a
                                                d-

                                                                Re
                                                                 nuDe sai
                                              ba

                                                               Suchi
                                                                   taVyas
                              Na va
                                  rng  a
                                     pur,   da
                                         Ahme
                              i
                              sty
                             d,
                            er
                            a
                           v
                         yRo
                    CEPTUni
Kat
  s bha
   ur   l
      iLa  iCa
         bha     ,
              mpusUnivr
                      est
                        i

                                                             CUEWorkingPaper26
                                                               Sept
                                                                  ember2014

                                                         Ce
                                                          ntr
                                                            eforUr
                                                                 banEqui
                                                                       ty(
                                                                         CUE)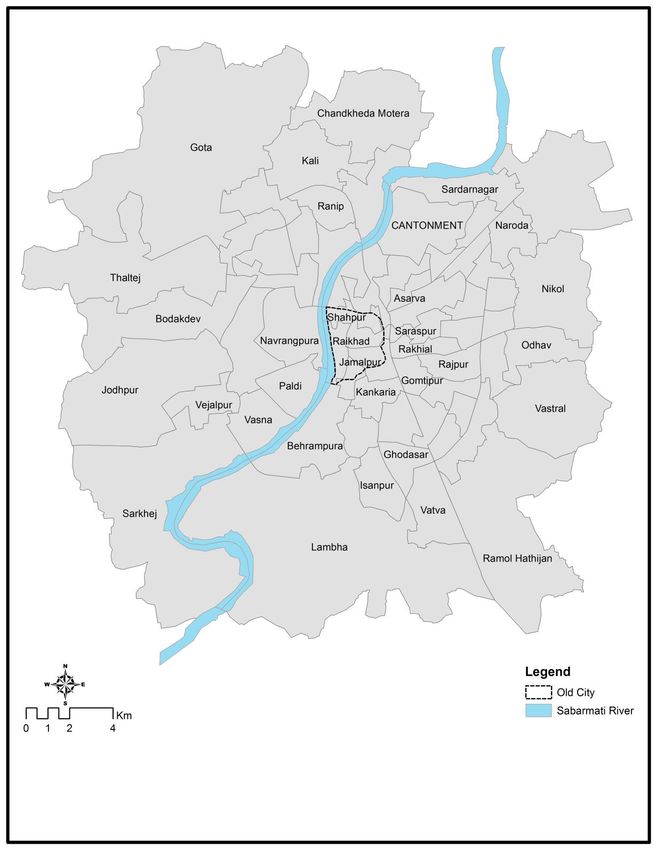
City Profile: Ahmedabad

            Darshini Mahadevia
(Centre for Urban Equity, CEPT University)

                Renu Desai
(Centre for Urban Equity, CEPT University)

               Suchita Vyas
(Centre for Urban Equity, CEPT University)

    CUE Working Paper 26
           September 2014

Centre for Urban Equity (CUE)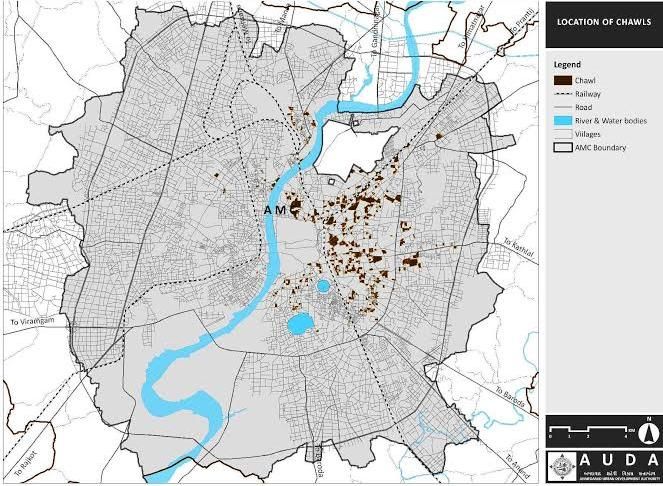
About Centre for Urban Equity (CUE)
CUE was established at CEPT University in 2009, evolving from the Urban Poverty
Alleviation (UPA) Cell established in 2008. CUE advocates a human-centered and equitable
urban development paradigm. CUE undertakes research and advocacy; conducts training and
capacity-building; imparts education; and networks with stakeholders on various aspects of
human settlements with a focus on urban equity.

Contact
Centre for Urban Equity (CUE)
CEPT University
Kasturbhai Lalbhai Campus
University Road, Navrangpura
Ahmedabad - 380009, India
Email: cue@cept.ac.in
Website: www.cept.ac.in/cue

CUE Working Paper Series
© Centre for Urban Equity 2014

Disclaimer
The comments and opinions in this paper are of the author(s) and not of the Centre for Urban
Equity or CEPT University.
Abstract

This paper profiles Ahmedabad, the seventh largest metropolis in India and the largest city of
Gujarat State, to develop a background understanding of the city for the research project
“Poverty, Inequality and Violence in Indian Cities: Towards Inclusive Planning and
Policies.” The paper comprises of two parts. Part I lays out the relevant urban context by
discussing the city’s demography; transformations since liberalization and their impacts for
urban poverty and inequality; the historical growth of the city and the resulting spatial
segmentation; the status of housing amongst the urban poor and low-income groups; and the
urban development paradigm in terms of planning, housing, basic services, street vending and
public transport. Part II identifies and discusses some of the key arenas of conflicts and
violence that are linked to land, planning and governance regimes in the city, namely, slum
resettlement, informal urban peripheral settlements, and women’s safety and public transport.
These arenas of conflict and violence will be the focus areas for the research project.

                                                                                             i
Acknowledgments
This City Profile of Ahmedabad has been prepared under the research project “Poverty,
Inequality and Violence in Indian Cities: Towards Inclusive Planning and Policies.” This
work was carried out with financial support from the UK Government's Department for
International Development (DFID) and the International Development Research Centre
(IDRC), Canada. We are grateful to them for funding this project under the global research
programme on “Safe and Inclusive Cities.” The opinions expressed in this work do not
necessarily reflect those of DFID or IDRC.
We would like to acknowledge numerous people who gave their time to discuss Ahmedabad
with the CUE team and organize field visits for us in different parts of the city during June-
December 2013:
Karen Nazareth, Niraj Jani and SAATH staff
Bijal Bhatt and Mahila Housing Trust (MHT) staff
Sara Baldiwala, Ahmedabad Women’s Action Group (AWAG)
Father Rajeev, St. Xavier’s Social Service Society
Sanchetna staff
Sudhir Katiyar and Prayas staff
Reena Parmar, Sejal Dave and Ajeevika Bureau staff
Gazala Paul, Afrozben and Samerth staff
Rafi Malek, Meera Malek and Centre for Development (CfD) staff
Beena Jadhav
Noorjahan Diwan
Urvish Kothari
Prashant Dayal
Gagan Sethi, Janvikas
Martin Macwan, Dalit Shakti Kendra, Navsarjan Trust
Manjula Pradeep and Navsarjan Trust staff
iiContents
Abstract ....................................................................................................................................... i
Acknowledgments......................................................................................................................ii
INTRODUCTION ..................................................................................................................... 1
PART I: CONTEXT .................................................................................................................. 5
1. Demography ........................................................................................................................... 5
2. The Liberalizing and Globalizing Economy .......................................................................... 6
2.1. The Gujarat Context........................................................................................................ 6
2.2. Economic Changes, Labour Informalization, Poverty and Inequality in Ahmedabad ... 9
3. Spatial Segmentation ........................................................................................................... 12
4. Housing, Poverty and Inequality.......................................................................................... 16
5. The Urban Development Paradigm ..................................................................................... 19
5.1. Urban Planning: Town Planning Schemes and Urban Projects .................................... 21
5.2. Housing and Basic Services for the Urban Poor: Policies and Programmes ................ 24
5.2.1. Reservation of Land for SEWS Housing in Town Planning Schemes .................. 24
5.2.2. Slum Networking Programme (SNP) .................................................................... 25
5.2.3. Slum Sanitation Schemes ....................................................................................... 25
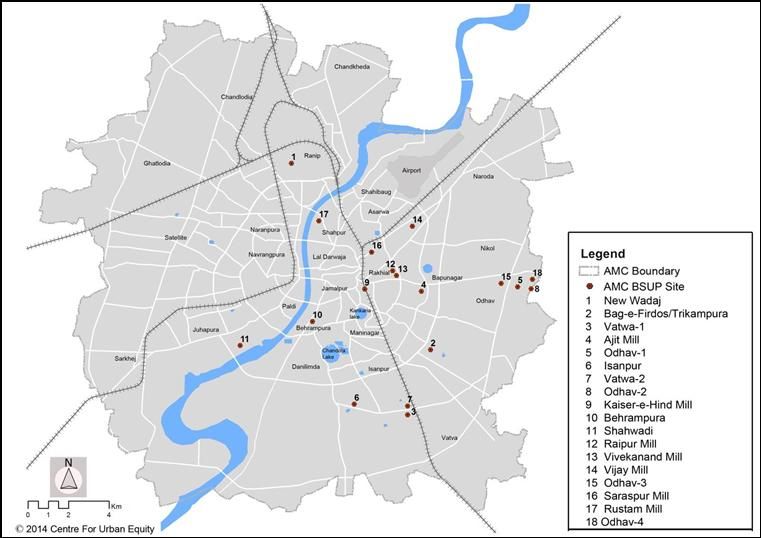
5.2.4. Basic Services for the Urban Poor (BSUP) ........................................................... 26
5.2.5. In-Situ Slum Rehabilitation Schemes .................................................................... 28
5.2.6. State Government Housing Policies and Programmes .......................................... 30
5.3. Urban Policies and Legislations affecting Street Vending ........................................... 31
5.4. Public Transport Approach ........................................................................................... 34
PART II: URBAN PLANNING, CONFLICTS AND VIOLENCE ........................................ 38
6. Slum Resettlement ............................................................................................................... 38
7. Informal Urban Peripheral Settlements ............................................................................... 42
8. Public Transport and Women’s Safety ................................................................................ 48
CONCLUSION ........................................................................................................................ 50
REFERENCES ........................................................................................................................ 55
iiiiv
INTRODUCTION

Inspite of low rate of urbanisation in India1 in the last two decades, cities have not been able
to provide the growing urban population with viable housing, potable water, adequate
sanitation, employment at reasonable wages, access to education and healthcare, accessibility
to work and other opportunities and social security. As a result, a large proportion of the
urban population is constrained to live in slums or informal settlements, depend on the
informal sector for their livelihood, access water supply, education and healthcare in the
private informal sector and use informal transport options. Parallel to this, over the past
decade or two, governments and elites have been pushing for urban development that would
transform Indian cities according to their images of a world-class or global city (see, for e.g.
Dupont 2011; Desai 2012a; Mahadevia 2011a). This has resulted in urban exclusions through
land-use planning, inequitable land allocations, increasing commercialization of land,
implementation of infrastructure and beautification projects, privatization of urban services,
criminalization of the informalities of the poor, and urban governance processes in which
only the influential and organized sections have a voice (see, for e.g. Benjamin 2008;
Mahadevia and Narayanan 2008; Anjaria 2009; Bhan 2009; Graham et al 2013; Kundu
2009). Researchers have also claimed that the urban elites are capturing urban resources,
land, finance and water, through various means, forcing the poor to depend on and contest
over available resources, for which they pay high economic and social costs. One of the costs
that the poor pay are facing and negotiating conflicts in their daily life over survival.

These forces of neo-liberal globalization are leading to evictions of poor and marginalised
groups from their informal habitats and livelihoods, withdrawal of state actors from the
delivery of urban services with this space being filled up by non-state actors (some call this as
the emergence of a proto state) creating “ungoverned territories” and increasing segmentation
on account of speculative land markets overlaid on the base of caste- and religious
segmentation. As a result, the poor and marginalised face more violence than before from
state and non-state actors in the places where they live and work. They respond through
coping strategies, non-violent mobilizations in some instances, and counter-violence in other
instances. Many Indian cities have also become more segmented along caste, religious and
ethnic lines (see, for e.g. Gayer and Jaffrelot 2012), which is likely to further develop chains
and webs of violence. While gender has never been mainstreamed into urban planning in
India, the above-mentioned processes are often creating even more unsafe urban spaces for
women and girls (see, for e.g. Menon-Sen 2008; Polanki 2012; Viswanath 2013). Indian
cities are thus seeing increasing deprivations and inequalities, conflicts and violence.

While the incidences of violence are being increasingly reported in the media and captured in
the crime statistics, the links between poverty, inequalities, types of violence and urban
planning have not been analysed and understood in the context of Indian cities. First of all,
the concepts of crime and violence are mixed up and so are the concepts of violence and
conflicts. We have not addressed these conceptual issues in this paper. But, this research will
investigate potential pathways through which urban planning and governance mechanisms
become drivers of deprivations and different types of conflicts and violence, as well as the
                                                                                               1
experience of and response to these by different social groups. The research aims to develop
an understanding of if, and how, urban planning and governance interventions can help
reduce urban tensions, inequalities, conflicts and violence in Indian cities. Hence, this
research has limited focus and has resisted the temptation to move into other interesting
spheres of urban violence and their causes.
Ahmedabad is one of the cities selected for this research. The City Profile of Ahmedabad has
been prepared to develop a background understanding of the city in relation to the research
questions posed by this research project. The profile, along with other conceptual and
methodological papers, will serve as a foundation for the field research undertaken in the city
in 2014-15. We begin by briefly outlining urban violence in Ahmedabad and our approach to
it, and how that informs this City Profile paper.
Urban violence is often understood and measured in terms of crime in a city. Ahmedabad has
for long carried a safe city tag. According to the National Crime Records Bureau (NCRB)
report of 2003, Ahmedabad had the lowest crime rate of the 35 Indian cities with a population
of more than one million. In 2003, there were 16,199 registered cases.2 Almost a decade later,
the situation has changed significantly. The NCRB report of 2012 stated that the city ranked
fourth in India with 21,347 registered cases. Between 2003-12, there was thus a 32 per cent
increase in registered cases. The crime rate (complaints registered per one lakh population) in
Ahmedabad for 2012 was 336.1; higher than the national crime rate of 294.9 (NCRB 2012).
The NCRB data refers to crimes registered under the Indian Penal Code (IPC) and includes
murder, robbery, theft, burglary, kidnapping, assault, etc. While this data gives us an insight
into the types and levels of different types of crimes, they do not reveal the complete truth as
not all the cases of crime get registered owing to various reasons. There is often
underreporting of certain crimes, such as if these are perpetrated on the poor and dalits, on
women (rapes, sexual harassment, honour killings, dowry deaths); thefts;3 suicides and deaths
due to malnourishment (both get accounted as natural deaths) and so on. Also, crimes get
reported in places with higher literacy and population awareness and also where police
stations are present. Thus, less developed places have lower registration of crime as
compared to more developed places. Hence, it would be difficult to tell whether the increase
in registered cases over 2003-12 is due to actual increase in incidence of crime or is just
because of increased reporting of the crime. It is also difficult to compare cities for incidence
of crime, as there will be wide variability with regards to crime reporting in each of them.
The NCRB data also has other limitations. It fails to explain the motive or intention behind
these crimes, that is, nothing is known about the epidemiology of the crimes and hence it is
not possible to understand the cause of the crime. The data also does not tell us about the
spatiality of these crimes in the city. Further, importantly, crimes form one vector in the
violence universe. There are other incidences of violence that do not get registered as crime
and all crime registered may not be violence. Lastly, it is difficult to make out from the IPC
registered crimes whether there is any linkage of these with the urban planning and policies,
the focus of this research.
2The incidents of violence linked to urban planning and governance sometimes get reported by
the media, but these are not usually considered to be crimes and hence not reported as such.
Example of these is forced evictions of the urban poor by state authorities under
infrastructure development projects like the Sabarmati Riverfront development and road-
widening and forced evictions and harassment of street vendors in Ahmedabad. Print media
has also reported on the negligence of the authorities towards provision of basic services like
water supply and sanitation to poor localities, and has reported on mushrooming of illegal
connections, informal arrangements, conflicts over accessing these services and increasing
health hazards. A number of news articles have revealed the functioning of illegal activities
like drug supply networks, bootlegging and youth gangs in the city. A news article in October
2013 revealed the network and localities of drug suppliers in the city. It stated that the supply
of drugs is not just limited to slums and old city areas but is widespread across the city,
including in the posh localities of the Paldi and University areas. News articles have also
reported on conflicts over land between land mafias, especially in the peripheral areas of the
city. In early 2014, media reported protests by women living in low income neighbourhoods
against increased presence of local ruffians and goons, engaged in bootlegging, drug supply,
etc. who have taken to harassing young and old women of the locality; and women going to
the police station to register complaint but being unsuccessful. There is potential of such
protests resulting in violence at any time. Newspapers have also reported kidnappings of
children. Many of these localities are low-income neighbourhoods. Kidnappings of children
are not always reported, and some have happened at some of the slum resettlement sites in
Ahmedabad. Kidnappings for ransom seeking from high-income families or settling scores in
business do get reported, which do not have links with urban planning and governance.
Since the late 1960s, Ahmedabad has also witnessed violent episodes during which most of
the crimes that are committed are not registered. These are the episodes of communal and
caste violence in the city. Over the years, the print media, civil society organizations and
researchers have written about them. Most recent communal violence took place in 2002 with
the majority of its victims being Muslim. The media has often reported on the inadequate
basic services in the Muslim ghettos that have emerged in the city as a result of this violence.
All of the above are forms of conflict and structural violence in the city, with some of them
also including direct violence by the state and state actors or by powerful non-state actors
with the protection of the state. These are not registered in the crime statistics.
This research project examines the forms of urban violence that emerge directly or indirectly
from urban planning and governance. In Part I of this City Profile we lay out the relevant
urban context by discussing the city’s demography; transformations in the city since
liberalization and impacts on urban poverty and inequality; the historical growth in the city
and the emerging spatial segmentation; the status of housing for the urban poor and low-
income groups; and the urban development paradigm in terms of planning, housing, basic
services, street vending and public transport in the city. This discussion is based on secondary
sources, primary research with key informants and field visits in the city as well as an
analysis of policies, legislations and programmes. Part II identifies and discusses some of the
3key arenas of conflicts and violence that are linked to land, planning and governance regimes
in the city, namely, slum resettlement, informal urban peripheral settlements, and women’s
safety and public transport. This is based on primary research with key informants in the city
as well as field visits. These arenas of conflict and violence will be the focus areas for the
research project.
4PART I: CONTEXT
1. Demography
Ahmedabad, with a population of 5.8 million in the municipal area and 6.3 million in the
urban agglomeration area in 2011, is the seventh largest metropolis in India and the largest
city of Gujarat State. The municipal area is under the jurisdiction of the Ahmedabad
Municipal Corporation (AMC), whose limits were last extended in 2010 to cover an area of
466 sq.km. The previous extension of the AMC limits was in 1986. Hence, the city limits
have been extended from time to time once the peripheral areas develop, generally on their
own. The Ahmedabad Urban Agglomeration (AUA) includes four towns and 103 villages
besides the municipal area, and covers a total area of 1,866 sq.km. There is one more entity in
the governance structure of the city and that is Ahmedabad Urban Development Authority
(AUDA), which is a planning authority and largely covers the AUA area and more (AUDA
2013). The AUA area is defined by population census office and is not an administrative unit,
and is larger than the AMC area (for role of the AMC and AUDA in urban governance, see
Mahadevia 2010a).
Table 1: Population and Growth Rate of AMC area and AUA
Year AMC AUA Gujarat urban CAGR over
Population (in CAGR over previous Population (in CAGR over previous previous decade ***
millions) decade millions)*** decade***
1981* 2.16 3.1 2.55 3.5 3.5
1991* 2.88 2.9 3.31 2.7 2.9
2001* 3.52 2.0 4.52 3.2 2.9
2011** 5.57 4.7 6.35 3.5 3.1
Source:
* AMC 2005 (for 1981-2001 population figures)
** Census 20114
*** Mahadevia (2012: 3)
The peripheral areas of the city have registered higher population growth rate than the central
parts as expected and hence, the Compound Annual Growth Rate (CAGR) of the AUA area
has tended to be generally higher than that of the AMC area except in the years when the
latter’s boundary has been extended (Table 1). In typical nature of a market economy, the
land prices determine where the households would decide their location; the low income
households affording to locate on the cheaper lands on the periphery whereas the high income
groups wanting large plots too moving out to the periphery, leading to urban sprawl and high
population growth on the peripheries. Public housing too responds to this market logic and
locates low-income housing on the periphery. Ahmedabad is no exception to these processes.
Although, Ahmedabad has not registered fastest population growth among the cities in
Gujarat (that position is occupied by Surat for many years now), the AUA’s population
growth rate has been higher than that of Gujarat since the decade of 1990s.
The latest available disaggregation of population by religion is of 2001, according to which,
84.6 per cent of the population of Ahmedabad district is Hindu, 11.4 per cent is Muslim and
52.9 per cent is Christian.5 The city has a higher proportion of Muslims than in Gujarat as a
whole. In 2001, while Muslims constituted 8.7 per cent of the state population,6 their
proportion in Ahmedabad was higher at 12.4 per cent (Jaffrelot and Thomas 2011) and in
Ahmedabad district too as seen above. In 2001, Scheduled Caste (SC) were 10.94 per cent
and Scheduled Tribe (ST) were 0.94 per cent city’s population.7
2. The Liberalizing and Globalizing Economy
Over the past few decades, processes of liberalization and globalization have reshaped
Ahmedabad’s economy and labour markets. This section presents the changing economy of
the city against the background of Gujarat’s political economy, which has impacted the city’s
economy as well as urban development paradigm, housing for the urban poor and extent of
inequalities.
2.1. The Gujarat Context
Gujarat is one of the fastest growing economies of the country. It had an average economic
growth rate of 10 per cent per annum for the period of 2004-05 to 2009-10, making it surpass
the national average of 8.4 per cent per annum for this period (Table 2). For the same period,
all sectors of Gujarat’s economy, i.e., primary, secondary and tertiary sectors, registered
higher growth rates than the national averages in the respective sectors. The secondary sector
and the tertiary sector contributed to one-third and half of the state gross domestic product,
respectively, for this period (Mahadevia 2012).
Table 2: Real gross domestic product growth rates (% per annum)
Fiscal year India Gujarat state
2004–05 7.5 8.9
2005–06 9.5 15.0
2006–07 9.6 8.4
2007–08 9.3 11.0
2008–09 6.8 7.0
2009–10 8.0 10.2
Avg. 2004–05 to 2009–10 8.4 10.1
Source: Planning Commission, Government of India, http://planningcommission.gov.in (accessed
31.10.11).
However, in terms of the social development, the economic growth has not translated into
improved human development. The state has been ranked first amongst 20 major Indian
states in terms of fixed capital investments and fourth in terms of total number of factories,
but it ranks poor in the Human Development Index (HDI). The Gujarat Human Development
report, 2004 (Hirway and Mahadevia 2005) points that since 1980s, the state has seen high
urban-rural inequality and the state lags behind in human and gender development (it was
ranked 6th among the 15 largest Indian states then) (Hirway and Mahadevia 2005).
Subsequently, the situation has not improved. The Raghuram Rajan Committee Report on
Evolving a Composite Development Index of States puts Gujarat’s overall, economic as well
as social development at 10th rank among 21 large states in India, indicating that 9 states
performed better than the state in the development index (GOI, Ministry of Finance 2013:
17). Gujarat’s growth has been private-sector driven, in which the government has handed the
6powers and functions of key sectors like roads, power and ports to corporates, more so since
2000. The result is that ordinary people have paid a heavy price for its economic growth
(Hensman 2014).
The official poverty line, calculated by the Planning Commission of India, does not put the
state at high level of poverty. The incidence of urban poverty, also known as the Head Count
Ratio (HCR), which is proportion of population below the official poverty line, has declined
by 10 percentage points from 20.1 per cent to 10.1 per cent during the seven-year period of
2004-05 to 2011-12 (Table 3). The absolute number of people below the poverty line has
declined by 6.3 per cent per annum (p.a) during the seven-year period. In urban India, this
rate is 5.8 per cent p.a. The decline in rural poverty in this seven-year period has been 7.2 per
cent p.a. in Gujarat and 5.6 per cent p.a. in India. Hence, both, the rural as well as urban
poverty have declined at a faster rate in Gujarat than in India from 2004-05 to 2011-12. In all
the years in Table 3, rural as well as urban HCRs are lower in Gujarat than in India.
Table 3: Incidence* of Poverty, Gujarat and India
2004-05 2009-10 2011-12
Gujarat India Gujarat India Gujarat India
Rural 39.1 42.0 26.7 33.8 21.5 25.7
Urban 20.1 25.5 17.9 20.9 10.1 13.7
Total 31.6 37.2 23.0 29.8 16.6 21.9
* Percentage of population below the poverty line. It is alternatively termed as poverty Head Count
Ratio (HCR).
Note: All three poverty estimates are by the methodology proposed by the Tendulkar Committee
(GOI, Planning Commission, 2009).
Source:
a) 2004-05 and 2009-10 – GOI, Planning Commission (2012).
b) 2011-12 – GOI, Planning Commission (2013: 6)
Table 4: Incidence of Urban Poverty (HCR) by Social and Religious Groups, Gujarat
and India
2004-05 2009-10 2011-12
Gujarat India Gujarat India Gujarat India
Scheduled Castes 18.7 40.6 29.4 34.1 12.7 21.7
Scheduled Tribes 31.2 35.5 32.2 30.4 30.1 24.1
Hindus 17.6 23.1 13.8 18.7 9.7 12.1
Muslims 42.3 41.8 42.4 33.9 14.6 22.7
All* 20.1 25.7 17.7 20.9 10.2 13.7
* There is marginal difference in the HCRs for all groups in some places between the figures in this
table and the previous table due to difference in the source of data.
Note: These estimates are by the Tendulkar Committee’s methodology.
Source: Panagariya and More (2013: 38 & 41).
Individual scholars have calculated incidence of poverty (HCR) among different social and
religious groups. One of the latest is by Panagariya and More (2013). Table 4 presents data
for only urban areas. It shows that the Scheduled Castes (SCs) in Gujarat had lower HCRs as
compared to the SCs in India. This was not the case with regards to the Scheduled Tribes
(STs), whose HCR was lower in Gujarat than in India in 2004-05, where after, there is speedy
7decline in the ST HCRs at India level but a one percentage increase in the HCR of ST in
2009-10 as compared to 2004-05 and then a decline in 2011-12, by 0.9 percentage points as
compared to that in 2004-05. Panagariya and More’s estimates of HCRs for the Muslims in
urban areas of Gujarat present a great puzzle. The same is true also to some extent for all
India level as well. In 2004-05, 42.5 per cent of Muslims in the urban areas were below the
poverty line when in India this figure was 41.8 per cent. In 2009-10, the two respective
figures were 42.4 per cent (for Gujarat) and 33.9 per cent (for India). This means that
incidence of poverty among the urban Muslims in 2009-10 remained unchanged in Gujarat
but drastically declined in urban India. In 2011-12, there is further drastic decline of HCR
among the Muslims in urban India. In urban Gujarat, this proportion declines to 14.6 per cent,
which seems to be unbelievable.
Lower HCRs for all population as well as for all social and religious groups in urban Gujarat
as compared to urban India are at variance with the low consumption levels in the former.
The average Monthly Per-capita Consumption Expenditure (MPCE), as per the data of the
National Sample Survey (NSS) in Gujarat urban has tended to be lower than that of urban
India in the last decade (Table 5), with the exception of the year 2004-05. The only
explanation for low average MPCE in Gujarat is that a segment of the urban population is not
consuming adequately.
Table 5: Monthly Per-capita Consumption Expenditure (MPCE) (Rs), Gujarat and
India, Urban
Year Gujarat India
2004-05* 1,115 1,052
2009-10* 1,909 1,984
2011-12*** 2,581 2,630
All figures are at current prices.
* NSSO (2006: 15).
** NSSO (2011: 18).
*** NSSO (2014: 18).
Table 6: Percentage of Workers in Urban Informal Sector
2004-05* 2009-10**
Male Female Male Female
Gujarat 74.1 66.4 80.6 68.6
India 73.9 65.4 68.5 61.6
Source:
* NSSO (2007).
** NSSO (2012).
Gujarat is the only high income state in India, besides Haryana, which has registered higher
than all India rate of urbanization in the last decade, Gujarat registering 3.1 per cent per
annum (p.a.) and Haryana 3.7 per cent p.a. rate during 2001-11 decade. Upto 1991, Gujarat
witnessed a slower rate of urbanization as compared to that of India, its rate being 3.5 per
cent p.a. and 2.9 per cent p.a. in 1970s and 1980s, as compared to 3.8 per cent p.a. and 3.1 per
cent p.a. of the latter in the same periods (Mahadevia 2014). However, since economic
8reforms of 1991, while the urbanization rate of India slowed down to 2.7 per cent p.a. in
1991-2001 period and 2.8 per cent p.a. in 2001-11 period, that of Gujarat has picked up to 2.9
per cent p.a. and 3.1 per cent p.a. during the 1990s and 2000s respectively. In other words,
economic reforms had positive impact on Gujarat in terms of urbanisation (Mahadevia 2014).
Inspite of high economic growth and high level and rate of urbanization, the state has very
high proportion of informal workers. In 2004–05, the proportion of male and female workers
engaged in the informal sector were 74.1 per cent and 66.4 per cent respectively in urban
Gujarat, which were figures slightly higher than the respective proportions at India level
(Table 6). The state has witnessed increase in proportion of informally employed in 2009-10
as compared to 2004-05, while all India has registered decline (Table 6).
The Gujarat government has been conducting Vibrant Gujarat summits since 2003 bringing
together business leaders, investors, corporations and policymakers to create a platform to
explore business opportunities and attract investments. These summits claim to have
immensely contributed to transforming Gujarat into a global business hub, but many argue
that there is considerable hype about such large investments as the real investments have been
found to be a fraction of the amounts promised (Shariff 2011). With its focus on economic
growth, the state has pushed for the development of Ahmedabad as a world-class city. This is
reflected in the urban development paradigm and the capital-intensive development projects
that seek to change the image of the city. Thus, the specific characteristics of Gujarat’s
economy are in various ways reflected within Ahmedabad city like the urban economy’s
reliance on the tertiary sector, informalization of labour and pursuit of pro-elite development
policies with non-participatory governance that have been excluding the urban poor.
2.2. Economic Changes, Labour Informalization, Poverty and Inequality in Ahmedabad
Ahmedabad has historically been a rich city, based on which the modern industrial economy
has been built. The city established itself as the home of cotton textile mills in the later part of
the 19th century. By early 20th century, Ahmedabad was known as Manchester of India. The
traditional merchant families left behind older business avenues to divert their resources to
modern textile mills. Unlike Mumbai, where the mills were mainly owned by the British and
Parsis, in Ahmedabad, Hindus dominated the ownership of mills with other communities
playing a very minor role. Also, the capital for the mills was indigenous and not of either the
British or the Parsis, as was the case in Mumbai as well as Nagpur where the first cotton
textile mills came up.
These were composite cotton textile mills, which had an organized labour force under the
workers’ union, the Textile Labour Association (TLA), set up by Gandhi and Ansuya
Sarabhai. These mills were large and each employed workers in thousands. By the 1970s,
Ahmedabad had over 60 textile mills, employing a total of 160,000 workers. The growing
industry had attracted working-class migrants from other regions of India. According to
Varshney (2002), the mills and the labour union offered an associational network that
reduced communal tensions and hence violence in the city.
9The first phase of informalization took place in 1971-81 period. In 1981, of an urban working
population of 750,000, around 500,000 were engaged in the informal sector (Breman 2004).
During the late 1980s the composite textile mills collapsed due to their obsolete technology,
high cost of production, partly explained by high wages, and stiff competition from the
unorganized power-loom sector that kept the costs low due to low wages paid to the workers.
At the same time, due to development of petrochemical industries in Gujarat, whose waste
was converted to synthetic yarn, synthetic cloth as well as cotton-blended synthetic cloth
begun to replace cotton cloth in the day-to-day wear of the middle and lower classes. The
demand for the cotton textiles therefore declined. The synthetic textile industry shifted to
Surat, largely in the power-loom sector, which was home-based. The composite mills in
Ahmedabad gave way to small-scale units with specialised activity, such as weaving and
dyeing. All these small-scale units were in the informal sector. Some of the workers of the
closed textile mills found employment in the small-scale units, but this led to decline in their
incomes. The TLA was unable to assist the workers in this transition and the workers found
their own way to cope with the situation of unemployment and decline in real wages.
The decline in the composite cotton textile mills, that had begun from 1985 onwards (prior to
which there were 85 textile mills in the city), led to a fall in the number of mills to 23 by
1994 (Bhatt 2003). The Central government’s New Economic Policy of 1991 hastened the
mill closures. By 1997, nearly 67,000 textile workers had lost their jobs (Bhatt 2003). During
the late 1990s, even the power-loom sector in Ahmedabad declined and a significant
proportion of the retrenched textile mill workers resorted to casual wage labour and self-
employment activities in the informal sector like street vending, driving auto rickshaws,
repair work and home-based work. There was a consistent increase in self-employment
among men, from 34.7 per cent in 1987-88 to 53.6 per cent in 2009-10 (Table 7). The
proportion of self-employed women fluctuated during this period; it increased to 43.6 per
cent in 1993-94 just after the closure of the mills in order to fill the income shortage in the
households. It again increased further to 49.2 per cent in 2009-10. The increase in self-
employment during this period is attributed to the shifting of manufacturing activities to self-
employed workers, implying outsourcing of manufacturing work and most of it at household
levels as home-based work (Mahadevia 2012; Mahadevia and Sarkar 2012).
Male Work Participation Rates (WPR) have increased since late 1980s while the
unemployment rates have declined. The closure of textile mills led to decline in WPRs and
increase in unemployment rates for a short while, after which, there has been consistent
increase in male WPR, accompanied by increase in self-employment and decline in regular
employment among them (Table 7). Closure of textile mills also led to decline in female
WPR in the city. Since 1993-94, the female WPR has more or less remains unchanged.
Female workers too have experienced increase in self-employment and nearly half of them
were self-employed in 2009-10. Nearly one in five employed women worked as casual
labour. Proportion of regular employed women workers has remained nearly the same over
the period except some decrease in 1993-94, with the closure of textile mills.
10Table 7: Employment Statistics, Ahmedabad City
Year Work Unemployment % workers % workers % workers
Participation rate (UPSS) self- regularly casually
Rates (UPSS) employed employed employed
Males
1987-88 49.0 7.32 34.7 44.9 20.4
1993-94 51.5 4.52 35.2 51.2 13.5
2004-05 56.9 2.62 36.4 53.1 10.5
2009-10 54.4 1.30 53.6 37.8 8.6
Females
1987-88 30.0 6.49 38.2 29.5 32.3
1993-94 13.3 13.79 43.6 27.3 29.1
2004-05 16.7 2.78 38.9 30.1 31.1
2009-10 13.7 1.24 49.2 30.9 19.8
UPSS = Usual (Principal + Subsidiary) Status8
Source: Mahadevia (2012: 19 & 20)
Shift to tertiary sector economy after the collapse of the textile industry in Ahmedabad can
also be seen from the fact that of the total economic enterprises in Ahmedabad district in
2005 (as per the economic census), 80 per cent were in the tertiary sector and 46 per cent
were in retail trade (Mahadevia 2012: 16). Of the total employment in all enterprises, nearly
71 per cent was in the tertiary sector (Mahadevia 2012: 16). Most of the tertiary sector
enterprises were of small size, indicating the presence of a large informal sector, with the
exceptions of public administration, defence and social services (Mahadevia 2012: 16). Of
the total male workers, only 28.5 per cent were in the secondary sector in 2009-10, one per
cent were in the primary sector and the remaining 70.5 per cent were in the tertiary sector.
Among the female workers, 5.8 per cent were in the primary sector, 32 per cent in the
secondary sector and remaining 62.2 per cent in the tertiary sector (Mahadevia 2012: 20).
Mahadevia and Shah (2012) estimate that there were a total of 21.05 million workers in
Ahmedabad in 2009-10. Of this about 16.34 million (78 per cent) were in the informal sector
or unorganized sector (Mahadevia and Shah 2012). Thus, although the work availability has
improved in Ahmedabad, it is largely in the nature of informal work. Any displacement of the
informally employed workers from their original place of residence or any conflict and / or
violence episodes would disrupt their work availability, causing hardships and pushing the
household below the poverty line.
Ahmedabad has also seen the emergence of petrochemical and pharmaceutical enterprises,
automobile industries, agro and food processing, and chemical and dying factories.
Surrounding regions of Ahmedabad are emerging as automobile hub, and the entire region of
Ahmedabad is sometimes referred to as “Detroit of India.” These industries are located
around the city, interspersed with villages, and have led to significant social and spatial
transformations in these peri-urban areas. The upcoming of industries has led to increase in
land prices and has attracted large speculative investments, resulting in conflicts around land.
There is also high demand for labour in these industries and control over access to jobs has
become a source of conflict, often between different caste communities. With these industries
attracting migrants from states like Uttar Pradesh, Bihar and West Bengal, there has been
increasing tension between locals and migrants.
113. Spatial Segmentation
Ahmedabad has three distinct urban morphologies, the old walled city, located on the eastern
bank of the Sabarmati River; the eastern industrial section that is to the east of the walled city
and western Ahmedabad, which is to the west of the river. The walled city was organized in
pols or residential streets, with each pol being homogeneous in terms of religion, caste and
community. Although separated thus, the different groups and communities in different pols
lived in proximity without threats, restraints or fear (Jaffrelot and Thomas 2011). The area
west of the river, then the greenfield sites, developed as the economically upwardly mobile,
professional and business families, that were modernizing, began to move out of the walled
city in 1930s and 1940s, in search of new housing. The new housing that came up west of the
river was bungalow type housing. In this period, western Ahmedabad attracted the university
and colleges and the city’s first public hospital. From the 1960s it also attracted elite
educational institutions and new forms of commercial development. All the public
institutions of education and health, including the university, were set up with philanthropic
funds. Post-2000, the western periphery has attracted many gated-communities and township
developments (Mahadevia 2013). Ahmedabad district, on the north-west and south-west, has
attracted automobile industries and hence there is a low-density urban sprawl on the city’s
western periphery.
The city’s morphology is strongly linked to her economic role and dynamics over its modern
history. The first few mills were established within the walled city and the future expansion
took place towards the villages located to the east of and beyond the walled city. Residents of
these villages formed the mill workforce along with migrants from rural Gujarat.
Subsequently, migrants from other states like Bihar, Uttar Pradesh and Andhra Pradesh also
joined the workforce. Though workers were a socially heterogeneous group, the tasks were
assigned on a caste basis. Workers in the spinning department were Dalits, in the weaving
department they were Muslims and in the framing department they were mainly Devipujaks.
The mill workers first lived in areas like Raikhad and Jamalpur within the walled city and
later around the mills in Saraspur, Rakhial, Asarwa and Gomtipur in working-class localities
known as chawls (chali in Gujarati) (Map 1). The chawls comprised of rows of rooms with or
without sanitary facilities (Mahadevia 2002) and were incentive to attract labour to work in
the mills. All subsequent low-income housing in eastern Ahmedabad, with a row of dwelling
units, are called chawls. Many of these chawls have now deteriorated and are stuck in
ownership litigation. Ancillary industries came up along with the textile mills, making eastern
Ahmedabad the predominant industrial area. It therefore had concentration of the working
class and even Dalits, a section of the latter being part of the industrial working class. The
distinction between the east and the west, with the Sabarmati River acting as the dividing
line, has remained all through the last century of the city’s history. As we discuss later, in the
last one decade, the forces of globalization have begun to penetrate the eastern segment of the
city.
12Map 1: Localities in Ahmedabad
Source: Prepared at CUE.
In 1870, Ahmedabad attained the status of municipality. As the city witnessed unprecedented
population growth in 1921 and 1931, the municipality formulated four Town Planning
schemes (TPS)9 in accordance with the Bombay Town Planning Act 1915. One of them, the
Ellis bridge development scheme, located on the western side of the Sabarmati, opened up a
new phase of urban expansion in the form of cooperative housing societies. The first housing
13society was established in 1927 near Kochrab village. This became a popular model for the
growing middle class of the city who wanted to flee from the congested walled city. The
cooperative housing societies retained the caste-based residential patterns of the walled city.
Therefore, there were housing societies belonging to Brahmins, Jains, Patidars, Christians
and other communities. This was the beginning of another form of city segmentation, which
was based on a combination of class and caste.
After independence, the AMC was formed in 1950. In 1958, the city expanded by 21 sq.km.
with the creation of the industrial area of Bapunagar on the eastern side of the existing
industrial area and the residential growth west of the river, which was boosted by the
establishment of Gujarat University. From 1971 to 1981, the AMC limits remained
unchanged but the population grew by 30 per cent. The new slums concentrated around the
textile mills in the east absorbed most of the demographic increase. In 1976, nearly 22 per
cent of the city population consisted of slum dwellers. The beginning of an industrial crisis in
the late-1980s began to lead to closure of mills resulting to impoverishment of the inhabitants
of the chawls, which gradually became more like slums.
The decade of the 1970s and part of the 1980s witnessed rapid growth of small-scale
industries in Gujarat through State government investments in industrial estates developed by
the Gujarat Industrial Development Corporation (GIDC). Ahmedabad’s industrial base also
expanded. Three GIDC estates, in Naroda, Odhav and Vatva, were located beyond the textile
industrial areas, where unorganized industries developed, employing large number of
unorganized workers. These areas witnessed rapid development of slums. The eastern
periphery of the city thus developed with emergence of industrial suburbs with small-scale
industries and housing for workers’ and low-income groups. During the decades of the 1980s
and 1990s, the then eastern periphery even witnessed higher population growth rate than the
then western periphery (Mahadevia 2002).
The western periphery has also experienced sprawl since 1990s, when the Indian economy
was liberalized and Ahmedabad, already a premier industrial and commercial centre with
enterprising population, benefitted. This sprawl was through high-rise development. Sarkhej-
Gandhinagar (SG) highway bound the western segment on account of the city’s Development
Plan (DP)10 that did not permit non-agriculture development beyond this road. By the end of
1990s, the city’s planning authority, Ahmedabad Urban Development Authority (AUDA),
had permitted development beyond the SG highway, but had restricted the density through
the Floor Space Index (FSI)11 restrictions. This resulted in development of high-end
residential complexes, which for the last decade have become low-density gated communities
(Mahadevia 2013). The western segment of the city is relatively low-density development
and high land and property prices whereas the eastern segment of the city is relatively high-
density and low land and property prices.
The decade of the 1980s saw the beginning of another spatial transformation, creating a city
of ghettoes. Till the mid-1980s, Dalits and Muslims were allies in their resistance to upper
caste politics; they also shared workplaces (the textile mills) and neighbourhoods and
14supported each other in times of crisis on account of the historical legacy. However,
influenced by the Hindutva propaganda and imagining that they would be accepted into the
Hindu fold, many Dalits played an important role in perpetrating communal violence against
Muslims from late 1980s onwards. This is a period that coincides with the closure of
organized textile mills in the city. This dynamics of Hindutva politics along with a changing
political economy that was creating increased socio-economic vulnerability and decreased
secure opportunities, pit marginalised groups against each other in the search for survival and
security: Breman (2002) refers to this as “social Darwinism.” As the distance between the
two communities widened, mixed Dalit-Muslim localities began to become mono-religious.
To prevent this, the Congress-led AMC passed a regulation, “The Prohibition of Transfer of
Immovable Property and Provision of Protection of Tenants from Eviction from the Premises
in Disturbed Areas Act, 1986,” to prevent members of one community from selling off
properties to members of the other community or evicting tenants belonging to the other
community. However, despite the Act, the transfer of property between Hindus and Muslims
continued to occur, particularly since there were further riots in the 1990s (Breman 2004;
Jaffrelot and Thomas 2011).12 Since the 2002 communal violence, during which organized
Hindu groups targeted the Muslims, the city has become fully segregated by religion. This
has led to further formation of religious enclaves and Muslim ghettos. “The Hindu Right
wing groups would want to call their city Karnavati (not Ahmedabad) and by that throwing
out the Muslims to their own city, which Hindus call ‘Mini Pakistan’” (Mahadevia 2007).
Today, the communal divides in urban space are clearly drawn out. The distance between
Dalits and upper caste Hindus also remains unbridged. Dalits live in ghettos of their own, in
areas like Naroda, Chandkheda and Ranip. Many Muslims have shifted out of the walled city
and other Hindu-dominated areas, and due to their concerns about safety during communal
violence and the housing discrimination against them in Hindu-dominated areas, they are
now concentrated in Muslim ghettos. Mahadevia (2007) estimated that about 50 per cent of
the Muslim population of Ahmedabad lived in two large ghettos, Juhapura and Dani Limda.
Juhapura, the largest ghetto, continues to experience in-migration of Muslims. Dani Limbda
includes older Muslim areas such as Shah-E-Alam as well as more recent pockets like
Bombay Hotel that have emerged over the past decade and are not served with municipal
services and amenities.
In recent years, as mentioned earlier, the western periphery of Ahmedabad has seen the
development of gated communities of the rich interspersed with villages. These colonies are
developed by developers through purchase of agricultural lands from farmers at low prices
and holding the lands until the TPS is planned and implemented. Once the TPS is
implemented, the land prices shoot up and the developer reaps benefits by developing the
land. These gated communities face inwards, seeking to isolate themselves from their
surroundings (Mahadevia 2013). But, construction of these colonies and the infrastructure to
serve them has resulted in development of construction workers’ camps, which move from
one site to another. We do not see development of any new squatter settlement in the segment
that has these high-end residential gated colonies. The public lands that were getting squatted
15upon are no more available for the purpose and the public authorities owning such lands have
begun to fence them.
Of all these segments of Ahmedabad, the western city has the highest level of basic services,
public spaces, schools and universities, and other institutions and amenities. The eastern city
and its periphery, which has much lower levels of services and amenities and hence low land
prices, has almost all of the newly constructed government housing under the Basic Services
for the Urban Poor (BSUP) component of the Jawaharlal Nehru National Urban Renewal
Mission (JNNURM). Many slum dwellers have been resettled in this government housing
after being evicted from more central urban areas. In the last half a decade, new middle class
housing along with commercial buildings is also under construction in the eastern periphery,
indicating penetration of forces of globalization here.
To sum up, the city is broadly divided into at least three cities: the original core or the walled
city where different communities live but where Hindus and Muslims have become more
distanced than earlier, the industrial area on the eastern side of the walled city where Dalits
and Muslims lived in close proximity in the same chawls but have now become segregated
and distanced, and the western side of the city where the rich and the middle class migrated to
establish their housing societies. Furthermore, the main Muslim ghettos have emerged
towards the periphery in both the south-west and south-east. In recent years, the western
periphery has developed into gated communities, interspersed with former villages,
construction and migrant labour pockets and a few EWS schemes, while the eastern periphery
has developed into industrial areas, poor to lower-middle class residential localities and EWS
schemes. The city is therefore segmented in terms of class, caste and religion, as well as
quality of housing, its typologies, and levels of services and amenities. As Mahadevia (2007)
has described it, Ahmedabad is “a city of many borders.”
4. Housing, Poverty and Inequality
Amidst the high prosperity of Ahmedabad city, there exists a large section of urban poor
whose numbers have been increasing. The 1971 slum census estimated 17.1 per cent of the
city population as living in slums,13 which increased to 21.4 per cent by 1982, and to 41 per
cent (comprising slums and chawls) in 1991 (Ahmedabad Study Action Group 1992; Bhatt
2003). In the next decade the slum population almost doubled, comprising of around 25.7 per
cent of the total population inhabiting 1,123 slums in the city (AMC 2005). In 2009, 834
slums were identified in the city, housing 262,551 households or a total population of
approximately 1.31 million, which was about 23 per cent of the city’s total population. The
official estimates by the AMC of the proportion of slum population are: 16.0 per cent (0.46
million) in 1991, 25.8 per cent (0.91 million) in 2001 (AMC 2005) and 13.0 per cent (0.73
million) in 2010.14 The number of slum dwellers declined in 2010 due to de-notification of
slums after their upgrading.15 A number of studies have reported that a high percentage of
slum dwellers are Scheduled Castes (SCs), Other Backward Castes (OBCs) and Muslims.
D’Costa and Das’s (2002) primary survey indicated that 22-26 per cent of slum dwellers were
Muslim, 21-33 per cent were SC and about 46 per cent were OBC. The latest estimate of
16chawls in the AMC area is 958 (consisting of textile mills’ chawls and new low-income
housing), which house around 149,002 households (AUDA 2013).
As mentioned earlier, most of the formal housing such as pols, cooperative housing societies
and gated enclaves cater to middle and higher income groups, whereas the only housing
options for the urban poor and recent migrants is in informal housing, commonly referred to
as slums. There are mainly two types of informal housing. One type are the squatter
settlements that have developed on illegally appropriated lands, often public lands, low-lying
lands, river-beds or lands acquired for public purpose. The second are quasi-legal settlements,
which are developed on private lands without required planning and building permissions.16
In Ahmedabad, most of the informal housing is quasi-legal. Therefore, a high percentage of
slums are located on private lands (Mehta and Mehta 1987). In 1981, 70 per cent of the slums
were on private lands and 30 per cent were on public lands. In 1998, the proportion of slums
on private lands increased to 80 per cent (Bhatt 2003). In 2001, nearly 50 per cent of slums
were on private lands and 20 per cent were on State and Municipal government lands (AMC
2005).
Mahadevia (2010b; 2011b) argues that the slums on private lands have higher tenure security
than those on the public lands in Ahmedabad, quite contrary to the understanding that public
lands can be easily encroached upon and that access to private lands is limited. In the
economic reforms period, since land prices have increased, all levels of government have
been protective of their own lands as they are using these as resources for mobilising finance.
It is also true that urban governments do not have adequate financial resources to invest in
infrastructure. The process of globalization has put pressure on cities to improve their
infrastructure. Hence, cities have begun to sell off their lands to raise funds for investment.
Ahmedabad too has been doing so, which has made public lands unavailable for squatting by
the poor. Only those public lands that are of low value are available for the poor, and these
tend to be on the city’s periphery.
Besides slums, large numbers of the poor and low-income groups live in chawls. This is the
rental housing that was built by the textile mill owners to house the mill workers. Due to the
Rent Control Act, the rents levied on the dwellers were frozen. As a result, the owners were
either not interested in collecting the nominal rents or sold the units. With such low rents,
they were also not able to maintain the chawls, leading to their deterioration and dilapidation.
Many of these chawls are also stuck in ownership litigation. The geographic distribution of
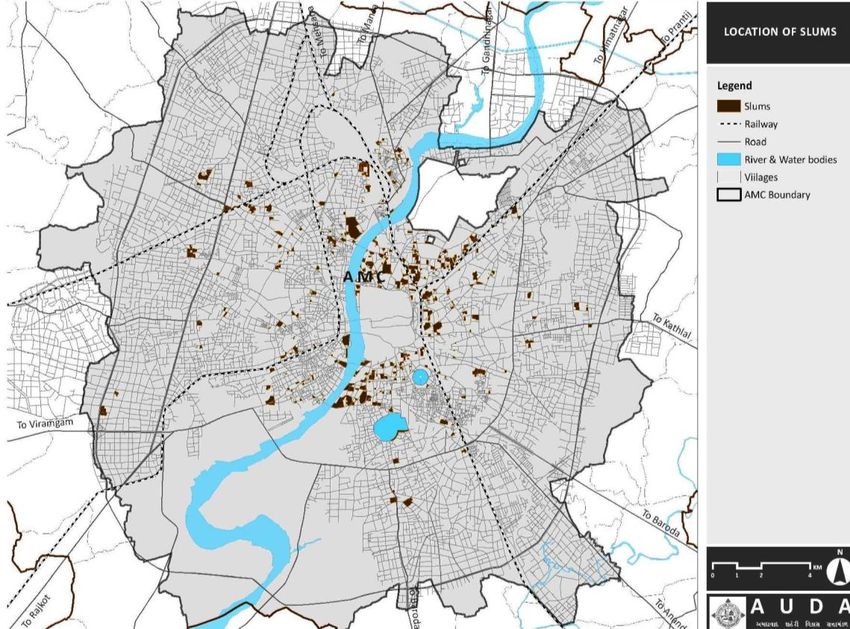
the slums and chawls, as per 2009 estimates, is shown in Map 2 and 3. Most of the slums
were located in the Central and South zones of the city while the New West zone
accommodates the highest number of slum households (see Table 8). Most chawls are
concentrated in the North and East zones in close proximity to the mills.
17Map 2: Spatial distribution of slums
Source: AUDA 2013
Map 3: Spatial distribution of chawls
Source: AUDA 2013
18Table 8: Spatial distribution of slums
Zone No. of slums No. of households
Central 185 50,155
North 143 27,269
South 209 39,212
East 55 23,160
West 159 43,312
New West 83 79,443
Total 834 262,551
Source: AMC 2009, as stated in AUDA 2013
The AMC has extended water, sanitation, street lights and roads within the slums from time
to time, however, this has stopped since the past half-decade due to change in its approach to
slum development at the behest of the State government. The municipal councillors and
MLAs also provide these basic services in ad-hoc ways to slum areas through their funds.
Water provision in slums is through public stand posts, individual taps, water tankers etc.
According to the City Sanitation Plan (CSP) prepared in 2012, around 52,000 households of
1.82 lakh households (28.5 per cent) did not have individual toilets. At this time, the city had
1,840 community toilet blocks with 7,211 seats.17 Out of these, 84 blocks were non-
functional (UMC 2012). The locations of these toilets are unknown and thus it is unclear how
many of these serve the slum population lacking individual toilets. Moreover, the CSP
mentions that many of the blocks remained locked between 11 pm and 6 am in some
localities. The CSP also found 491 open defecation spots in the city. Of these, 281 were
identified as major open defecation spots with more than 50 persons defecating in the open in
a day. Lack of sanitation facilities has implications for health as well as for women’s safety.
A section of the urban poor also live on pavements and vacant plots in makeshift shelters,
mostly made of plastic sheets although some even live directly under the sky. A 2011 news
article stated that there are 10,000 homeless people in the city (TOI 2011a). These settlements
of the homeless are not considered as slums by AMC. As a result, there is no water or
sanitation provision for them. Along with lack of basic services, there is also no provision of
health and education amenities for these homeless settlements. Many of the homeless are
migrants from tribal areas of Gujarat or other states like Bihar and Rajasthan. In 2011, Prayas
Centre for Labor Research and Action identified 42 pockets where migrants were living in
such settlements and submitted a memorandum to a number of government officials and
departments to ask them to provide basic services and social security to these migrants, but
the effort to provide services lasted only for a short time. The AMC has built 46 night shelters
for the city’s homeless but illegal activities like gambling and liquor consumption take place
in some of them, many have no space for women and in general the night shelters are not
conducive for migrant families.
5. The Urban Development Paradigm
In 2005, Ahmedabad was declared as a megacity under the Central government’s Jawaharlal
Nehru National Urban Renewal Mission (JNNURM). This inspired the city government to
19You can also read