POORLY UNDERSTOOD THE STATE OF POVERTY IN NEW ZEALAND - BRYCE WILKINSON JENESA JERAM - The New Zealand Initiative
←
→
Page content transcription
If your browser does not render page correctly, please read the page content below
POORLY UNDERSTOOD
THE STATE OF POVERTY IN NEW ZEALAND
          BRYCE WILKINSON
           JENESA JERAM
© The New Zealand Initiative 2016
Published by:
The New Zealand Initiative
PO Box 10147
Wellington 6143
New Zealand
www.nzinitiative.org.nz
Views expressed are those of the authors and do not necessarily reflect the views
of The New Zealand Initiative, its staff, advisors, members, directors or officers.
ISBN: 978-0-9941298-2-6 • print
      978-0-9941298-3-3 • online/pdf
RR24
Typeset by The Little Design Company
Cover design by Mollica Sokhom
Printed by Wickliffe Solutions
POORLY UNDERSTOOD
THE STATE OF POVERTY IN NEW ZEALAND
BRYCE WILKINSON
JENESA JERAM

  FEBRUARY 2016
The New Zealand Initiative is an independent public policy think tank supported by chief executives of major
New Zealand businesses. We believe in evidence-based policy and are committed to developing policies that
work for all New Zealanders.

Our mission is to help build a better, stronger New Zealand. We are taking the initiative to promote a
prosperous, free and fair society with a competitive, open and dynamic economy. We develop and contribute
bold ideas that will have a profound, positive, long-term impact.
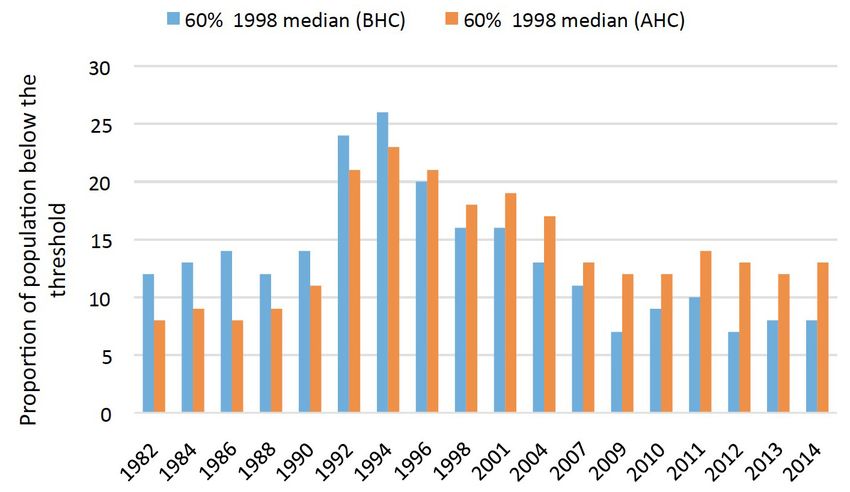
TABLE OF CONTENTS

ABOUT THE AUTHORS                                                            V

FOREWORD			                                                                 VII

EXECUTIVE SUMMARY                                                           IX

CHAPTER ONE: INTRODUCTION                                                     1

CHAPTER TWO: POVERTY: CONCEPTS, DEFINITIONS AND MEASURES                     3

CHAPTER THREE: FACTORS CONTRIBUTING TO HARDSHIP                             21

CHAPTER FOUR: EVOLUTION OF INSTITUTIONAL ARRANGEMENTS                       41
FOR ALLEVIATING POVERTY IN NEW ZEALAND

CHAPTER FIVE: CONCLUDING OBSERVATIONS                                       49

BIBLIOGRAPHY		                                                              51

TABLES

TABLE 1: RELATIVE INCOME POVERTY MEASURES IN NEW ZEALAND                     8

TABLE 2: RELATIVE INCOME POVERTY FOR CHILDREN UNDER 18 YEARS, 2014          10

TABLE 3: RELATIVE INCOME POVERTY RATES, 2011–12                              11

TABLE 4: COMPOSITION OF EU-13                                               12

TABLE 5: HARDSHIP MEASURES EU-13, 2008 DATA FOR NZ, 2009 FOR EU COUNTRIES   12

TABLE 6: DEPRIVATION INDICATORS (DEP-17), 2008                              13

TABLE 7: POPULATION PROPORTIONS FOR DEP-17 SCORES                           14

TABLE 8: HARDSHIP RATES WITHIN NEW ZEALAND USING EU-13 AND DEP-17, 2008     14

TABLE 9: MATERIAL HARDSHIP MEASURES, 2007–14                                16

TABLE 10: MATERIAL HARDSHIP RATES FOR CHILDREN, 2007–14                     16
FIGURES

FIGURE 1: EFFECTS OF RISING HOUSING COSTS AND UNEMPLOYMENT                 9

FIGURE 2: CHILD HARDSHIP BY ETHNIC GROUP AND SOURCE OF DISPOSABLE INCOME   15

FIGURE 3: AVERAGE HOUSEHOLD MARKET INCOME BY DECILE (2010 DOLLARS)         22

FIGURE 4: AVERAGE WEEKLY WAGES BY QUALIFICATION LEVEL, 2014                24

FIGURE 5: WORKING AGE BENEFICIARIES 1940–2012                              25

FIGURE 6: HARDSHIP RATES (9+ IN DEP-17), 2007–14                           26

FIGURE 7: CHILD POVERTY RATE BY HIGHEST HOUSEHOLD EDUCATIONAL              28
QUALIFICATION, 2012–14

FIGURE 8: AVERAGE NEET RATE BY ETHNIC GROUP, 2009–14                       29

FIGURE 9: EFFECTIVE TAX RATE IN 2011 FOR A SOLE PARENT MOVING TO           31
FULL-TIME EMPLOYMENT

FIGURE 10: MARKET INCOME VS DISPOSABLE INCOME, 2010                        32
ABOUT THE AUTHORS

DR BRYCE WILKINSON
Bryce is a Senior Research Fellow with The New Zealand Initiative
and Director of Capital Economics Limited. He is the author of Global
Links: Foreign Ownership and The Status of New Zealand’s International
Investment, and co-author of Capital Doldrums: How Foreign Direct
Investment is Bypassing New Zealand and Open for Business: Removing the
Barriers to Foreign Investment.

Bryce was a member of the government’s Regulatory Responsibility
Taskforce, the 2025 Taskforce, and the ACC Stocktake Group. He holds a
PhD in Economics from the University of Canterbury and was a Harkness
Fellow at Harvard University.

JENESA JERAM
Jenesa is a Research Assistant at The New Zealand Initiative. She is the co-
author of Investing for Success: Social Impact Bonds and the Future of Public
Services, The Case for Economic Growth, and Empty Nests, Crowded Houses:
Building for an Ageing Population. She has a Bachelor of Arts with first class
Honours from the University of Otago, majoring in politics, philosophy and
economics.

ACKNOWLEDGEMENTS

The authors acknowledge and thank all those who have willingly and
generously given their time to assist with this project, including in many
cases providing comments on an earlier draft. In particular we wish to
thank Christopher Ball, Jonathan Boston, Simon Chapple, Eric Crampton,
John Creedy, John Dickson, Oliver Hartwich, Kieran Madden, Lindsay
Mitchell, Bryan Perry, and Grant Scobie while recording that the sole
responsibility for the views expressed and errors and omissions lies with
the authors.

          POORLY UNDERSTOOD: THE STATE OF POVERTY IN NEW ZEALAND                 v
FOREWORD
It was a pleasure to review this report as few other why; and what interventions have been tried to
areas of public policy involve such a contest of address the negative impacts of poverty to date?
emotion, strong prior views and partial insights as
the state and consequences of poverty in Aotearoa It is also to the credit of the authors, that this
New Zealand. tūranga paparahi is being presented for public
review and comment before any possible solutions
In my experience, all good public policy processes are fully explored.
start with clear, precise problem definition,
including the nature and magnitude of the issues The challenge for policy makers and researchers is
one is attempting to address. The strength of this to build on the insights, to suggest solutions based
report is the questions asked of existing data and on talking to people on very low incomes and
material: what is poverty in a New Zealand context; explore the diversity of incentives, capacity and
which individuals and groups are in poverty and information that challenge centralised solutions.
John Dickson
SENIOR CONSULTANT, SUPERDIVERSITY CENTRE FOR
LAW, POLICY AND BUSINESS SERVICE DELIVERY;
TRAINING MANAGER, LITERACY AOTEAROA;
FORMER GENERAL MANAGER, SOCIAL SERVICE
PROVIDERS, AOTEAROA.
11 DECEMBER 2015
POORLY UNDERSTOOD: THE STATE OF POVERTY IN NEW ZEALAND viiEXECUTIVE SUMMARY
This report is about the state of what is often called Clearly better access to jobs that pay higher rather
poverty in New Zealand. than lower wage rates would help. As The New
Zealand Initiative has repeatedly pointed out,
Headlines that proclaim that a quarter of a million
skill-attainment through education, and economic
children or more live in poverty in New Zealand
growth through productivity growth are keys to
give an exaggerated and misleading impression.
lifting wage rates. In 1936 the Arbitration Court
For a start, they cherry pick the top end of estimates
determined a basic weekly wage of £3 16s was
by the Ministry of Social Development (MSD).
sufficient for an adult male to maintain himself, his
For 2014, MSD’s estimates ranged from 150,000 wife, and three children in a fair and reasonable
(14% of all children) to 305,000 (29% of all standard of comfort. This converts to $9.9 per
children). These figures show the number of hour in mid-2012 dollars which represents 73% of
children in households whose disposable incomes the mid-2012 minimum wage of $13.5 and 54% of
fell below a range of thresholds. MSD measures the proposed $18.4 per hour ‘living wage’. This
disposable incomes both before housing costs calculation illustrates how productivity growth
(BHC) and after housing costs (AHC). Thresholds can raise real wage rates and, apparently, living
are commonly set at 50% or 60% of median standard expectations.
household income, adjusted for household size
It also raises a question as to the deeper causes of
and composition. They are set either at the value
child hunger today. The complexity of the issue
of household median income in the current year,
is illustrated by a Ministry of Health finding that
or its value in current year dollars of some earlier
those living in the most deprived areas in New
base year median income. There is no international
Zealand are four times more likely to be extremely
agreement as to which income measure or
obese as those living in the least deprived areas.
threshold is best.
It is somewhat incongruous to use the same word
To provide some perspective on such estimates, “poverty’ to refer to situations of hunger and
more than 20% and perhaps even 25% of children obesity.
in New Zealand live in households with no adult
Policies that have unnecessarily and undesirably
in full-time employment. At 31 March 2015, 187,000
raised housing costs are another long-standing
children (17% of all children) were in beneficiary
concern of The New Zealand Initiative. High
families. MSD reports that between 2009 and
housing costs hit low income working age
2012, of the 310,000–333,000 people of working
households hardest. Table 1 shows that the income
age receiving a main benefit, only around 17%
poverty rate on a 60% constant value threshold
(one in six) declared they had other income.
measure fell from 12% in 1982 to 8% in 2014 on
The proportions of the population below a given
a BHC measure but rose from 8% to 13% on an
threshold can rise and fall materially with the
AHC basis. Concerns about overcrowding and
unemployment rate.
inadequate housing and poverty overlap with the
Even so, full-time work at a low wage rate by one concern about unduly high housing costs in New
adult does not suffice to lift all households with Zealand.
dependents above all such income thresholds.
A further concern with headlines that focus
Around 2 out of 5 children are in income-poor
attention on upper-end income estimates of
households in which at least one adult is in full-
poverty is that they risk distracting attention from
time work or is self-employed.
the more complex issue of material hardship.
POORLY UNDERSTOOD: THE STATE OF POVERTY IN NEW ZEALAND ixHouseholds with relatively low disposable incomes The number of those aged 0–17 falling below
are not necessarily experiencing hardship, and a threshold for severe material hardship was
vice versa. Student and retiree households can be 80,000 (8%); for a less stringent threshold, it
income poor but resource rich in different ways. was 145,000 (14%).
Some other households can be temporarily out
The incidence of material hardship is particularly
of work, or temporarily in work. Overall, around
high among sole parent households and Māori and
55–65% of income-poor households are not
Pacific households. These communities should be
materially deprived on a reasonable measure.
heavily involved in any official assessments of the
More than half of the 29% of children living in
nature of the problem, causes and remedies.
relatively low income households on the 60% AHC
measure were not experiencing material hardship Benefit levels and conditions presumably reflect
on a reasonable measure. Even so, households public opinion about the causes of hardship. The
with chronically low disposable incomes that are more than four-fold increase since 1970 in the
headed by adults of working age are much more proportion of the working age population on a
likely to be experiencing material hardship than benefit other than the unemployment benefit could
other households. be influencing public perceptions. One survey of
public perceptions suggests that many might not be
Defining poverty as relatively low current income
accepting the most exaggerated claims of the extent
also suffers from the difficulty that whereas higher
of child poverty and consider poor decisions to be
income from economic growth can reduce material
a material reason why some people of working age
hardship it might not increase relative income. So
are experiencing hardship.
which issue is the more important?
The report also briefly traces from colonial
For these and other reasons, increasing attention
times the evolution of private arrangements for
internationally is being given to indicators of
preventing and alleviating poverty. These included
the incidence of material hardship. Chapter 2
insurance companies, friendly societies, and
of this report cites comparative hardship (and
benevolent organisations. While vibrant and
income) measures produced by the Organisation
effective within their domains, the scope and
for Economic Co-operation and Development
capacity of these institutions was limited from a
(OECD), the European Union (EU), and the Ministry
national perspective.
of Social Development. The relative income
thresholds used in these reports are typically 50% The state’s role grew markedly towards the end
or 60% of median household disposable income. of the nineteenth century, partly as a result of
hardship from widespread recession and the
Based on the OECD and EU’s member country
pension needs of an ageing population. The Great
relative income statistics for 2011, New Zealand
Depression of the 1930s accelerated this trend.
had a lower incidence of elderly poverty than their
overall country averages and a higher incidence The role for friendly societies was reduced but not
of child poverty, for a similar total population eliminated by the state’s activities. Today New
incidence. Measured income mobility in New Zealand has a very substantial non-profit sector
Zealand appears to be comparable to rates in other supplying social services.
similar countries.
Subsequent reports from The New Zealand
In 2014, based on MSD’s relative deprivation or Initiative will address the issues of income
hardship tables: inequality and welfare policy.
The proportion of all New Zealanders falling
below a threshold for severe material hardship
was 5%; for a less stringent threshold, it was 8%.
x THE NEW ZEALAND INITIATIVEONE
INTRODUCTION
Properly understood, “use of the term ‘poverty’ wanting more information should refer directly to
carries with it an implication and moral MSD’s excellent reports.
imperative that something should be done
Chapter 2 reviews the concepts, definitions and
about it”.1
measures of poverty. Poverty is an emotive term.
This report is about what is often called ‘poverty’ We suggest it should not be used lightly in a New
in New Zealand. While there is no poverty in New Zealand context when the same word means
Zealand by Third World standards, there are real incomparably more desperate material hardship in
concerns about inadequate living conditions, Third World countries. Nevertheless, the statistics
particularly for a significant proportion of reviewed in Chapter 2 demonstrate that grim
children. hardships exist in New Zealand to a significant
degree, regardless of semantic niceties.
How many people are experiencing relative
hardship in New Zealand? What do we know Chapter 3 identifies some of the many diverse
about who they are and how they came to be factors that can help explain why so many people
in their grim situations? How do the statistics are experiencing hardship in New Zealand.
compare internationally? What non-government
Chapter 4 traces the evolution of non-government
insurance and benevolent institutions evolved
arrangements to avert or alleviate hardship, with
in New Zealand to help prevent and alleviate
a particular focus on friendly societies till World
hardship before the advent of the welfare
War II.
state? How has the development and presence
of such institutions been affected by evolving Chapter 5 presents our conclusions.
government policies?
This report does not make any policy
This report compiles answers to these questions recommendations. It does describe various current
provided by those working in the field. We have not and past policies, but merely as a by-product of its
undertaken new research. descriptive task. Of course, some of the findings
are suggestive, but we do not identify or evaluate
The hundreds of pages of statistics on income
policy options looking forward.
inequality and hardship measures produced by
the Ministry of Social Development (MSD) have Nor does this report discuss the rich-poor divide
been a core resource for this report. The tables or income inequality. These are important topics
and charts from this database highlighted here in their own right and The New Zealand Initiative
are only a tiny portion of the vast amount of other will be producing reports on inequality and welfare
interesting and relevant information. Readers policy in the future.
1 David Piachaud, “Problems in the Definition and
Measurement of Poverty,” Journal of Social Policy 16:2
(1987), 147–164, 161, quoted in Bryan Perry, “Household
Incomes in New Zealand: Trends in Indicators of
Inequality and Hardship 1982 to 2014” (Wellington:
Ministry of Social Development, 2015), 78.
POORLY UNDERSTOOD: THE STATE OF POVERTY IN NEW ZEALAND 1TWO
POVERTY: CONCEPTS, DEFINITIONS
AND MEASURES
Disagreements over the definition of poverty But using the word ‘poverty’ to refer to those who
run deep and are closely associated with are relatively poor in a prosperous country means
disagreements over both the causes of and something different.
solutions to it. In practice all these issues of
The relatively poor people in a prosperous country
definition, measurement, cause and solution
do not necessarily lack what in 1759 Adam Smith
are bound up together and an understanding
referred to as the “necessities of nature”. Writing in
of poverty requires an appreciation of the
the context of the United Kingdom, he asserted at
interrelationships between them all.2
the time, extraordinarily from today’s perspective:
“The wages of the meanest labourer can supply
them. We can see that they afford him food and
2.1 THE EVOCATIVE ASPECT OF clothing, the comfort of a house and of a family”.4
POVERTY TERMINOLOGY Clearly, he was not writing about times of economic
collapse, war or famine.
‘Poverty’ is an evocative word.
But Smith also observed that to be relatively poor
It evokes images of Third World destitution, was to be lacking in things that were deemed
under-nourished children, disease, dung hovels, necessary, in the context of that time and place,
helplessness and despair. For example, in 1995 the to be shameful to lack in the eyes of those who did
United Nations’ Copenhagen Declaration described not lack them, and humiliating to lack for those
poverty as: that did lack them and wished it were otherwise.
Smith attributed these evoked emotions to human
… a condition characterised by severe
vanity: “We aspire to wealth, power and eminence,
deprivation of basic human needs, including
not for its material benefits, but for the status it
food, safe drinking water, sanitation facilities,
confers”.5 We want to look good in the eyes of
health, shelter, education and information. It
others and we may feel embarrassed by the relative
depends not only on income but also on access
poverty of others. Smith’s proposition is a reminder
to services.3
that virtues such as compassion are not the only
Used in this context it is a call to compassionate motivators of human action.
action.
Of course, the self-denying monk in a monastery
cell would likely not trigger the same emotions of
compassion, vanity or envy. Emotional responses
are context dependent.
2 Peter Alcock, Understanding Poverty (London: Macmillan
Alcock, 1993), 57, quoted in Bryan Perry, Ibid., 79.
3 This definition is part of the Copenhagen Declaration 4 Adam Smith, The Theory of Moral Sentiments (1759), 114.
that emerged from the UN’s World Summit for Social 5 Nineteenth-century sociologist Thorsten Veblen coined
Development. See United Nations, “World Summit the term “conspicuous consumption” to depict leisure
for Social Development Programme of Action” class vanity. See, for example, Wikipedia, “Conspicuous
(Copenhagen: UN, 1995), Chapter 2. Consumption,” Website.
POORLY UNDERSTOOD: THE STATE OF POVERTY IN NEW ZEALAND 3Even so, it is somewhat incongruous to use the 1996 prices. This threshold has since been updated
same word ‘poverty’ to refer to both a state of to $1.25 a day. In 2014, the World Bank described it
Third World hardship and the situation of being as a threshold for “extreme poverty”.8 The World
relatively poor in a prosperous country. The Bank also monitors poverty levels based on a
situations certainly differ greatly in degree and higher threshold of US$2.50 a day.
arguably in kind in some respects.
Relative poverty most commonly refers to low
Nevertheless, advocates of policy action sometimes incomes relative to the median income, or relative
seek to conflate the concepts of poverty and of income poverty. Closely related measures are
having a low relative income in a prosperous relative consumption or wealth.
country. For example, Christopher Sarlo,
economics professor at Nipissing University in It is commonly argued that the distinction between
North Bay, Canada, notes the tendency of those relative and absolute poverty is over-drawn – for
calling for greater redistribution of income to use example, even the threshold for the minimum
a threshold for low relative income that captures calorie intake varies across countries according to
a significant portion of the population and then climatic and other conditions. This is semantically
attribute the wants of absolute poverty to that true, but it does not follow that ‘poverty’ applied
entire subset.6 For a recent New Zealand example, to people with a relatively low income in a high
see section 2.3 below. income country can be equated to people in a Third
World country. In countries like New Zealand,
‘poverty’ is likely to be associated with inadequate
2.2 DEFINING AND MEASURING piped water, flush toilets, and electricity; housing
that is a lot more substantial than a mud hut; mod
POVERTY — CONCEPTS
cons such as a telephone, television, washing
It is common in poverty literature to distinguish machine, and refrigerator; considerable income
between absolute and relative poverty. support; and heavily subsidised public transport,
education, and health services. (Note: This is not
Absolute poverty measures poverty in relation in the least a call for complacency about the dire
to the amount of money necessary to meet situations many households in New Zealand are
basic needs such as food, clothing, and shelter. experiencing.)
Relative poverty defines poverty in relation
Since this report is about poverty in New Zealand,
to the economic status of other members of
it focuses on measures of relative poverty or
the society: people are poor if they fall below
hardship. Yet poverty is difficult to measure
prevailing standards of living in a given societal
in relatively rich countries because there is no
context.7
international agreement about the criteria to
Absolute poverty is mostly associated with extreme distinguish between the poor and the non-poor.9
Third World poverty based on minimal nutritional
MSD analyst Bryan Perry has summed up the
and other needs, constant through time, using the
measurement dilemma in New Zealand:
World Bank’s poverty threshold of US$1 a day in
8 The World Bank, “Global Monitoring Report 2014/2015:
Ending Poverty and Sharing Prosperity” (Washington,
DC: The World Bank, 2014).
9 Caterina Ruggeri Laderchi, Ruhi Saith and Frances
Stewart, “Does the Definition of Poverty Matter?
6 Christopher Sarlo, “What is Poverty? Providing Clarity Comparing Four Approaches,” in United Nations
for Canada” (Fraser Institute, 2008), 4. Development Programme, Poverty in Focus (Brasilia:
7 UNESCO, “Poverty,” Learning to Live Together, Website. International Poverty Centre, UNDP, 2006), 10.
4 THE NEW ZEALAND INITIATIVEThere is no clear delineation between the poor potential and participate as equal members of
and the non-poor that science can identify New Zealand society.13
independent of judgment … What is crucial
in discussing poverty rates and trends is to
The government’s official response in 2013 did not
identify what measure is being used, and to
address this particular recommendation or object
be aware of the different rationales for and
to the use of poverty language, but it did refer to
pictures presented by the different measures.10
establishing a Ministerial Committee on Poverty.14
In 2014, New Zealand academics Jonathan
The source of the problem is the (understandable)
Boston and Simon Chapple defined children
imprecision in accepted definitions. For example,
to be living in poverty if they were living “in
a UN Statement in 1998 described poverty in the
families with insufficient money, or more broadly,
following terms:
insufficient resources, to participate fully in life’s
Fundamentally, poverty is a denial of choices opportunities”.15
and opportunities, a violation of human dignity.
Maxim Institute researcher Kieran Madden
It means lack of basic capacity to participate
recommends defining poverty as “a situation where
effectively in society …11
a person or family lacks the material resources to
In 2005, the World Bank defined poverty as a meet their minimal needs as defined by most New
“pronounced deprivation in well-being”.12 Zealanders”.16 He also observes that a broader
conception might embrace non-materialistic
The words ‘denial’ and ‘deprivation’ are suggestive aspects, acknowledging, for example, that those in
of a malign active agent. poverty lack the choices we take for granted.
In 2012, an Expert Advisory Group on child poverty For the purposes of this report, the notion of
in New Zealand, commissioned by the Children’s severely limited choices compared to what the
Commissioner, recommended the following great bulk of the population take for granted has
definition for child poverty: some appeal. It recognises that households whose
income is temporarily low are not necessarily
Children living in poverty are those who
experiencing severely limited choices whereas
experience deprivation of the material
some whose income is temporarily high may be.
resources and income that is required for them
to develop and thrive, leaving such children Whether those below some threshold measure that
unable to enjoy their rights, achieve their full accords with that notion should be described as
13 Children’s Commissioner’s Expert Advisory Group
(EAG) on Solutions to Child Poverty, Solutions to Child
Poverty in New Zealand: Evidence for Action (Wellington:
Office of the Children’s Commissioner, 2012), 2. See also
EAG, “Working Paper No 1: Defining and Measuring
Child Poverty” (Wellington: Office of the Children’s
Commissioner, 2012).
14 New Zealand Government, “Government Response to
10 Bryan Perry, “Household Incomes in New Zealand: the Children’s Commissioner’s Expert Advisory Group
Trends in Indicators of Inequality and Hardship 1982 to on Solutions to Child Poverty” (Wellington: New Zealand
2014,” op. cit., 78. Government, 28 May 2013), 13.
11 UNESCO, “Statement of Commitment for Action to 15 Jonathan Boston and Simon Chapple, Child Poverty in
Eradicate Poverty,” Press Release ECOSOC/5759 (20 May New Zealand (Bridget Williams Books, 2014), 22.
1998). 16 Kieran Madden, “The Heart of Poverty: Defining and
12 The World Bank, “Introduction to Poverty Analysis” Measuring What it Means to be Poor in New Zealand”
(Washington, DC: The World Bank, 2005), 8. (Auckland: Maxim Institute, 2015), i.
POORLY UNDERSTOOD: THE STATE OF POVERTY IN NEW ZEALAND 5experiencing poverty is a matter of terminology – The benefit rate for New Zealand
about which little agreement can be expected. Superannuation ranged from 48% to 67% of the
median between 1982 and 2010.18
Turning from poverty definitions to measures,
two common thresholds used internationally are The proportion of those below thresholds set to
50% and 60% of median country income. Income some fraction of median income is an indicator of
might be measured on a before- or after-housing the dispersion of the income distribution below
cost (BHC and AHC) basis. The level for the median the median. If everyone below the median received
income threshold might be its value in some $1 less than the median income, no one would
benchmark year or its value in the current year. be in poverty on the 50% or 60% relative income
measures – no matter how meagre the median level
Note that such relative income measures lack
or how large incomes were above the median level.
international comparability in that those with low
Alternatively, if everyone’s disposable income were
relative incomes in a high income country may be
to double in the fullness of time, the proportion of
appreciably better off materially than those with
the population below any given threshold would be
low relative incomes in a poorer country.
unchanged.19
Although there is no official definition of poverty
The seminal importance of productivity growth
in New Zealand, MSD has reported extensively on
for raising living standards can be illustrated by
measures of hardship and inequality in a poverty
contrasting points of view today with those back
context. In particular, Perry’s statistical reports
in 1936 when New Zealand’s Arbitration Court
in 2014 and 2015 use “low-income thresholds set
determined that a basic weekly wage of £3 16s was
at 50% and 60% of median household income”,
sufficient for an adult male to maintain himself, his
adjusted for household size (number of people
wife, and three children in a fair and reasonable
per household) and composition (age and
standard of comfort.20
relationships between people), to analyse “trends
in income poverty”.17 Children living in households That 1936 basic wage converts to $396.11 per week
with equivalised incomes below a given threshold or $9.90 per hour in June quarter 2012 dollars
are deemed living in poverty. The child poverty rate using the Reserve Bank of New Zealand’s inflation
is the number of such children as a percentage of calculator. The hourly rate represents 73% of the
all children. That description makes sense if the minimum wage of $13.5 in mid-2012 and 54% of the
threshold makes sense. $18.4 per hour ‘living wage’ proposed in 2012 by
researchers Peter King and Charles Waldegrave.21
To put the 50% and 60% relative income
benchmarks into perspective, Perry notes:
Only those in the bottom income decile have 18 Bryan Perry, “Household Incomes in New Zealand:
Trends in Indicators of Inequality and Hardship 1982 to
measured incomes less than 50% of the median
2014,” op. cit., 200–201.
equalised household income.
19 Of course, this could only be achieved in real terms by
many decades of high labour productivity growth. It took
Social assistance levels “generally lie in the 50%
50 years for New Zealand’s real GDP per capita to double
to 65% range”. between the mid-1960s and 2014.
20 This determination illustrates the male ‘breadwinner’
role at the time. Mothers with dependent children were
expected to be full-time carers. No income tax was levied
on personal incomes of less than £210 pa. See Statistics
New Zealand, The New Zealand Official Yearbook 1936
17 Bryan Perry, “Household Incomes in New Zealand: (Wellington: SNZ, 1936).
Trends in Indicators of Inequality and Hardship, 1982 21 Peter King and Charles Waldegrave, “Report of an
to 2013” (Wellington: Ministry of Social Development, Investigation into Defining a Living Wage for New
2014), 111. (The 2014 report is an earlier version of the Zealand” (Wellington: Family Centre Social Policy
2015 reports.) Research Unit, December 2012).
6 THE NEW ZEALAND INITIATIVEMoreover, their living wage calculation assumed 1.5 writers to imagine and highly innovative people to
working adults, two children, and a continuance design and create.
of existing state support arrangements, including
Relative poverty is also assessed by commodity
the Accommodation Supplement and Working for
specific or activity specific indicators of hardship.
Families. The assessed disposable income for such
The European Union produces such non-income
a household was 77% of the then median after-tax
measures (NIMs) for European countries and
household income.22
Organisation for Economic Co-operation and
The weekly 1936 amount of $396.11 in 2012 dollars Development (OECD) publications extend the
can be compared with benefit rates in 2012. Using coverage to include several non-European member
Perry’s conversion factor of 2.43 for a household of countries, including New Zealand. Perry’s 2014 and
two adults and three children, $396.11 is equivalent 2015 reports include detailed and comprehensive
to a weekly income of $163 for a single person NIMs. NIMs are commonly derived from responses
household.23 In mid-2012, the weekly post-tax to survey questions relating to such factors as
benefit rate was $213.49 for a woman living alone “access to household durables, ability to keep
under the Domestic Purposes Benefit24 (DPB) and warm, have a good meal each day, keep oneself
$348.92 for a single person living alone on New adequately clothed, repair basic appliances as
Zealand Superannuation (NZS).25 These calculations required, visit the doctor, pay the utility and rent/
do not take into account other possible benefits such mortgage bills on time, pursue hobbies and other
as the accommodation supplement. interests, and so on”.27
Such calculations illustrate the time-dependent It is not necessary to use the term ‘poverty’ in
nature of assessments of poverty rates, and indeed New Zealand when ‘low income populations’
of benefit levels. Productivity growth increases would suffice but, as Perry observes, doing so
the scope of what most people consider to be is now a “common practice in New Zealand and
necessary and affordable, and new technologies internationally” – for example, in OECD and
greatly increase the scope of people’s desires. UNICEF publications and EU reporting practices.28
Statistics New Zealand’s 1945 census found that We would add that in an NIM context, the term
93% of dwellings had electric lights, 75% a hot- ‘relative hardship’ might also suffice.
water service, and 70% a flush toilet. For Māori,
the corresponding proportions were starkly lower
at 35%, 20%, and 13%. Across all dwellings, 38% 2.3 POVERTY STATISTICS FOR
used a coal, wood or coke range for cooking.26 NEW ZEALAND
Microwave ovens, television sets, computer games,
and the Internet were something for science fiction Relative income poverty
Perry has summarised five relative income poverty
statistics for the entire New Zealand population
(Table 1) and the same statistics for those under 18
22 Ibid., 4. years (Table 2). In both tables, AHC and BHC stand
23 Bryan Perry, “Household Incomes in New Zealand: for after- and before- housing costs, respectively.
Trends in Indicators of Inequality and Hardship, 1982 to
The AHC threshold is defined as the BHC threshold
2014,” op. cit., Table A.4, 10.
less 25%.29
24 In July 2013, the main DPB category, Sole Parent, was
renamed Sole Parent Support. Two other DPB categories,
Care of Sick or Infirm and Women Alone, were absorbed
into other benefits. 27 Bryan Perry, “Household Incomes in New Zealand:
25 See Ministry of Social Development, “Benefit Rates at 1 Trends in Indicators of Inequality and Hardship, 1982 to
April 2012,” Website. 2013,” op. cit., 211.
26 Statistics New Zealand, The New Zealand Official 28 Ibid., 111.
Yearbook 1950 (Wellington: SNZ, 1950), Chapter 23. 29 Ibid., 93 and 202–203.
POORLY UNDERSTOOD: THE STATE OF POVERTY IN NEW ZEALAND 7Table 1: Relative income poverty measures in New Zealand
BEFORE HOUSING COSTS (BHC) AFTER HOUSING COSTS (AHC)
Relative to
Threshold Relative to contemporary
Constant value contemporary Constant value
type median
median
Population
(m)
60% 60% 50% 60% 60% 60% 40% 50% 60%
HES year 1998 2007 contemp contemp 1998 2007 contemp contemp contemp
median median median median median median median median median
1982 12 – 7 14 8 – 4 6 9 3.03
1984 13 – 7 14 9 – 4 6 9 3.06
1986 14 – 6 13 8 – 3 5 7 3.07
1988 12 – 5 13 9 – 4 6 10 3.11
1990 14 – 5 13 11 – 4 6 11 3.15
1992 24 – 8 15 21 – 7 11 17 3.23
1994 26 – 7 15 23 – 7 13 19 3.32
1996 20 – 8 14 21 – 8 13 18 3.43
1998 16 – 7 16 18 – 9 13 18 3.54
2001 16 27 8 18 19 25 8 13 20 3.80
2004 13 25 10 21 17 22 9 14 20 3.96
2007 11 19 10 19 13 18 9 13 18 4.13
2009 7 15 9 19 12 17 9 14 19 4.21
2010 9 16 10 19 12 18 9 14 20 4.26
2011 10 17 10 19 14 19 10 15 20 4.31
2012 7 15 8 18 13 17 10 14 19 4.34
2013 8 14 9 18 12 16 10 14 18 4.37
2014 8 14 10 20 13 17 – 15 20 4.42
Source: Bryan Perry, “Household Incomes in New Zealand: Trends in Indicators of Inequality and Hardship 1982 to 2014,”
Tables F.3 and F.4 (Wellington: Ministry of Social Development, 2015), 98–99.
8 THE NEW ZEALAND INITIATIVESpace does not permit a full discussion of the Economic downturns tend to increase the
insights provided by these statistics, but the proportions below any given threshold – hence
following points are of particular interest for the the big lift in both the BHC and AHC proportions
purposes of this report: between 1988 and 1994 and the smaller lift
between 2009 and 2011. Figure 1 charts the
Real income growth between 1982 and 2014
relative movements.
helped reduce the proportion of the population
below an unchanged 1998 median income The proportion of the population below the
threshold on a BHC basis from 12% to 8% (see contemporary median thresholds in 2014 was
column 1). much the same as in 2004 on all the measures.
This indicates that incomes around the
In stark contrast, the proportion rose from 8%
threshold level have tended to grow as fast as
in 1982 to 13% in 2014 on an AHC basis (see
the median itself.31
column 5). In short, housing costs have risen
markedly relative to disposable incomes during The proportion of the population below a
this period.30 contemporary threshold rose markedly between
1982 and 2004 on all the measures, but more so
on an AHC basis.
Figure 1: Effects of rising housing costs and unemployment
Source: Adapted from Bryan Perry, “Household Incomes in New Zealand: Trends in Indicators of Inequality and Hardship 1982
to 2014,” Tables F.3 and F.4 (Wellington: Ministry of Social Development, 2015), 98–99.
30 Bryan Perry, “Household Incomes in New Zealand: Trends
in Indicators of Inequality and Hardship, 1982 to 2014,”
op. cit., pp 52–53 shows that the proportion of households
spending more than 30% of their income on housing has
been highest for the bottom income quintiles since 1988.
Rising housing costs since 1988 have also hit the bottom
quintiles disproportionally on this measure. For example,
for the bottom quintile the proportion tripled from 16% to
48% between 1982 and 1994 and was 41% in 2014. For all
households the proportion was 11% in 1982, 22% in 1994
and 27% in 2014. 31 For relevant statistics, see Ibid., Tables D.2 and D.4.
POORLY UNDERSTOOD: THE STATE OF POVERTY IN NEW ZEALAND 9Table 2: Relative income poverty for children under 18 years, 2014
BEFORE HOUSING COSTS (BHC) AFTER HOUSING COSTS (AHC)
Threshold Relative to Relative to contemporary
Constant value Constant value
type contemporary median median
Total
children
60% 60% 50% 60% 60% 60% 40% 50% 60%
(thousands)
HES year 1998 2007 contemp contemp 1998 2007 contemp contemp contemp
median median median median median median median median median
1982 18 – 11 20 12 – 6 9 14 940
1984 21 – 12 21 15 – 6 10 15 925
1986 20 – 9 20 11 – 5 7 11 895
1988 16 – 7 18 12 – 5 8 13 885
1990 17 – 7 17 16 – 5 7 16 875
1992 33 – 12 25 33 – 9 17 27 875
1994 36 – 10 24 35 – 10 20 29 910
1996 28 – 11 22 32 – 12 20 28 940
1998 20 – 9 20 28 – 14 20 28 950
2001 22 35 12 24 29 37 11 21 30 1020
2004 19 30 14 26 23 31 11 19 28 1040
2007 13 20 13 20 17 22 11 16 22 1065
2009 9 16 12 21 18 24 13 20 26 1070
2010 12 20 14 23 17 26 11 20 30 1065
2011 13 20 13 22 20 25 12 20 27 1067
2012 11 18 12 21 19 24 13 20 27 1047
2013 10 16 11 20 16 22 13 19 24 1064
2014 10 17 14 24 17 23 – 21 29 1058
Source: Bryan Perry, “Household Incomes in New Zealand: Trends in Indicators of Inequality and Hardship 1982 to 2014,”
Tables F.6 and F.7 (Wellington: Ministry of Social Development, 2015), 100–101.
10 THE NEW ZEALAND INITIATIVEIn 2014, the proportion of New Zealanders in Table 3: Relative income poverty rates, 2011–12
relative income poverty ranged between 10% and
20%, depending on the measure.32 Country/ OECD 50% EU 60%
Table 2 provides the corresponding statistics for
Region All 0–17 All 0–17
those under the age of 18 to those in Table 1. The
trends are similar but a key difference is that the New Zealand 10 13 18 20
proportions are larger for children than for the total
Australia 14 13 21 22
population. (On the flip side, the proportions are
lower for the elderly than for the total population.) OECD-34 / EU-27 10 11 17 21
The proportion of those under 18 years in relative
income poverty in 2014 was between 14% and 29%, Source: Adapted from Bryan Perry, “Household Incomes
in New Zealand: Trends in Indicators of Inequality and
depending on the measure (but using the 2007
Hardship 1982 to 2014,” Tables J.1–J.4 (Wellington: Ministry
constant measure instead of 1998), or between of Social Development, 2015), 150–153.
150,000 children (50% BHC contemporary) and
305,000 children (60% AHC contemporary).
Perry comments: It should be borne in mind that many people under
a given ‘income poor’ threshold in New Zealand
The longer-run findings on child poverty will have a lower material standard of living
reflect two factors: first, AHC incomes in 2013 than their counterparts in higher income OECD
for low-income households were around the countries. For example, it does not follow that
same as they were in the 1980s in real terms, New Zealand is doing better than, say, Australia
and second, median household income has because a smaller proportion of New Zealanders
risen in real terms in the period. This means are experiencing lower relative income poverty.
that the incomes of lower-income households As Perry documents, measured income grossly
with children are further from the median (ie understates ongoing consumption for the bottom
there is higher inequality in the lower half of the income decile of the population.35
distribution in 2013 than in the 1980s).33
Relative material hardship poverty
Perry also compares New Zealand’s relative income
poverty rates with the overall OECD and EU rates Measures of relative material hardship focus on
(Table 3).34 New Zealand’s rates are comparable the question of ‘not enough’ rather than on ‘less
with the OECD and EU averages. than’.36
Statistics on the degree to which households feel
they ‘do not have enough’ can be compiled from
survey information. One international source is EU-
13, the European Union’s 13 indicators of material
hardship (Table 4).
32 We follow Perry in discounting the relevance for a
relative income poverty measure of a 1998 threshold by 35 See, Bryan Perry, “Household Incomes in New Zealand:
2014, given the real income growth since 1998. Trends in Indicators of Inequality and Hardship, 1982 to
33 Bryan Perry, “Household Incomes in New Zealand: 2014,” op. cit., 12 and Appendices 8 and 9.
Trends in Indicators of Inequality and Hardship, 1982 to 36 For a list of the indicators of material hardship used to
2013,” op. cit., 24. construct hardship indexes, see Bryan Perry, “Household
34 Bryan Perry, “Household Incomes in New Zealand: Incomes in New Zealand: Trends in Indicators of
Trends in Indicators of Inequality and Hardship, 1982 to Inequality and Hardship, 1982 to 2013,” op. cit., Tables
2014,” op. cit., 148–151. L.1 and L.5, 213 and 223.
POORLY UNDERSTOOD: THE STATE OF POVERTY IN NEW ZEALAND 11Table 4: Composition of EU-13 Table 5: Hardship measures EU-13, 2008 data for
NZ, 2009 for EU countries
have a meal with meat, fish or chicken every second day
Child
keep the home adequately warm Whole
65+ 0–17 Risk
replace worn-out clothes by some new ones Population
Ratio
have two pairs of properly fitting shoes
Material (5+)
replace worn-out furniture
NZ 11% 3% 18% 1.6
have access to a car / van for personal use
UK 11% 6% 16% 1.5
avoid arrears in mortgage or rent, utility bills or HP
instalments Sweden 11% 2% 3% 0.3
spend a small amount of money each week on oneself EU 20 Median
11% 8% 15% 1.4
(approx.)
have both a computer and an internet connection
Severe (7+)
have regular leisure activities
have a get together with friends/family for a drink/meal NZ 4% 1% 8% 2.0
at least monthly UK 4% 2% 6% 1.5
have one week’s annual holiday away from home Sweden 1% 1% 1% 1.0
ability to face unexpected expenses of NZD150037 EU 20 Median
6% 4% 8% 1.3
(approx.)
Source: Bryan Perry, “Measuring and Monitoring Material
Hardship for New Zealand Children: MSD Research and Source: Bryan Perry, “The Material Wellbeing of New
Analysis Used in Advice for the Budget 2015 Child Hardship Zealand Households: Trends and Relativities Using Non-
Package” (Wellington: Ministry of Social Development, Income Measures, with International Comparisons”
2015), 8.37 (Wellington: Ministry of Social Development, 2015), Tables
C.3–C.5, 13–15.
Table 5 summarises measures of hardship in The proportion of New Zealand’s population
New Zealand in 2008 based on EU-13.38 Those experiencing material hardship on the EU-13
who experience 5 or more of the 13 indicators measure was 11% – the same as for Austria,
are deemed to be in ‘material hardship’. Those Belgium, Spain, the United Kingdom, and the
who experience 7 or more of the 13 indicators are median for 20 EU countries. For those older than
deemed to be in ‘severe hardship’. This non-income 64 it was 3% – the same as for Luxembourg and
measure can aid cross-country comparisons on Denmark and well below the 8% median for 20 EU
degrees of ‘absolute hardship’. countries. For those aged 0–17, it was 18% – slightly
higher than the 17% for France, Ireland, Italy and
Estonia, and above the 15% median for 20 EU
countries.
37 For each country, the amount is set at a suitable value
close to (±5%) the per month national income poverty line The proportion of New Zealand’s population
(60% of median) for the one person household. There is
experiencing severe material hardship was 4% –
no adjustment for household size or composition.
the same as for Spain and the United Kingdom and
38 See Bryan Perry, “Measuring and Monitoring Material
Hardship for New Zealand Children: MSD Research below the 6% median for 20 EU countries. For those
and Analysis Used in Advice for the Budget 2015 Child older than 64, it was 1% – the same as for Denmark,
Hardship Package” (Wellington: Ministry of Social Luxembourg, Sweden and the Netherlands, and
Development, 2015), and “The Material Wellbeing of
well below the 4% median for 20 EU countries.
New Zealand Households: Trends and Relativities Using
Non-Income Measures, with International Comparisons” For those aged 0–17 it was 8%, the same as for
(Wellington: Ministry of Social Development, 2015).
12 THE NEW ZEALAND INITIATIVEBelgium, Estonia and Italy, and the median for 20 MSD also calculates hardship statistics for a 17-
EU countries.39 item material deprivation index (DEP-17) from a
2008 Living Standards Survey. Table 6 lists the
New Zealand stands out from the European Union
17 items in this index and shows the number of
on the degree to which child hardship exceeds
people and children living in households that
hardship for the entire population (see the child
reported a need under each item – as a proportion
risk ratio column in Table 5).
of the total population and as a proportion of all
children, respectively.
Table 6: Deprivation indicators (DEP-17), 2008
Item All 0–17 yrs
Enforced lack of essentials (for respondent or household as a whole)
meal with meat, fish or chicken (or vegetarian equivalent) at least each 2nd day 2 3
two pairs of shoes in good repair and suitable for everyday use 5 8
suitable clothes for important or special occasions 7 10
presents for family and friends on special occasions 6 7
home contents insurance 12 16
Economised, cut back or delayed purchases ‘a lot’ because money was needed for other essentials
(not just to be thrifty or to save for a trip or other non-essential)
went without or cut back on fresh fruit and vegetables 10 14
bought cheaper cuts of meat or bought less than wanted 27 37
put up with feeling cold to save on heating costs 10 14
postponed visits to the doctor 11 15
postponed visits to the dentist 26 35
did without or cut back on trips to the shops or other local places 15 21
delayed repairing or replacing broken or damaged appliances 12 19
In arrears more than once in last 12 months (because of shortage of cash at the time, not through forgetting)
rates, electricity, water 11 18
vehicle registration, insurance or warrant of fitness 9 15
Financial stress and vulnerability
borrowed money from family or friends more than once in the last 12 months to cover everyday
13 19
living costs
feel ‘very limited’ by the money available when thinking about purchase of clothes or shoes for
19 29
self (options were: not at all, a little, quite limited, and very limited)
could not pay an unexpected and unavoidable bill of $500 within a month without borrowing 19 25
These figures are based on the information provided by the household’s respondent. For example, in the fresh fruit and vegetables row, 10%
of the population were in households where the respondent said they went without or cut back ‘a lot’ (rather than ‘a little’ or ‘not at all’), and
14% of children (aged 0–17 yrs) were in such households. It does not mean that 14% of children went without fresh fruit or vegetables.
Source: Bryan Perry, “Measuring and Monitoring Material
39 Bryan Perry, “The Material Wellbeing of New Zealand Hardship for New Zealand Children: MSD Research and
Households: Trends and Relativities Using Non-Income Analysis Used in Advice for the Budget 2015 Child Hardship
Measures, with International Comparisons”, op. cit., Package,” Table D.1 (Wellington: Ministry of Social
13–15, Tables C.2–C.5, medians exclude Iceland, Norway Development, 2015), 14.
and New Zealand.
POORLY UNDERSTOOD: THE STATE OF POVERTY IN NEW ZEALAND 13In Table 7, Perry shows the proportions of the total The first three rows in Table 8 replicate the
population and the total child population that information for New Zealand in Table 5 for EU-13,
reported themselves in the 2008 Living Standard but supplement it with incidence measures based
Survey as lacking in the items listed in the table. on DEP-17.
For example, 3% of the population were in
The figures in the ‘SPseven times more likely to experience hardship on at as having a deprivation score of four or more, was
least 10 indicators than children in households where 51%, 39%, 23%, and 15% for Pacific, Māori, Other,
market income is the dominant source of spending and European, respectively. For children in benefit-
power. (Compare the figures in the last two rows of dependent households it was 59%. For those in
the last column in Table 8.) the more numerous households where the primary
source of spending power came from market
There is also a major difference between benefit-
incomes, the proportion was 15%.
and market-income dependent households if
the comparison is restricted to households that Of course, these incidence statistics tell us nothing
fall below a 60% fixed line threshold. Perry about causation.
assesses that in a recent three-year period, the
A high incidence for a small subgroup of the
incidence was 75% for primarily benefit-dependent
population does not imply a high contribution to
households and 12% for primarily market income-
the total. Perry observes that around half the poor
dependent households.40
children come from two parent families and half
The incidence of hardship for Māori is around three from sole parent families.41
times that for European New Zealanders. (Compare
the 7th and 8th rows of Table 8.) The high proportion of children in households
experiencing high rates of relative material
Figure 2 shows that the incidence of child hardship is particularly concerning. After all,
hardship varies greatly according to ethnicity and children don’t choose their parents and have
benefit dependency. The proportion of children limited other choices.
experiencing material hardship in 2008, defined
Figure 2: Child hardship by ethnic group and source of disposable income
Source: Bryan Perry, “Child Poverty and Living Standards” (The Child Poverty Monitor, 2014), Figure 11, 34.
40 Bryan Perry, “Household Incomes in New Zealand:
Trends in Indicators of Inequality and Hardship, 1982
to 2014.” op. cit., 133, also reports that 63% of children
deemed to be in income-poor households using
this threshold were in households mainly deriving
disposable income from benefits and 37% were in 41 Bryan Perry, “Household Incomes in New Zealand:
market-income households. (Households mainly reliant Trends in Indicators of Inequality and Hardship 1982 to
on benefits accounted for 22% of all children.) 2014,” op. cit., 122.
POORLY UNDERSTOOD: THE STATE OF POVERTY IN NEW ZEALAND 15The incidence of child hardship is particularly high Table 9: Material hardship measures, 2007–14
for sole parents under the age of 65 – 22% of such
households in 2008 for a severe threshold, and 38% Less stringent More stringent
for a less severe threshold. threshold threshold
The incidence is particularly high for Māori 7+ on DEP-17 9+ on DEP-17
households – 11% in 2008 for a severe threshold,
ALL 0–17 65+ ALL 0–17 65+
and 25% for a less severe threshold, as against 4%
and 11% respectively for all households. 2007 10 14 4 4 6 1
The incidence of relative material hardship in 2008
2009 11 16 4 5 9 3
was much higher in benefit-dependent households
than in households whose major source of income 2010 12 20 3 5 9 1
was market income. On the severe threshold it was
2011 13 21 3 6 10 1
seven times higher (28% vs 4%), and five times
higher (51% vs 10%) for a less severe threshold. 2012 11 17 5 5 9 2
Even so, low market household incomes are an 2013 9 15 2 5 9 1
issue. The highest incidence households are a
minority. Households mainly dependent on market 2014 8 14 2 5 8 1
incomes contain roughly half the children in
New Zealand below a relative material hardship
Source: Bryan Perry, “The Material Wellbeing of New
threshold. The number of children in two-parent Zealand Households: Trends and Relativities Using
households below a threshold is roughly the same Non-Income Measures, with International Comparisons”
as for one-parent households. (Wellington: Ministry of Social Development, 2015), Table
G.2, 59.
Table 9 shows trends in two material hardship
measures between 2007 and 2014. In 2014, the Table 10: Material hardship rates for children,
severe hardship rates (DEP-17 9+) for the entire 2007–14
population, those under age 18, and those who
were 65+ were 5%, 8%, and 1%, respectively. For ≡ 7+ on DEP-17 ≡ 9+ on DEP-17
the less severe threshold measure (DEP-17 7+) it HES year
rate (%) numbers rate (%) numbers
was 8%, 14%, and 2%, respectively.
The marked difference between the experiences 2007 14 145,000 6 65,000
of the 65+ group and the rest is also evident in
2009 16 170,000 9 95,000
comparing the 2007 and 2011 rates. New Zealand
Superannuation gives the elderly an easier ride 2010 20 210,000 9 90,000
through economic downturns.
2011 21 220,000 10 105,000
Table 10 shows that the 8% ‘severe hardship’ rate
in 2014 represented 80,000 children. This was still 2012 17 180,000 9 90,000
higher than in pre-recession 2007, but appreciably
2013 15 165,000 9 100,000
down from the 105,000 peak in 2011. For the ‘less
severe’ threshold, the number in 2014 was 145,000, 2014 14 145,000 8 80,000
the same as in 2007 and well down from the
220,000 peak in 2011. Source: Bryan Perry, “The Material Wellbeing of New
Zealand Households: Trends and Relativities Using
Non-Income Measures, with International Comparisons”
(Wellington: Ministry of Social Development, 2015), revised
Table G.3, 60–61.
16 THE NEW ZEALAND INITIATIVEMismatch between relative income the lack of overlap between the households falling
measures of poverty and hardship into each category? Even in respect of material
hardship, the article interpreted a MSD finding that
Perry reports that “[t]he overlap between the around 14% of children were in households that
income poor and materially deprived groups cut back or did without fresh fruit and vegetables
is modest across all EU countries and for New a lot, as “go[ing] without the essentials – fruit,
Zealand, typically of the order of 35% to 45% for vegetables, warm housing and clothing”. Cutting
the population as a whole”.42 back a lot does not mean going without.
In 2012, of those deemed to be experiencing
material hardship, around 17% were in households Persistence of income and material
with incomes greater than the median household hardship poverty
income; 33% in households with incomes greater
Parental income affects children’s income when
than a 60% AHC threshold but below the median
they become adults.45 A New Zealand Treasury
household income; and 48% in households with
working paper by Matthew Gibbons tentatively
incomes less than the 60% AHC threshold. Those in
found using statistics for people born in Dunedin
the 48% group are likely to experience the greatest
in 1972–73 that “a 1% increase in the income of a
stress and need of these groups.43
person’s father is associated with, on average, a
Perry has expressed concern about the degree 0.26% increase in their own income when they
to which some users attribute child-specific are an adult”.46 This result is “probably within a
material lacks (e.g. raincoats and school trips) similar range to rates for people from most other
and household deprivations (e.g. lack of good developed countries”.47 Gibbons found that the
heating and meals) to all those below a given rate of intergenerational mobility is affected
income threshold. His statistics indicate that most internationally by:
children in households with incomes under a 60%
the quality of its education system;
AHC threshold “have all or almost all of the listed
items. Less than half the children under the AHC the rate of economic growth;
60% and 50% income thresholds are in families
children’s physical and emotional environment;
experiencing hardship under the ‘standard’ EU
and
deprivation measure”.44
opportunities for children to improve and use
Regardless, the front page of the Dominion Post on
their capabilities.48
15 December 2015 headlined that nearly a third,
or 305,000 (29%) of children in New Zealand are Gibbons found evidence of “a relatively high
living in poverty. However the remainder of the degree of intergenerational mobility” for those
article used statistics of material hardship to justify whose fathers were in the lowest two deciles for
calls for greater government action to reduce socioeconomic status. He also found that “[t]hose
“child poverty”. It thereby conflated two notably born into families in the top two deciles seem less
different categories. Yet, if material hardship is the likely to be downwardly mobile than those in the
real concern, why headline a much higher income-
based statistic and why fail to note the extent of
45 As would be expected from genetic and environmental
42 Bryan Perry, “The Material Wellbeing of New Zealand considerations.
Households,” op. cit., 52. 46 Matthew Gibbons, “Income and Occupational
43 Ibid., 53, particularly Figure F.2. Intergenerational Mobility in New Zealand,” Working
Paper 10/06 (Wellington: New Zealand Treasury, 2010), 1.
44 Bryan Perry, “Household Incomes in New Zealand:
Trends in Indicators of Inequality and Hardship 1982 to 47 Ibid., 2.
2014,” op. cit., Annex to Section H, 131. 48 Ibid., 1–2.
POORLY UNDERSTOOD: THE STATE OF POVERTY IN NEW ZEALAND 17You can also read